Starbucks Builds AI Tools to Drop Microsoft, IBM and Oracle Apps
4 hrs ago
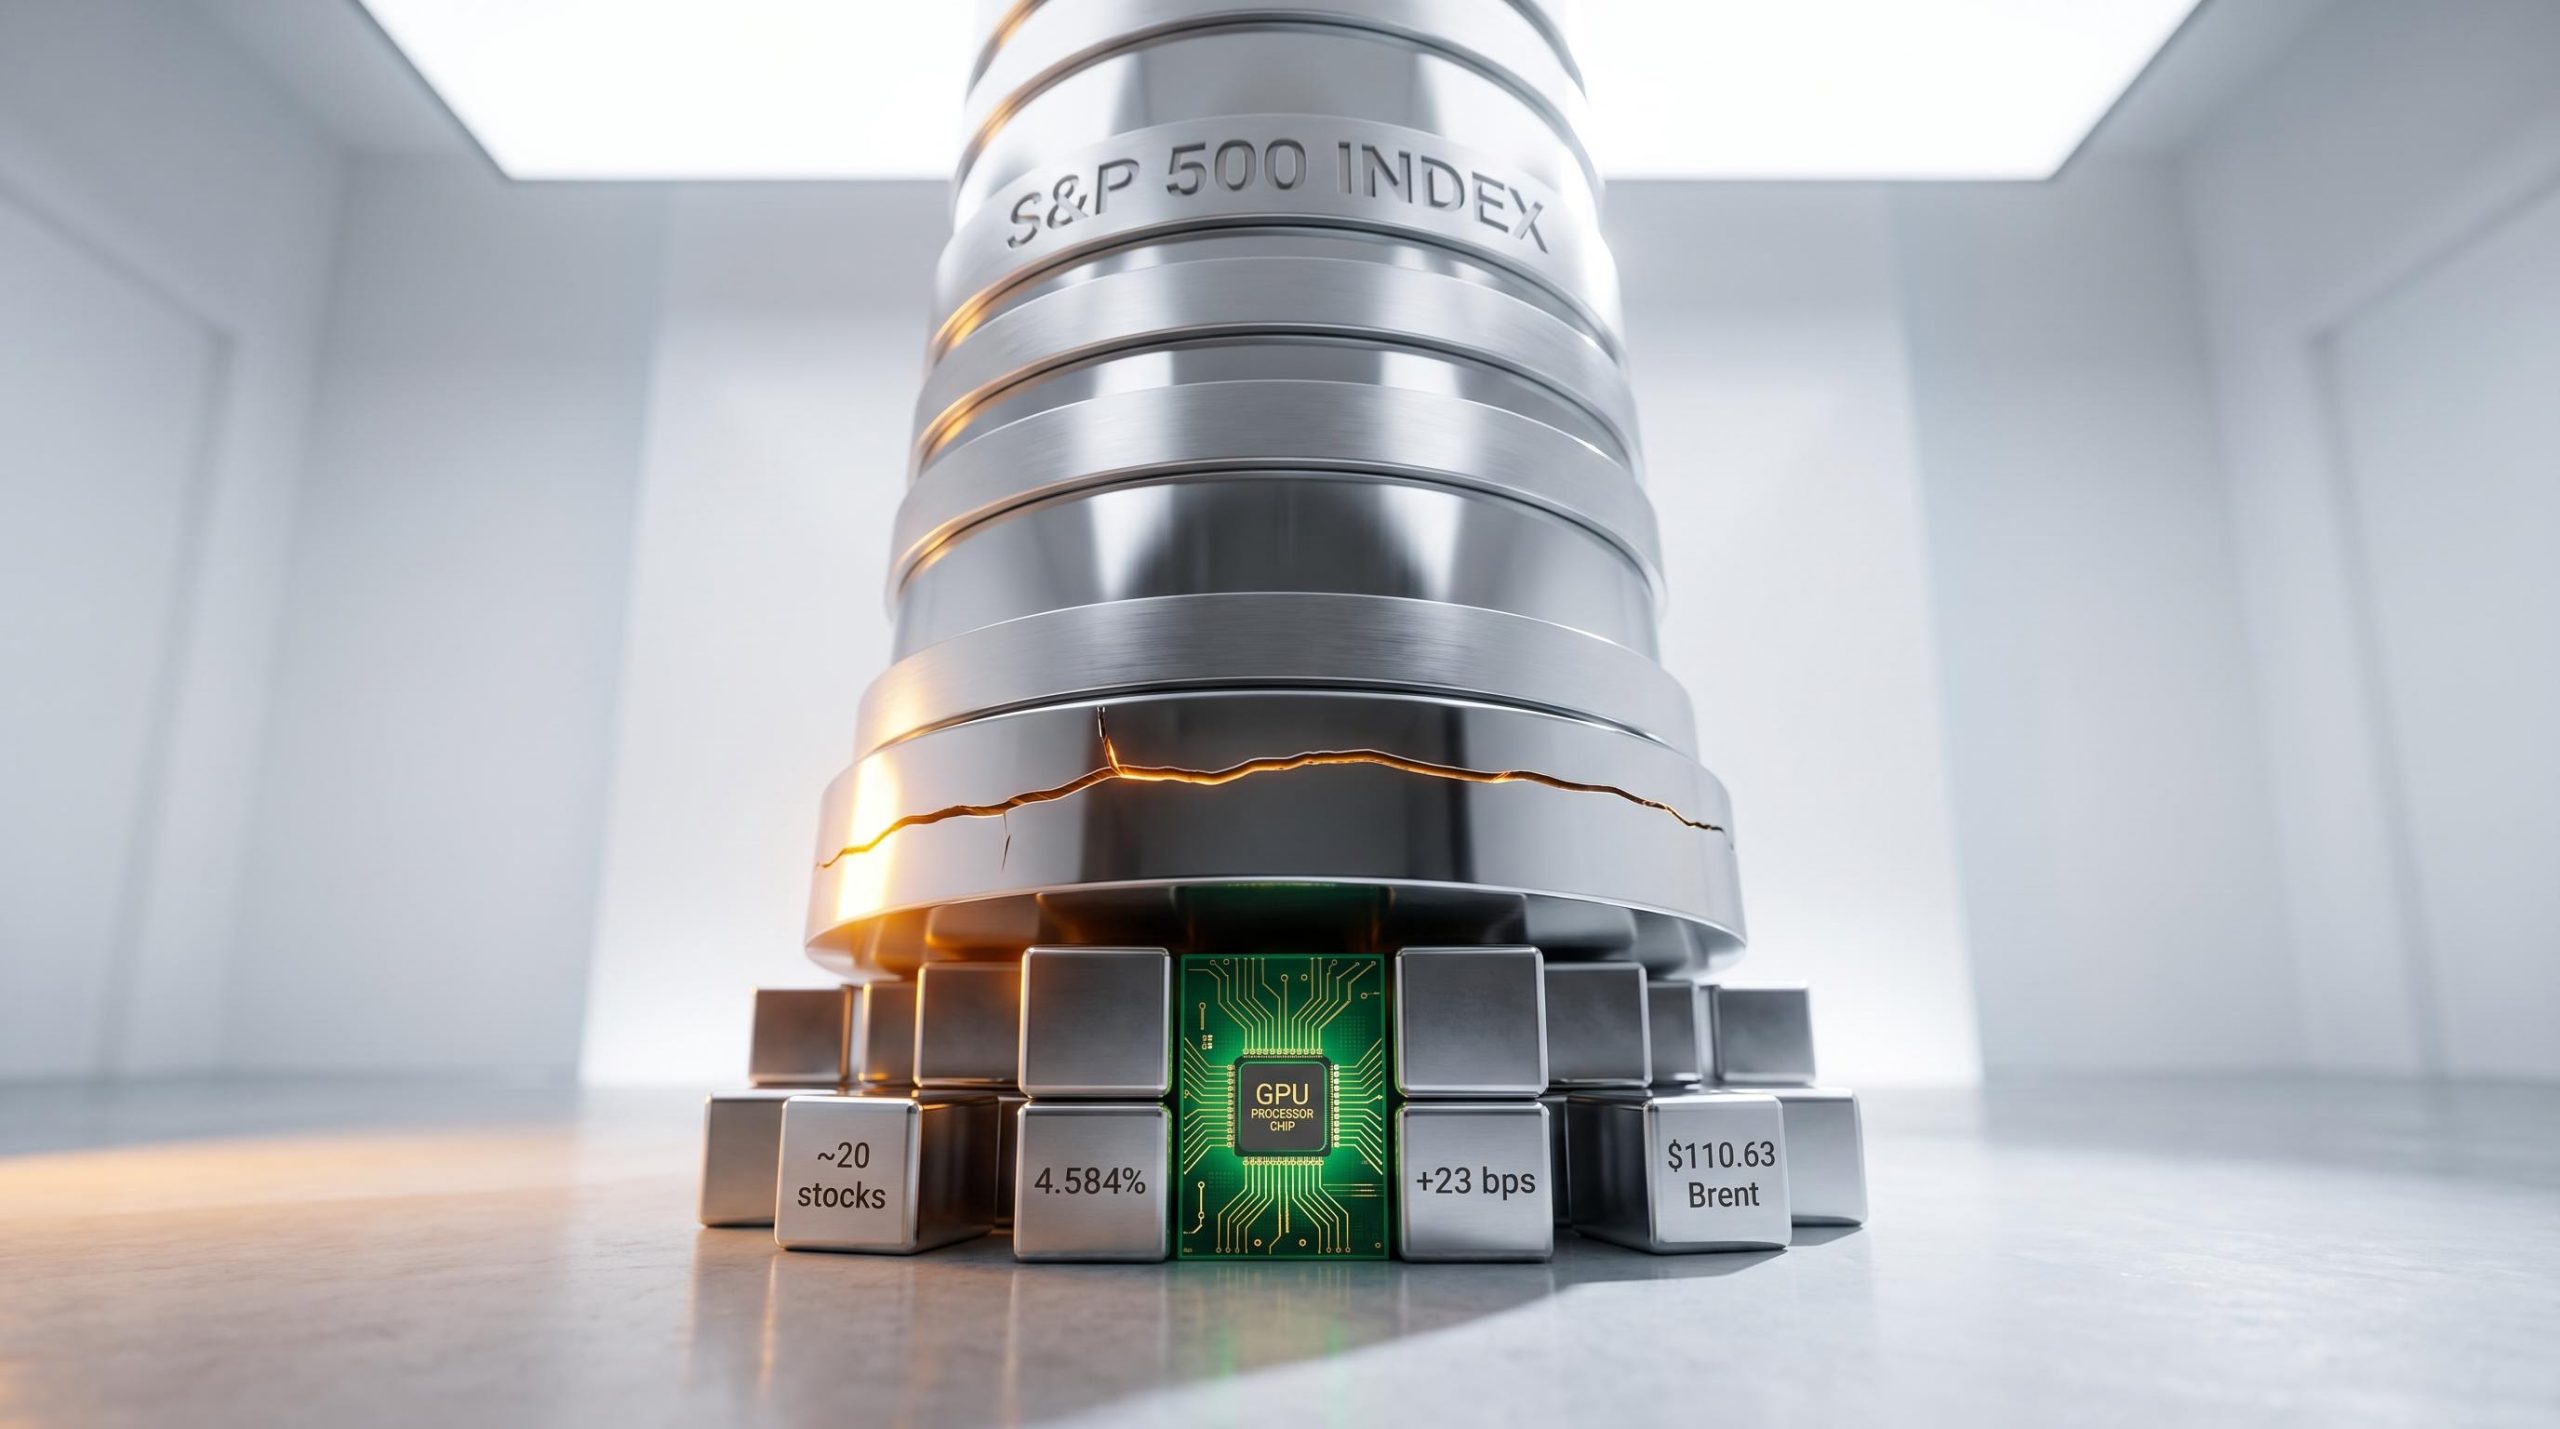
Approximately 20 stocks drove the majority of S&P 500 index-level earnings outperformance during the recent reporting season. That figure, on its own, might suggest concentrated leadership in a strong market. Then the composition of those earnings comes into focus. Citi analyst Scott Chronert found that roughly half of the improvement came from non-recurring items, including tariff-related add-backs and asset revaluations. Strip those out and the earnings foundation supporting current index levels narrows further still. It is the week of 18 May 2026. Nvidia reports on Wednesday. The Strait of Hormuz remains effectively closed. Brent crude is trading above $110 per barrel. Ten-year Treasury yields climbed 23 basis points last week. The confluence of a single high-stakes earnings event, a structural breadth problem, and an external macro shock arriving simultaneously is not routine market noise. What follows is an analysis of what the current rally is actually built on, where the genuine structural vulnerabilities sit, whether AI infrastructure spending provides durable support, and what the Nvidia result could confirm or shatter for investors holding concentrated index exposure.
The S&P 500 near record highs looks, at first glance, like broad American corporate strength. The number underneath that headline tells a different story.
Three data points frame the problem:
The top 10 names now represent approximately 39-40% of index market capitalisation. On a trailing-12-month basis, those 10 stocks have outperformed the remaining 490 by roughly 12 percentage points, a gap Subramanian described as “one of the widest spreads on record.”
“Narrow leadership has historically preceded lower forward returns when combined with elevated valuations.” — Savita Subramanian, Bank of America
The implication is direct. Investors in passive index funds believe they hold diversified U.S. equity exposure. The data shows they are making a concentrated bet on fewer than 20 companies, with much of the recent earnings progress built on items that will not carry forward.
If the earnings concentration data is the diagnosis, breadth indicators are the vital signs confirming it in real time.
Start with participation. As of 15 May 2026, just 50.9% of S&P 500 constituents were trading above their 200-day moving average. In March, that figure sat above 70%. The decline has been steep and steady.
Ryan Detrick of Carson Group noted this “shows weakening breadth beneath the surface of the index.”
| Indicator | Current Reading | Signal |
|---|---|---|
| % above 200-day MA | 50.9% (15 May), down from >70% in March | Declining participation |
| NYSE advance-decline line | Trending sideways to lower since early April | Bearish divergence from index highs |
| New 52-week highs vs. new lows | Highs stagnant since March; new lows ticking up | Fading breadth confirmation |
The NYSE advance-decline line has failed to confirm recent S&P 500 highs, a negative divergence that technicians treat as one of the more reliable early warning signals. When the index makes new highs but fewer stocks participate in the advance, the rally is borrowing performance from a shrinking group of leaders. Ned Davis Research data shows new 52-week highs on the NYSE have not expanded meaningfully since March, while new lows have ticked upward.
One nuance deserves mention. On a year-to-date basis, the equal-weight S&P 500 has not uniformly underperformed the cap-weighted version, suggesting the concentration problem has a longer structural dimension rather than being purely a 2026 phenomenon. The trailing-12-month gap cited by Subramanian reflects a pattern that has been building across multiple quarters.
That borrowing, historically, eventually gets recalled.
The breadth deterioration visible in the 200-day moving average data extends further than a single month: as of early May 2026, only 22% of S&P 500 constituents had outperformed the index on a 30-day basis, a reading that ranks as the lowest in 30 years and that has historically preceded drawdowns of 5-15% within 60 days roughly 80% of the time.
Consider the mechanics from the perspective of an individual holding an S&P 500 index fund. Approximately 39-40% of that capital is allocated to just 10 companies, most of them linked to AI and digital platforms. Goldman Sachs estimates the AI cohort represents roughly 55% of 2026 estimated index earnings per share growth.
Market concentration risk describes the condition where a small number of stocks or sectors represent a disproportionate share of an index. When that concentration exists, the performance of the entire index becomes highly sensitive to those names.
The mechanics transmit to portfolio outcomes in three steps:
Passive index concentration has a compounding mechanical dimension that goes beyond headline weighting figures: as a mega-cap stock rises, its index weight automatically increases and directs additional capital into it regardless of valuation, a feedback loop that drove the cap-weighted S&P 500 to return 86% over three years versus 43% for the equal-weighted version, with the entire performance gap attributable to multiple expansion rather than superior earnings growth.
“Investors owning the S&P 500 today are making a much larger implicit bet on AI-linked mega-caps than at any time outside the dot-com era.” — Michael Batnick, Ritholtz Wealth Management
BlackRock’s Wei Li cautioned about “concentration risk in benchmark-tracking portfolios” and recommended considering factors or sectors that rebalance away from the largest names. Cliff Asness of AQR acknowledged the concentration is “reminiscent of prior episodes” but noted that today’s leaders have stronger fundamentals than late-1990s technology companies, an observation that provides context without predetermining the outcome.
Nvidia shares are up approximately 36% from their March 2026 low. The Philadelphia Semiconductor Index surged more than 60% over the same period. Those recoveries reflect a market that has decided the AI infrastructure cycle is durable. Wednesday’s Q1 FY2027 results (consensus: revenue approximately $78.5-$78.8 billion, adjusted EPS approximately $1.75-$1.77) will test whether that conviction holds.
| Hyperscaler | Q1 2026 Capex Reported | FY2026/2027 Guidance | AI Infrastructure Comment |
|---|---|---|---|
| Microsoft | Elevated (within mid-$40B annual run rate) | Low-to-mid $50 billion for FY2027; mid-teens % YoY growth | Deploying Nvidia-based clusters and custom silicon |
| Alphabet | $12.1 billion | Elevated investment expected for full year 2026 | Referencing both GPUs and TPUs for AI |
| Amazon | Stepped-up for AWS infrastructure | Increased capex for generative AI and ML | Strong demand for GPU clusters and custom chips |
| Meta | Elevated | $38-$42 billion for 2026, raised from prior guidance | Accelerating AI infrastructure investment |
The AI infrastructure cycle backstory underpinning Wednesday’s consensus figures runs deeper than a single quarter of hyperscaler guidance: data centre revenue is expected to reach roughly $72.8-$73.1 billion, accounting for approximately 93% of Nvidia’s total company revenue, a near-total alignment of the company’s financials with committed AI buildout spending that makes management commentary on demand trajectory as consequential as the headline beat.
The dollars behind the AI buildout are real. TSMC’s high-performance computing category grew more than 50% year-on-year in Q1 2026. Samsung reported HBM3E memory “effectively sold out for 2026.” SK Hynix committed to significantly increasing HBM capacity, citing “very strong” AI server demand.
CEO Jensen Huang told the GTC conference in March 2026 that “global demand for accelerated computing far exceeds supply” and referenced “multi-year purchase commitments” from hyperscalers. These are not quarter-by-quarter discretionary budgets. Goldman Sachs projects global AI data-centre capex could reach $350 billion annually by 2028, up from approximately $175 billion in 2025.
Goldman itself acknowledged the tension: “equity winners are more concentrated than spending itself, with Nvidia and a few others capturing an outsized share of profit pools.” The AI capex boom is broad; the equity market’s reward for it is narrow.
Bernstein Research flagged that “investor expectations for leading GPU vendors may be running ahead of what even a robust cycle can deliver.” The firm sees inference and enterprise workloads as a potential second phase that could broaden the profit pool, but that phase remains prospective, not yet reflected in quarterly earnings.
Supply constraints add another layer. If Nvidia’s guidance disappoints, the cause could be something worse than softening demand: physical limitations that prevent revenue from matching committed orders.
The Strait of Hormuz remains effectively closed, and the consequences are compounding. Brent crude settled at $110.63 per barrel on 18 May 2026, up approximately 1.2% on the day. U.S. 10-year Treasury yields reached 4.584%, climbing 23 basis points over the prior week. The 30-year yield hit 5.109%, up 18 basis points over the same period.
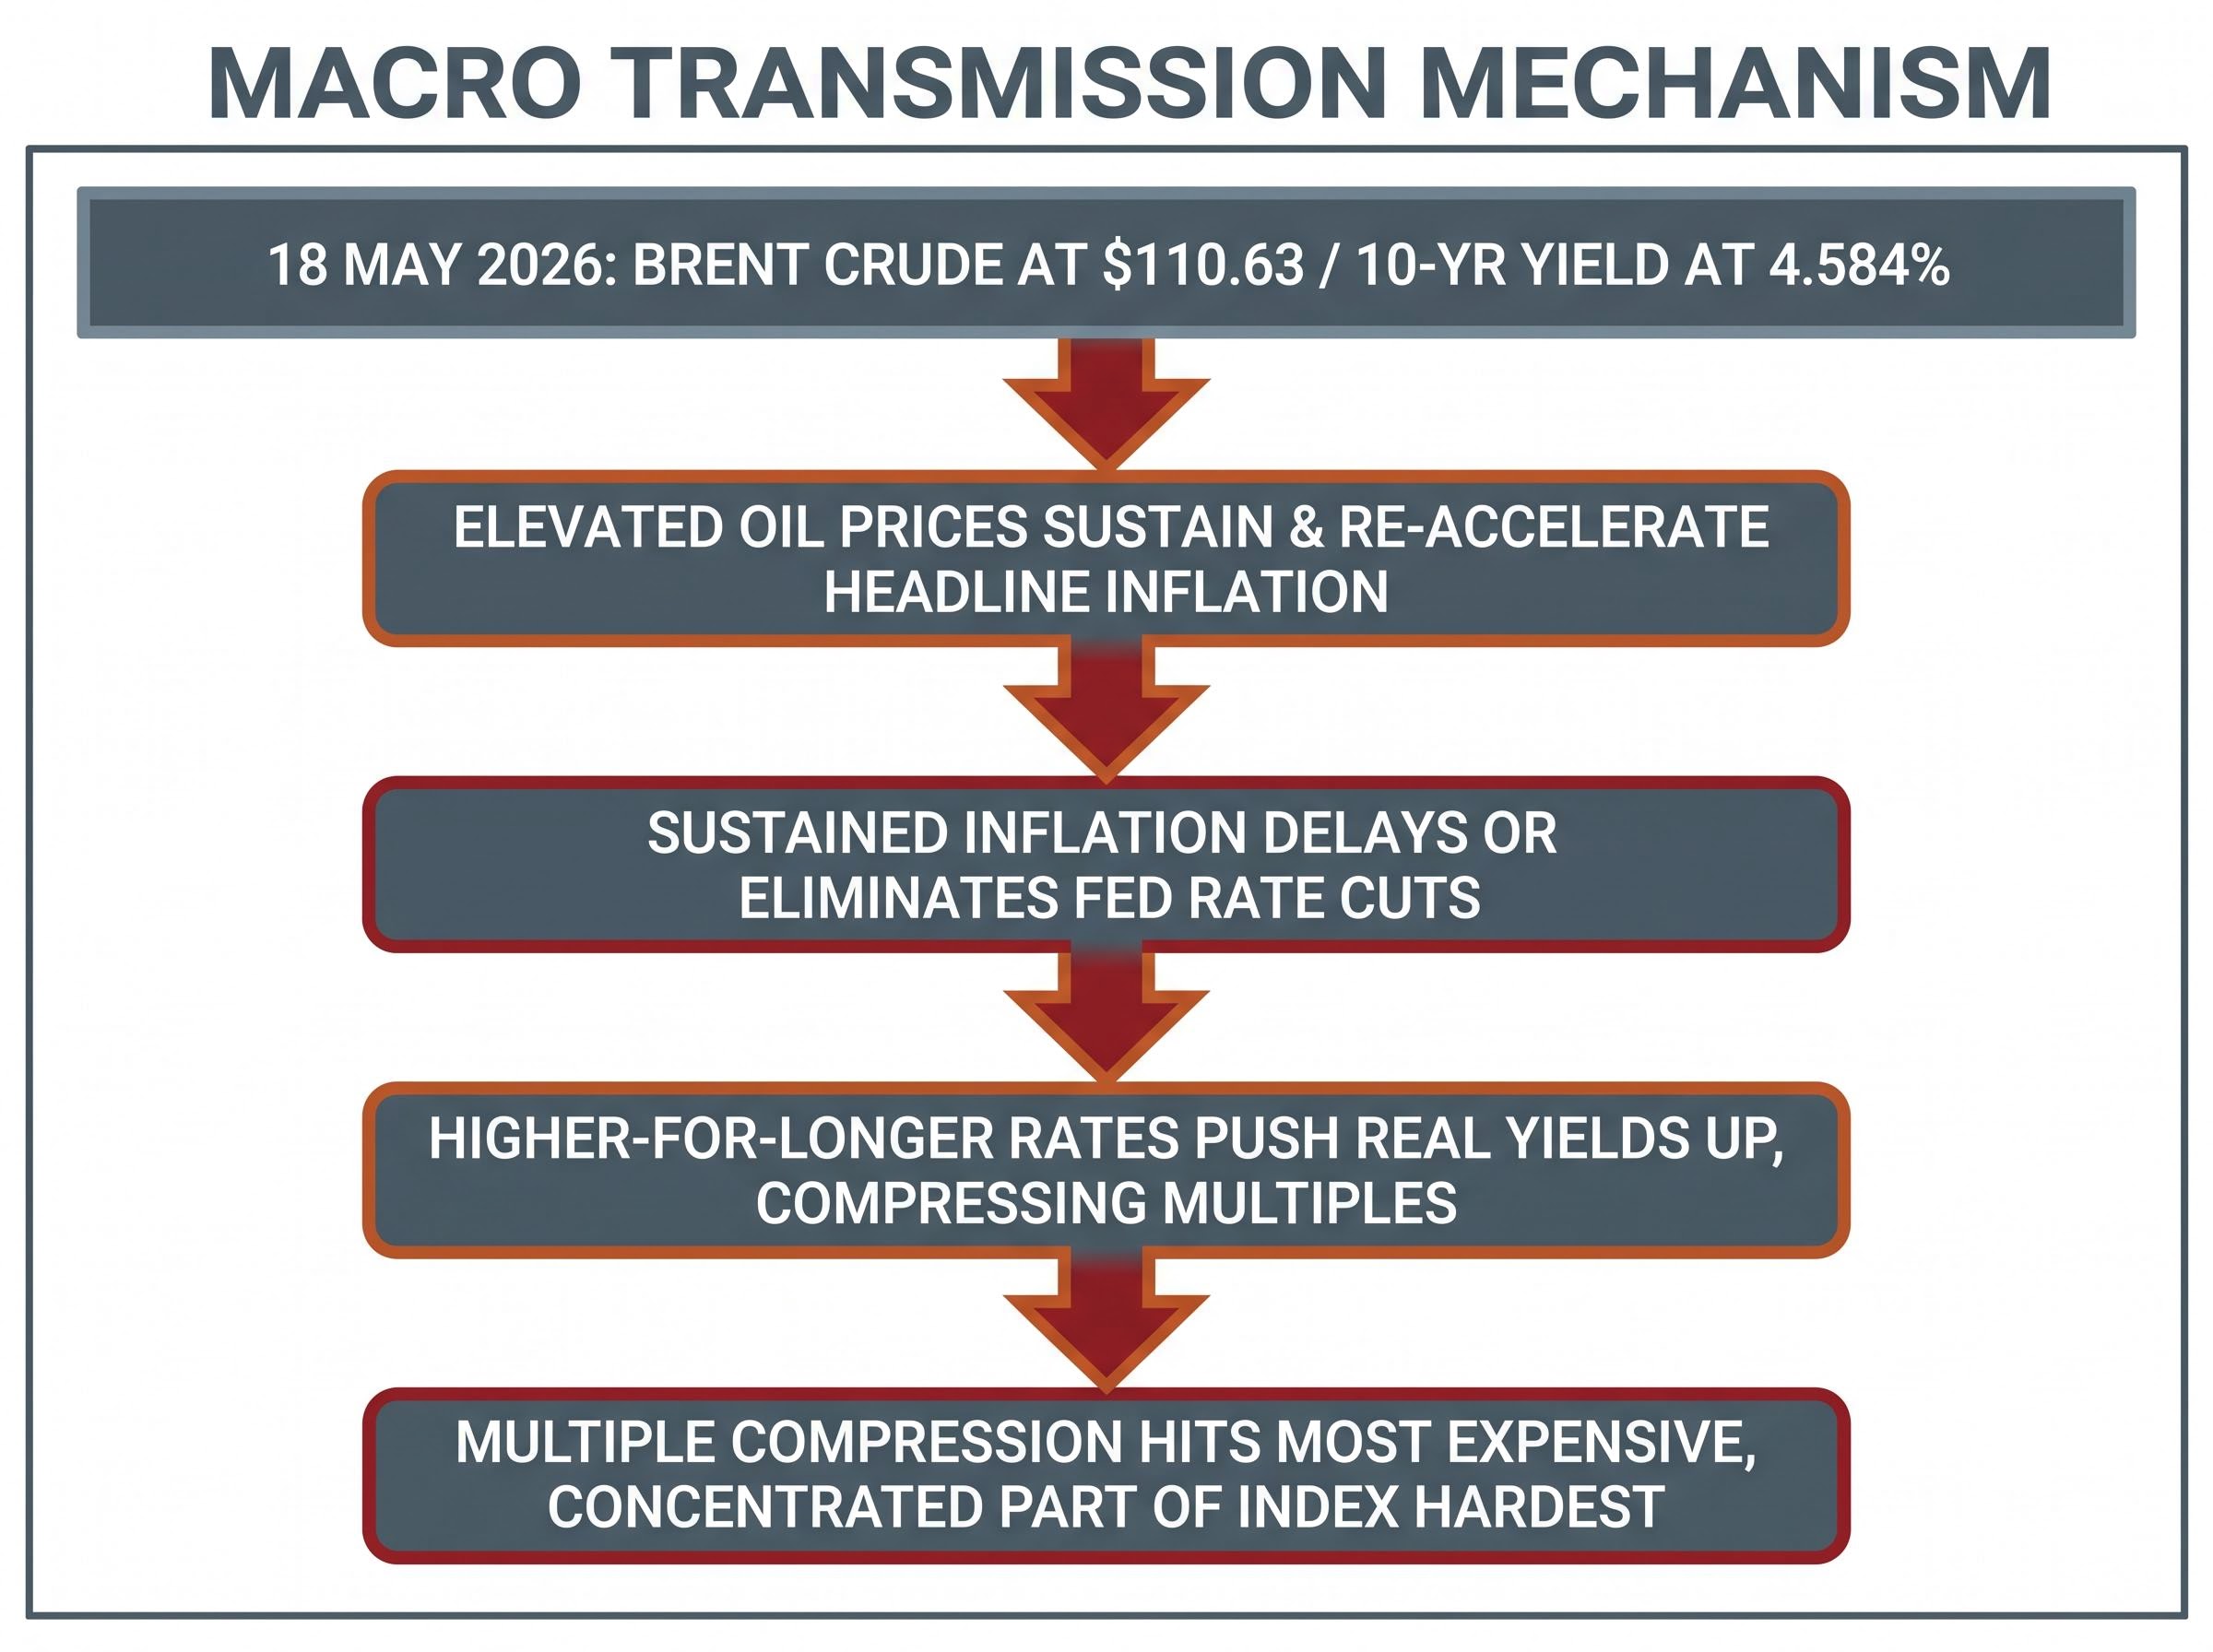
The transmission from oil prices to equity valuations runs through four steps:
Oil shock transmission into recessions follows a documented structural pattern: every major U.S. recession since 1973 has been preceded by an oil shock operating through the same four channels now visible in 2026, with Moody’s Analytics placing the 12-month U.S. recession probability at 48.6% and Morgan Stanley modelling an adverse scenario in which Brent reaches $150-$180 per barrel if the Strait remains blocked for several months.
Goldman Sachs estimates sustained oil above $100 could add 30-40 basis points to 2026 core PCE relative to baseline, and that historically, a $10 oil increase shaves approximately 1-1.5 percentage points off S&P 500 earnings growth when sustained. JPMorgan’s Mislav Matejka warned of 3-4% downside risk to consensus 2026 EPS if Brent stays above $100.
“S&P 500 forward P/E near 20x leaves little margin for error if real yields rise further.” — Lisa Shalett, Morgan Stanley Wealth Management
Capital Economics warned that global oil stockpiles could deteriorate to critically low levels by end of June 2026 if the strait remains closed, with Brent potentially reaching $130-$140 per barrel or higher. Jason Furman, former Chair of the Council of Economic Advisers, wrote that sustained oil above $100 could “force the Fed to keep rates high for longer than markets anticipate.”
The energy shock and the concentration problem are not separate stories. They compound each other. The macro environment has become actively hostile to the specific valuation conditions, easy financial conditions and unrevised earnings growth assumptions, that elevated AI stock prices require.
Three specific conditions would need to materialise for the current market structure to resolve constructively:
Walmart and other retailer earnings, also due this week, provide a parallel signal. Consumer durability under elevated energy costs is the other half of the soft-landing equity narrative. Fed meeting minutes due Wednesday 21 May arrive alongside Nvidia’s results, a simultaneous macro signal.
“Breadth remains historically narrow and leaves the index vulnerable if AI leaders stumble.” — Mike Wilson, Morgan Stanley
The asymmetry is clear. If all three conditions hold, the bull case remains intact. If Nvidia disappoints on guidance, breadth continues deteriorating, and Brent climbs toward the $130-$140 Capital Economics scenario, the concentration risk identified throughout this analysis becomes the mechanism of a sharper drawdown. Goldman has noted “earnings leadership is unusually concentrated in fewer than 20 stocks.” JPMorgan’s Marko Kolanovic warned of “fragility if positioning reversed or earnings disappointed” from those top names.
The framework is conditional rather than predictive, giving investors specific observable outcomes to monitor as the week unfolds.
The concentration data, the breadth deterioration, the macro headwinds, and the AI infrastructure spending commitments all converge on Wednesday’s Nvidia result as a genuine inflection point. Approximately 20 stocks continue to drive the majority of S&P 500 index earnings outperformance, per Citi’s Chronert. The long-run bull anchor, Goldman’s projection of $350 billion in annual AI data-centre capex by 2028, sits on one side of the scale. The near-term downside risk, Capital Economics’ oil scenario of $130-$140 per barrel by end of June, sits on the other.
Both the durability thesis and the speculative-excess thesis can be partly right. Goldman and Bank of America’s semiconductor teams see multi-year visibility in AI infrastructure. Grant’s Interest Rate Observer and Bloomberg Opinion see signs that the equity market’s pricing of that cycle has outrun its earnings delivery. The honest answer is that both readings contain verifiable elements.
The question to hold in mind as Wednesday’s results arrive is not whether Nvidia beats consensus by a few cents. It is whether management’s forward guidance reflects demand that is accelerating, stable, or showing any sign of digestion. That distinction determines whether the concentration that defines this market is a feature of durable strength or the architecture of vulnerability.
“The margin for policy error is shrinking for equities priced for near-perfection.” — Mohamed El-Erian
This article is for informational purposes only and should not be considered financial advice. Investors should conduct their own research and consult with financial professionals before making investment decisions. Past performance does not guarantee future results. Financial projections are subject to market conditions and various risk factors.
Market concentration risk refers to the condition where a small number of stocks represent a disproportionately large share of an index, making the entire index highly sensitive to the performance of those few names. In the S&P 500 as of mid-2026, the top 10 stocks account for approximately 39-40% of total index market capitalisation.
When earnings outperformance is concentrated in roughly 20 stocks, investors in passive index funds face far less diversification than they may expect, because a stumble in those leading names hits the entire index harder than the individual stock weights suggest. Citi analyst Scott Chronert also found that roughly half of the recent earnings improvement came from non-recurring items, meaning the underlying earnings foundation is even narrower than the headline numbers imply.
Elevated oil prices sustain inflation, which delays Federal Reserve rate cuts and pushes real yields higher, compressing the valuation multiples that growth and AI-linked stocks trade on. Goldman Sachs estimates that sustained oil above $100 per barrel could add 30-40 basis points to 2026 core PCE and shave approximately 1-1.5 percentage points off S&P 500 earnings growth.
As of 15 May 2026, only 50.9% of S&P 500 constituents were trading above their 200-day moving average, down from above 70% in March, and the NYSE advance-decline line has failed to confirm recent index highs. In addition, only 22% of S&P 500 constituents had outperformed the index on a 30-day basis, a reading that ranks as the lowest in 30 years.
Analysts identify three conditions: Nvidia must beat and raise guidance substantially to confirm accelerating AI demand, breadth indicators must reverse with more constituents participating in the advance, and energy prices must moderate enough to relieve yield pressure on growth stock valuations. If all three hold, the bull case remains intact; if even one fails, the concentrated structure of the index amplifies the downside risk.