REA Group attracts more than 55 million visits per month to realestate.com.au and commands roughly 80% of Australian real estate audience minutes. Yet the stock has fallen more than 12.3% since the start of 2025, and its price-to-sales ratio has compressed from a five-year average of 17.41x to 12.72x. For investors evaluating ASX shares to buy in a market where rate-cut expectations are reshaping property transaction volumes and repricing platform businesses, that gap between structural dominance and market pricing is the question worth answering. This article works through REA Group’s competitive position, revenue model, market outlook, and valuation framework so the reader can form a grounded view on whether the current pullback represents a buying opportunity or a structural re-rating.
How REA Group actually makes its money
REA Group’s core revenue comes from property listing fees charged to approximately 20,000 real estate agents nationally. The business operates across three revenue pillars:
- Core Australian listings: Listing fees and depth products (Premier, Highlight tiers) sold to agents, generating the bulk of group revenue and growing through both volume and pricing
- Financial services integration: Mortgage broking tools embedded within realestate.com.au, designed to capture a share of the home-loan funnel alongside property search
- International associates: Income from REA’s stake in Elara Technologies (owner of Housing.com, Makaan.com, and PropTiger.com in India) and participation in Move, Inc. (realtor.com) through News Corp’s structure
Financial services and international income are meaningful contributors, but they are not yet dominant. The Australian listing business remains the engine.
The depth product model and pricing power
Depth products allow REA to extract more revenue per listing as agents compete for vendor attention. Premier and Highlight tiers function as a pricing escalator: when agents upgrade campaigns to stand out, REA’s average revenue per agent (ARPA) rises independently of listing volume growth.
Growth in ARPA and depth revenue penetration through FY25 and into FY26 confirms this pricing power remains intact. Q3 FY26 revenue reached $398 million, up 11% excluding mergers and acquisitions, with operating EBITDA (excluding associates) of $220 million, up 16% on the same basis.
That operating leverage is the feature investors need to understand. Because the cost base is relatively fixed, revenue grows faster than the market in active listing periods and contracts more sharply in slow ones. The rate environment matters to REA because it matters to listing volumes, and listing volumes are the single variable that moves the P&L most.
When big ASX news breaks, our subscribers know first
The moat in numbers: why Domain cannot close the gap
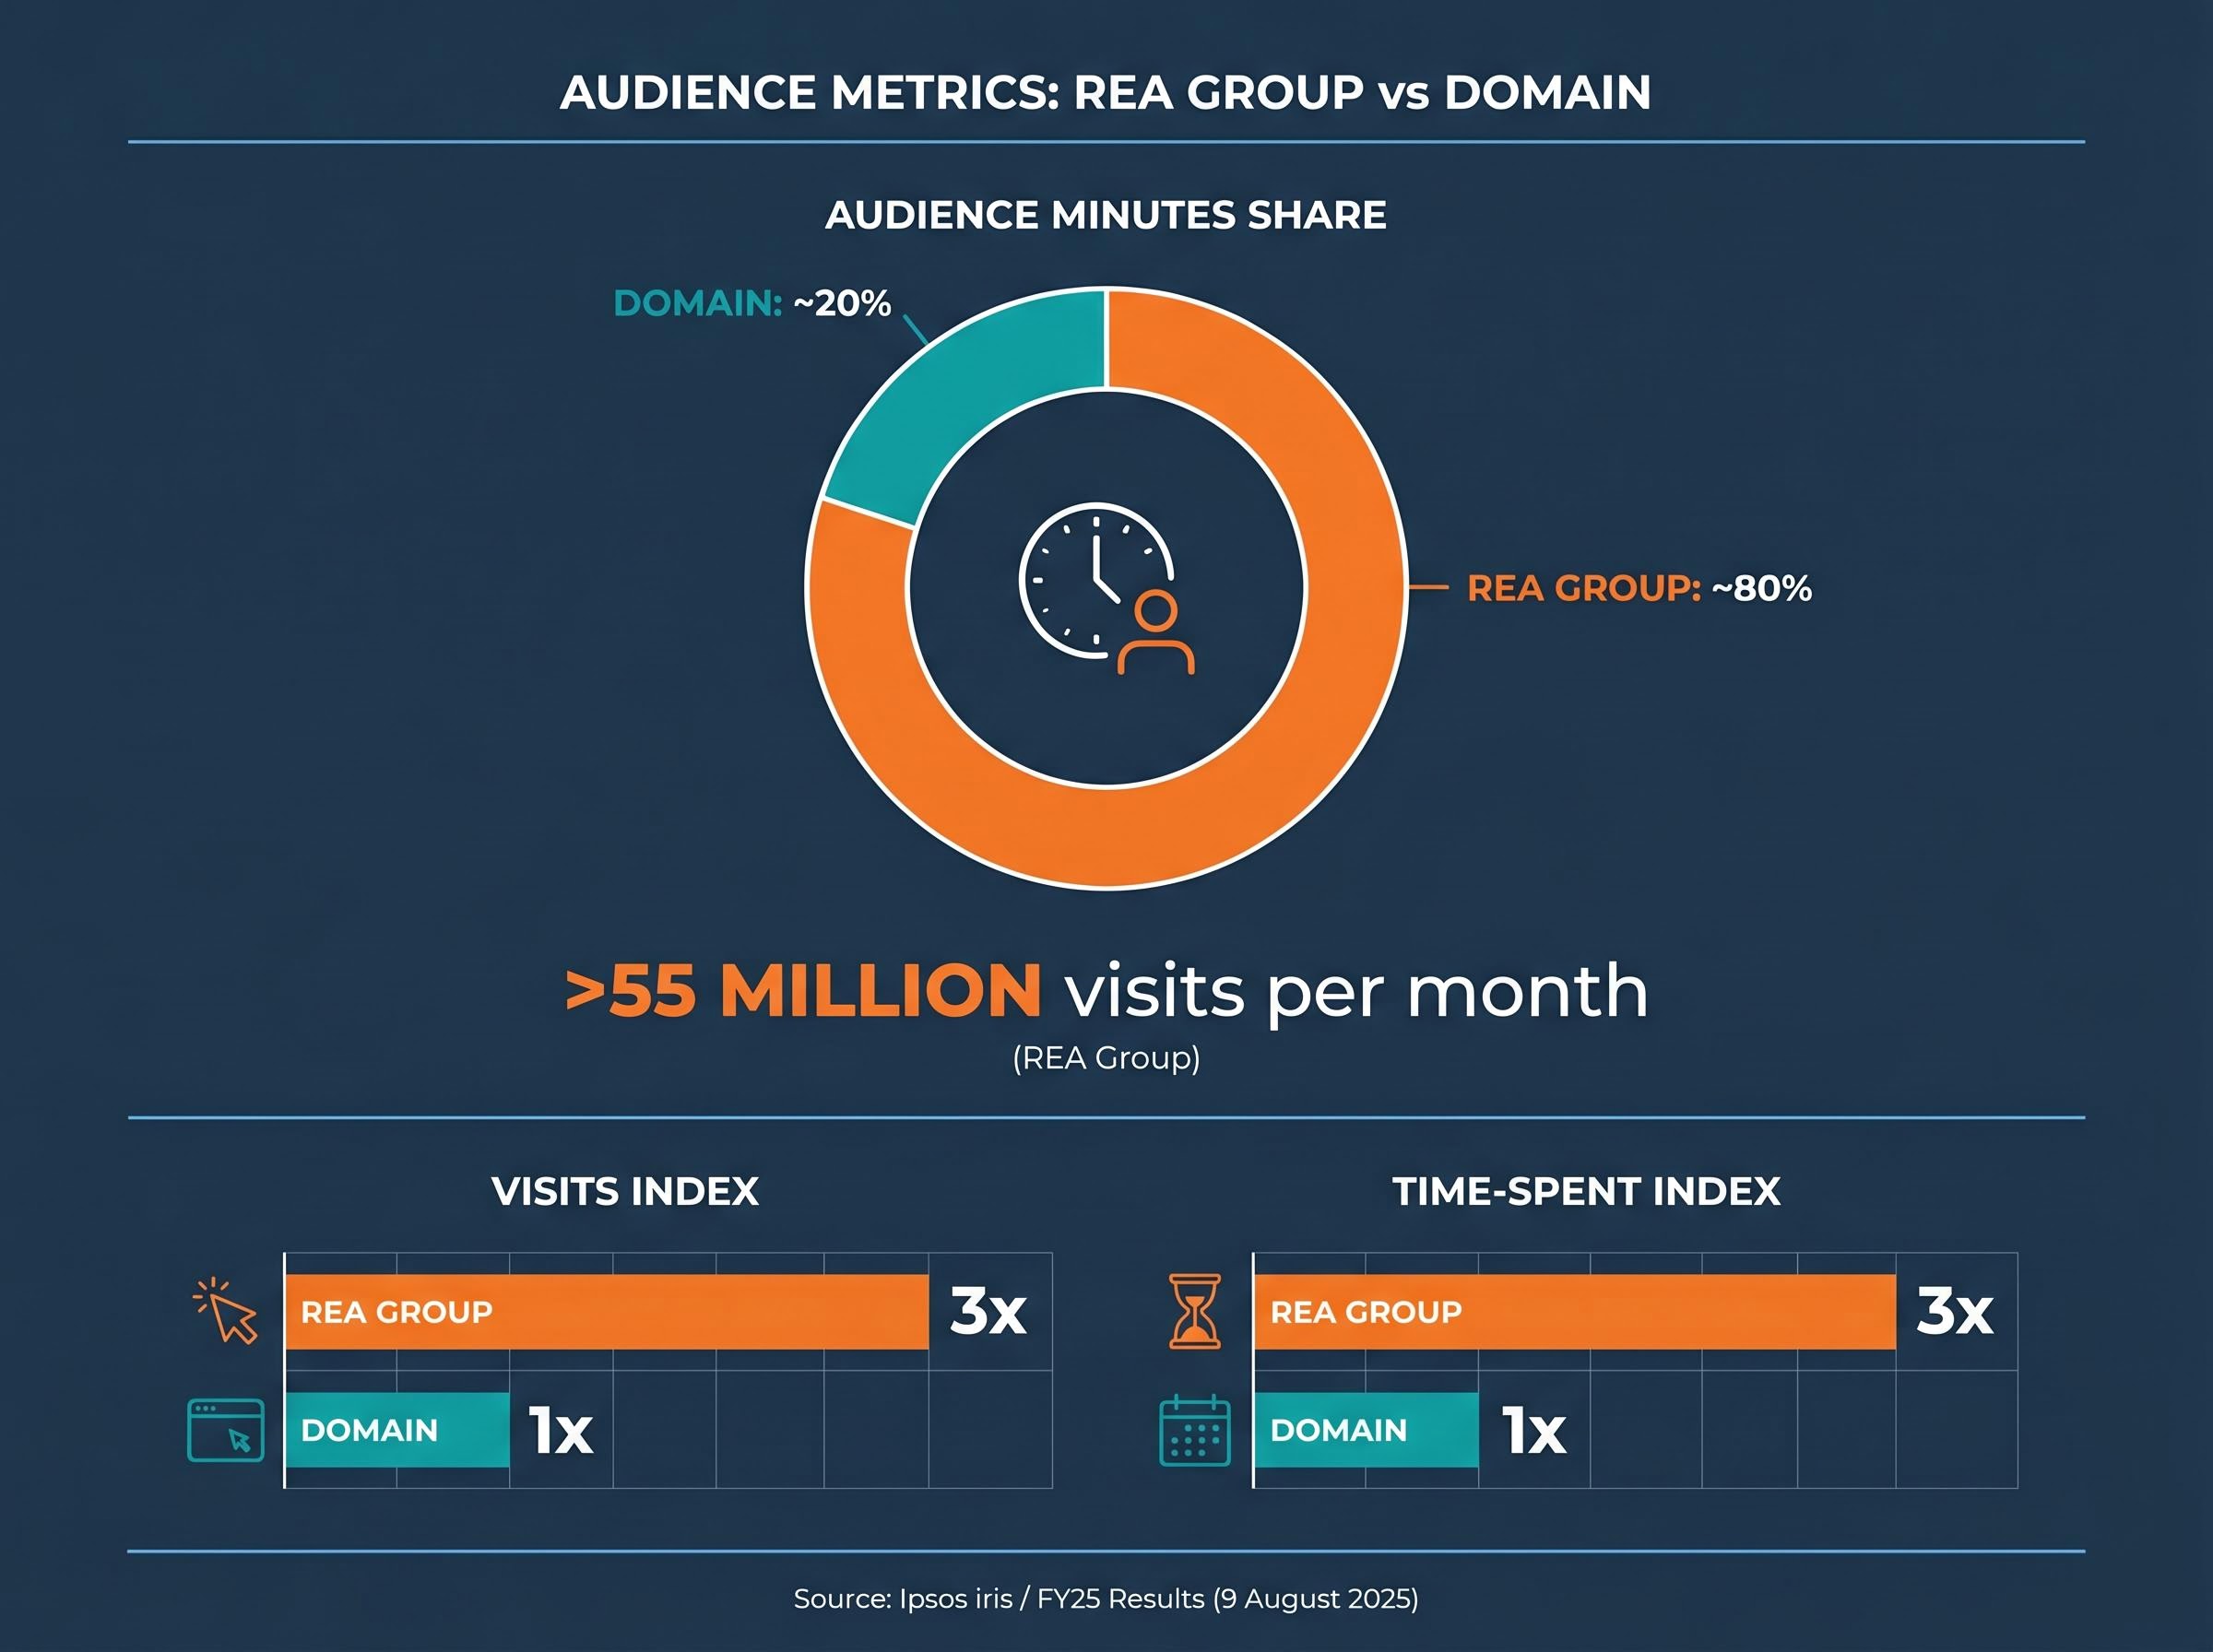
The audience data does the talking here. According to third-party measurement cited in REA Group’s FY25 Results Presentation (9 August 2025), realestate.com.au holds approximately 80% of Australian real estate audience minutes. Domain holds approximately 20%.
According to Ipsos iris measurement (per REA’s FY25 Results Presentation), realestate.com.au attracts approximately 3x more visits and 3x more time spent than its nearest competitor.
The network effect logic follows directly. More buyers and renters on realestate.com.au compels agents to list there first and at higher tiers. More agent listings attract more buyers. The cycle reinforces itself, and the gap has been broadly stable or widening through 2025-2026 rather than narrowing.
| Metric | REA Group | Domain |
|---|---|---|
| Monthly audience share (audience minutes) | ~80% | ~20% |
| Visits index (relative) | ~3x | 1x |
| Time-spent index (relative) | ~3x | 1x |
| National listing coverage | Largest national share | Strong in select metro markets |
Domain is not without genuine strengths. At its FY25 Results on 22 August 2025, management acknowledged the overall audience gap while highlighting competitive positioning in inner-city capital markets, particularly Sydney. Domain has also been competing aggressively on bundled pricing offers. These are real competitive dynamics, but they have not closed the structural gap in total traffic, engagement, or national agent coverage.
What the property market cycle means for REA’s revenue in 2026
The listings outlook is the single most important external variable for REA’s near-term earnings, and the major forecasters are broadly aligned. The consensus points to a supportive but not booming environment:
- CoreLogic: Expects 2026 national sales volumes “broadly similar to 2025,” with slightly stronger turnover in smaller capitals and regional markets. Listing counts expected to trend higher through spring 2026 compared with 2024-2025, assuming no renewed rate-hike cycle.
- PropTrack: Early-2026 listing volumes tracking ahead of the same period in 2024, with improved selling conditions expected if rate cuts materialise later in the year.
- Domain: CEO commentary (22 August 2025) pointed to a “gradual recovery” in listing activity through FY26, with stronger momentum expected from the spring 2025 selling season carrying into calendar 2026.
- Australian financial press consensus: National listings in 2025 expected to be 5-10% higher than 2024, with 2026 volumes similar or slightly higher if the RBA delivers modest rate cuts. Stronger relative performance expected in Brisbane, Perth, and Adelaide.
This is not a return to 2021 boom conditions. Population growth and improving credit conditions are doing the lifting, not a speculative surge. The forecast environment is supportive for a listing platform, but it is not the kind of tailwind that justifies aggressive revenue assumptions.
Property investment tax reforms from the 2026-27 Federal Budget introduce a negative gearing ring-fence on established residential properties acquired after 12 May 2026, and a replacement of the 50% CGT discount from 1 July 2027, changes that major bank economists identify as the primary behavioural driver redirecting investor capital toward new residential supply and potentially altering the composition of property transaction volumes that feed REA’s listing revenue.
The RBA rate path and what it means for listing volumes
The rate-cut scenario underpins the base case for the listings recovery. Current market expectations point to gradual RBA easing through 2026, though the precise timing and magnitude should be verified from RBA.gov.au or major bank economist commentary, as this remains a live variable.
If rate cuts are delayed or reversed, the listing recovery thesis softens directly. Mortgage affordability and consumer confidence both respond to the cash rate, and REA’s volume-sensitive revenue model would feel any shortfall in transaction activity quickly.
The RBA’s May 2026 rate decision complicates the base case directly: the cash rate reached 4.35% on 5 May 2026 in the third consecutive tightening move, with the Board preserving full policy optionality and Q2 CPI data identified as the next key trigger, meaning the gradual easing scenario that underpins REA’s listing volume recovery has not yet begun to materialise.
Price-to-sales as a valuation lens for growth platforms
For high-growth platform businesses with reinvestment cycles that compress near-term earnings, price-to-sales (P/S) provides a more stable valuation anchor than price-to-earnings. Revenue is less distorted by accounting treatment, depreciation schedules, and one-off costs, making it a cleaner signal for comparing a business against its own history.
Price-to-sales measures how much investors pay for each dollar of a company’s revenue. A higher ratio suggests the market expects strong future growth or margin expansion; a lower ratio may signal reduced expectations or a re-rating of the growth profile.
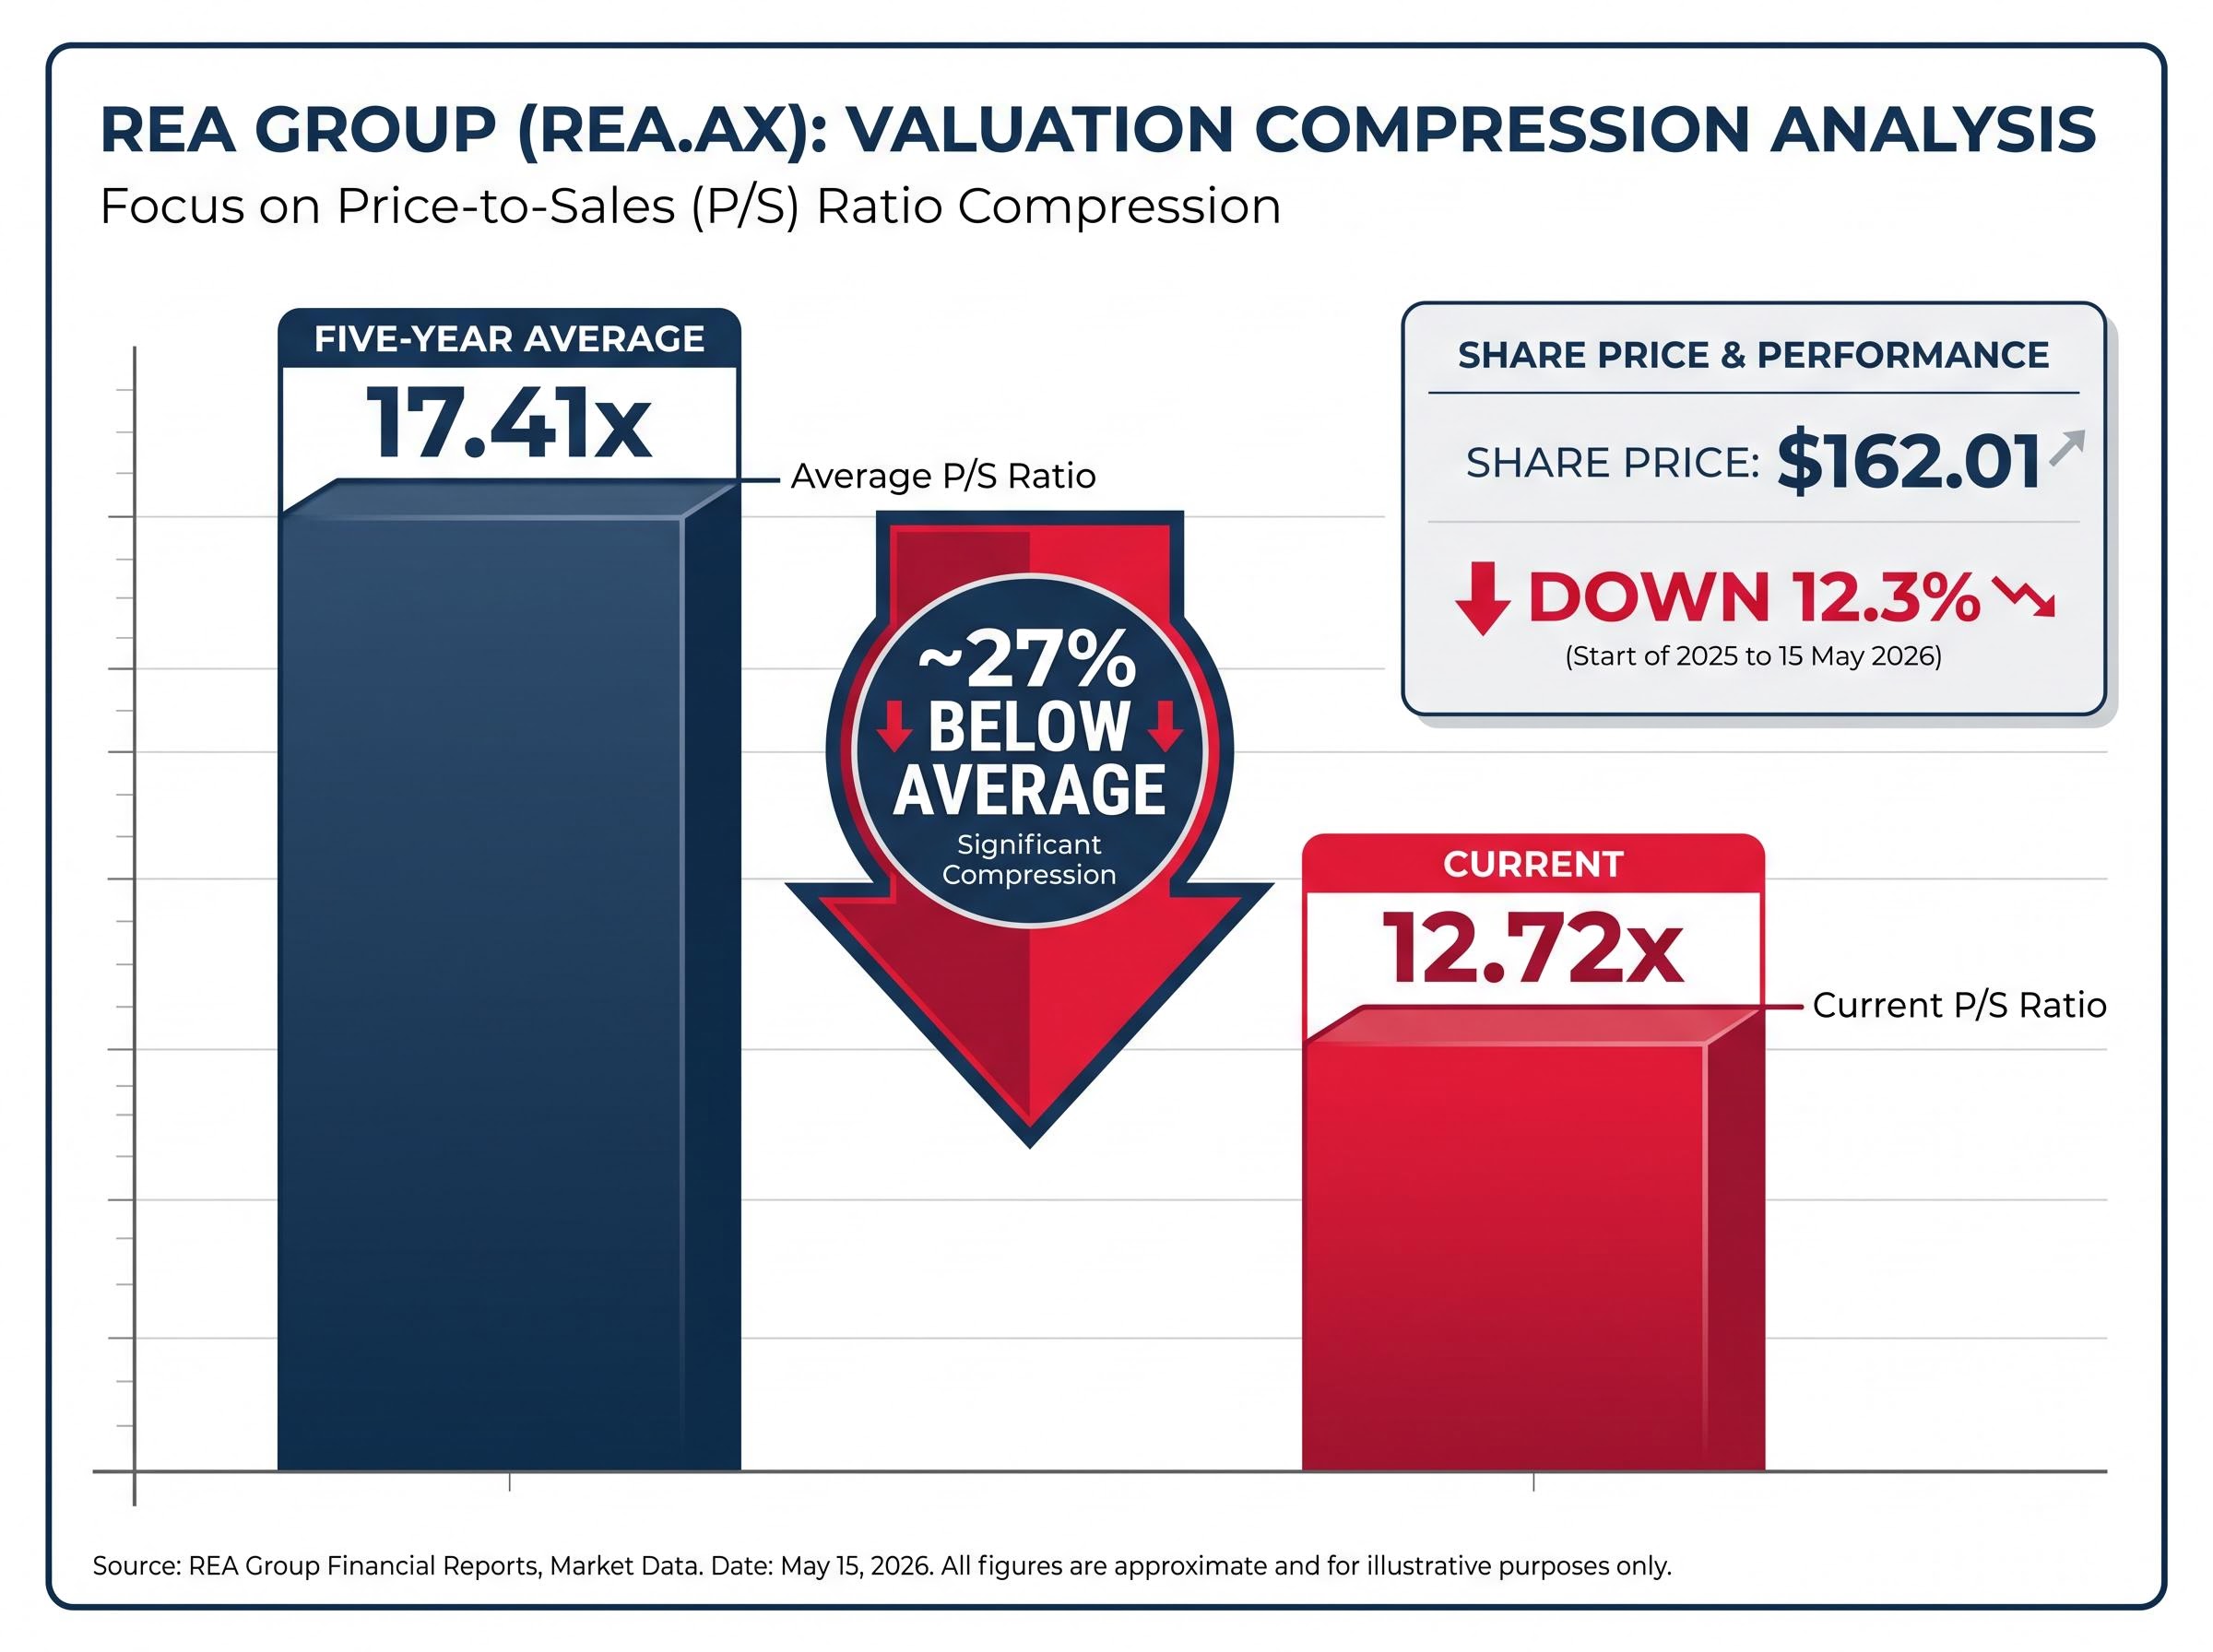
REA’s current price-to-sales ratio of 12.72x sits meaningfully below its five-year historical average of 17.41x, a gap driven by both the share price pullback and a rising revenue base.
| Metric | Current | Five-Year Average | Gap |
|---|---|---|---|
| Price-to-sales ratio | 12.72x | 17.41x | ~27% below average |
| Share price (start of 2025 to 15 May 2026) | $162.01 | n/a | Down 12.3% |
| Q3 FY26 revenue growth (ex-M&A) | 11% | n/a | n/a |
Two forces have driven the compression. The share price has fallen 12.3% since the start of 2025 (to $162.01 as at 15 May 2026), pushing the numerator down. Simultaneously, the revenue base has risen over the prior three years, confirmed by the Q3 FY26 result showing revenue up 11% excluding mergers and acquisitions. The ratio reflects both movements.
No single metric should drive an investment decision. P/S must be read alongside earnings trajectory, competitive position, and macro sensitivity. But as a starting point for a business of REA’s profile, it provides a useful frame for understanding where the market is pricing the stock relative to its own history.
Investors wanting to stress-test the P/S compression against forward PE, PEG ratios, and DCF scenario modelling will find our dedicated guide to REA Group’s valuation framework, which works through analyst price targets spanning AU$206 to AU$417 and examines whether the five-year P/S average is a reliable benchmark given COVID-era conditions inflated historical multiples.
Key risks that justify caution alongside the discount
The valuation gap exists for a reason. Before treating the compressed P/S as a buying signal, investors should weigh the risks the market may be pricing in.
- RBA rate path and listing volume sensitivity: REA’s revenue is operationally leveraged to listing volumes, which respond directly to mortgage affordability and consumer confidence. A delayed or reversed rate-cut cycle would weaken the volume recovery that underpins the earnings outlook.
- Domain competitive pressure: Domain is competing aggressively on pricing and bundled marketing offers, particularly in Sydney and Melbourne metro markets, according to reports in The Australian (27 February 2026). The overall gap remains wide, but sustained price competition could pressure REA’s depth product margins in those markets.
- India execution and currency risk: REA’s stake in Elara Technologies (Housing.com, Makaan.com, PropTiger.com) introduces emerging-market execution risk and currency volatility. Continued investment was noted in the FY25 results, and while revenue growth in India has been strong, associate income remains exposed to variables outside management’s direct control.
- ACCC regulatory monitoring: The ACCC continues to monitor REA’s market position. No enforcement action has been taken in the 2025-2026 period, but the background regulatory risk remains for a business with 80% audience share.
Valuation premium as a structural risk in itself
At approximately $162 per share, REA still trades at a significant premium to the broader ASX. Any negative earnings surprise or listings disappointment could trigger a sharper multiple de-rating than investors in lower-multiple stocks would experience. This is not a reason to avoid the stock, but it is a reason to be precise about entry point and position sizing.
ASX sectoral rotation from tax reform adds a further dimension for investors evaluating REA Group’s position: the removal of the 50% CGT discount from 1 July 2027 raises the relative after-tax value of fully franked dividend income, driving expected reallocation toward banks, utilities, infrastructure, and A-REITs, a dynamic that could sustain valuation pressure on growth-oriented, low-yield platforms even as underlying business performance holds steady.
Dominant platform, compressed multiple: what the data actually says
Four analytical threads run through this assessment. Together they frame a trade-off rather than a verdict:
- Moat: REA holds approximately 80% of Australian real estate audience minutes. The network effect is intact and the competitive gap has not narrowed through 2025-2026.
- Financials: Q3 FY26 revenue of $398 million (up 11% excluding mergers and acquisitions) and EBITDA of $220 million (up 16% excluding mergers and acquisitions) confirm the business is still growing at double-digit rates.
- Macro environment: The listings outlook for 2026 is supportive but not booming, with forecasters broadly expecting modest volume growth contingent on gradual RBA easing.
- Valuation: The current P/S of 12.72x sits roughly 27% below the five-year average of 17.41x, a gap wide enough to warrant attention.
The question for investors is whether that compression represents a mean-reversion opportunity, where the moat is intact, revenue is growing, and macro conditions are supportive, or a structural re-rating, where the market is correctly pricing lower long-run growth expectations into the multiple.
The P/S framework is one input, not a buy signal in isolation. Each investor’s view on the listings recovery and the RBA rate path will determine whether the current gap looks like it closes or persists. Analyst sentiment in the financial press has been broadly positive through this period, though specific broker price targets require direct verification before reliance.
The valuation gap is real. Whether it closes depends on what you believe about listings.
REA Group is a structurally dominant platform trading at a price-to-sales ratio meaningfully below its own five-year history, while its most recent quarterly result shows the business growing revenue and EBITDA at double-digit rates. That combination, dominant market position with a compressed valuation, is what draws attention to the stock.
The discount is not without justification. Rate sensitivity, competitive pressure from Domain, emerging-market exposure through India, and regulatory monitoring are genuine risks, not trivial ones. A business trading at a premium to the broader market carries amplified downside if earnings disappoint.
Investors who are constructive on the RBA easing path and the 2026 listings recovery have a more compelling case for the current multiple to mean-revert toward its historical average. Those who are sceptical of the transaction volume outlook, or who see the macro risks as underpriced, may prefer to wait for greater clarity before acting.
This article is for informational purposes only and should not be considered financial advice. Investors should conduct their own research and consult with financial professionals before making investment decisions. Past performance does not guarantee future results. Financial projections are subject to market conditions and various risk factors.