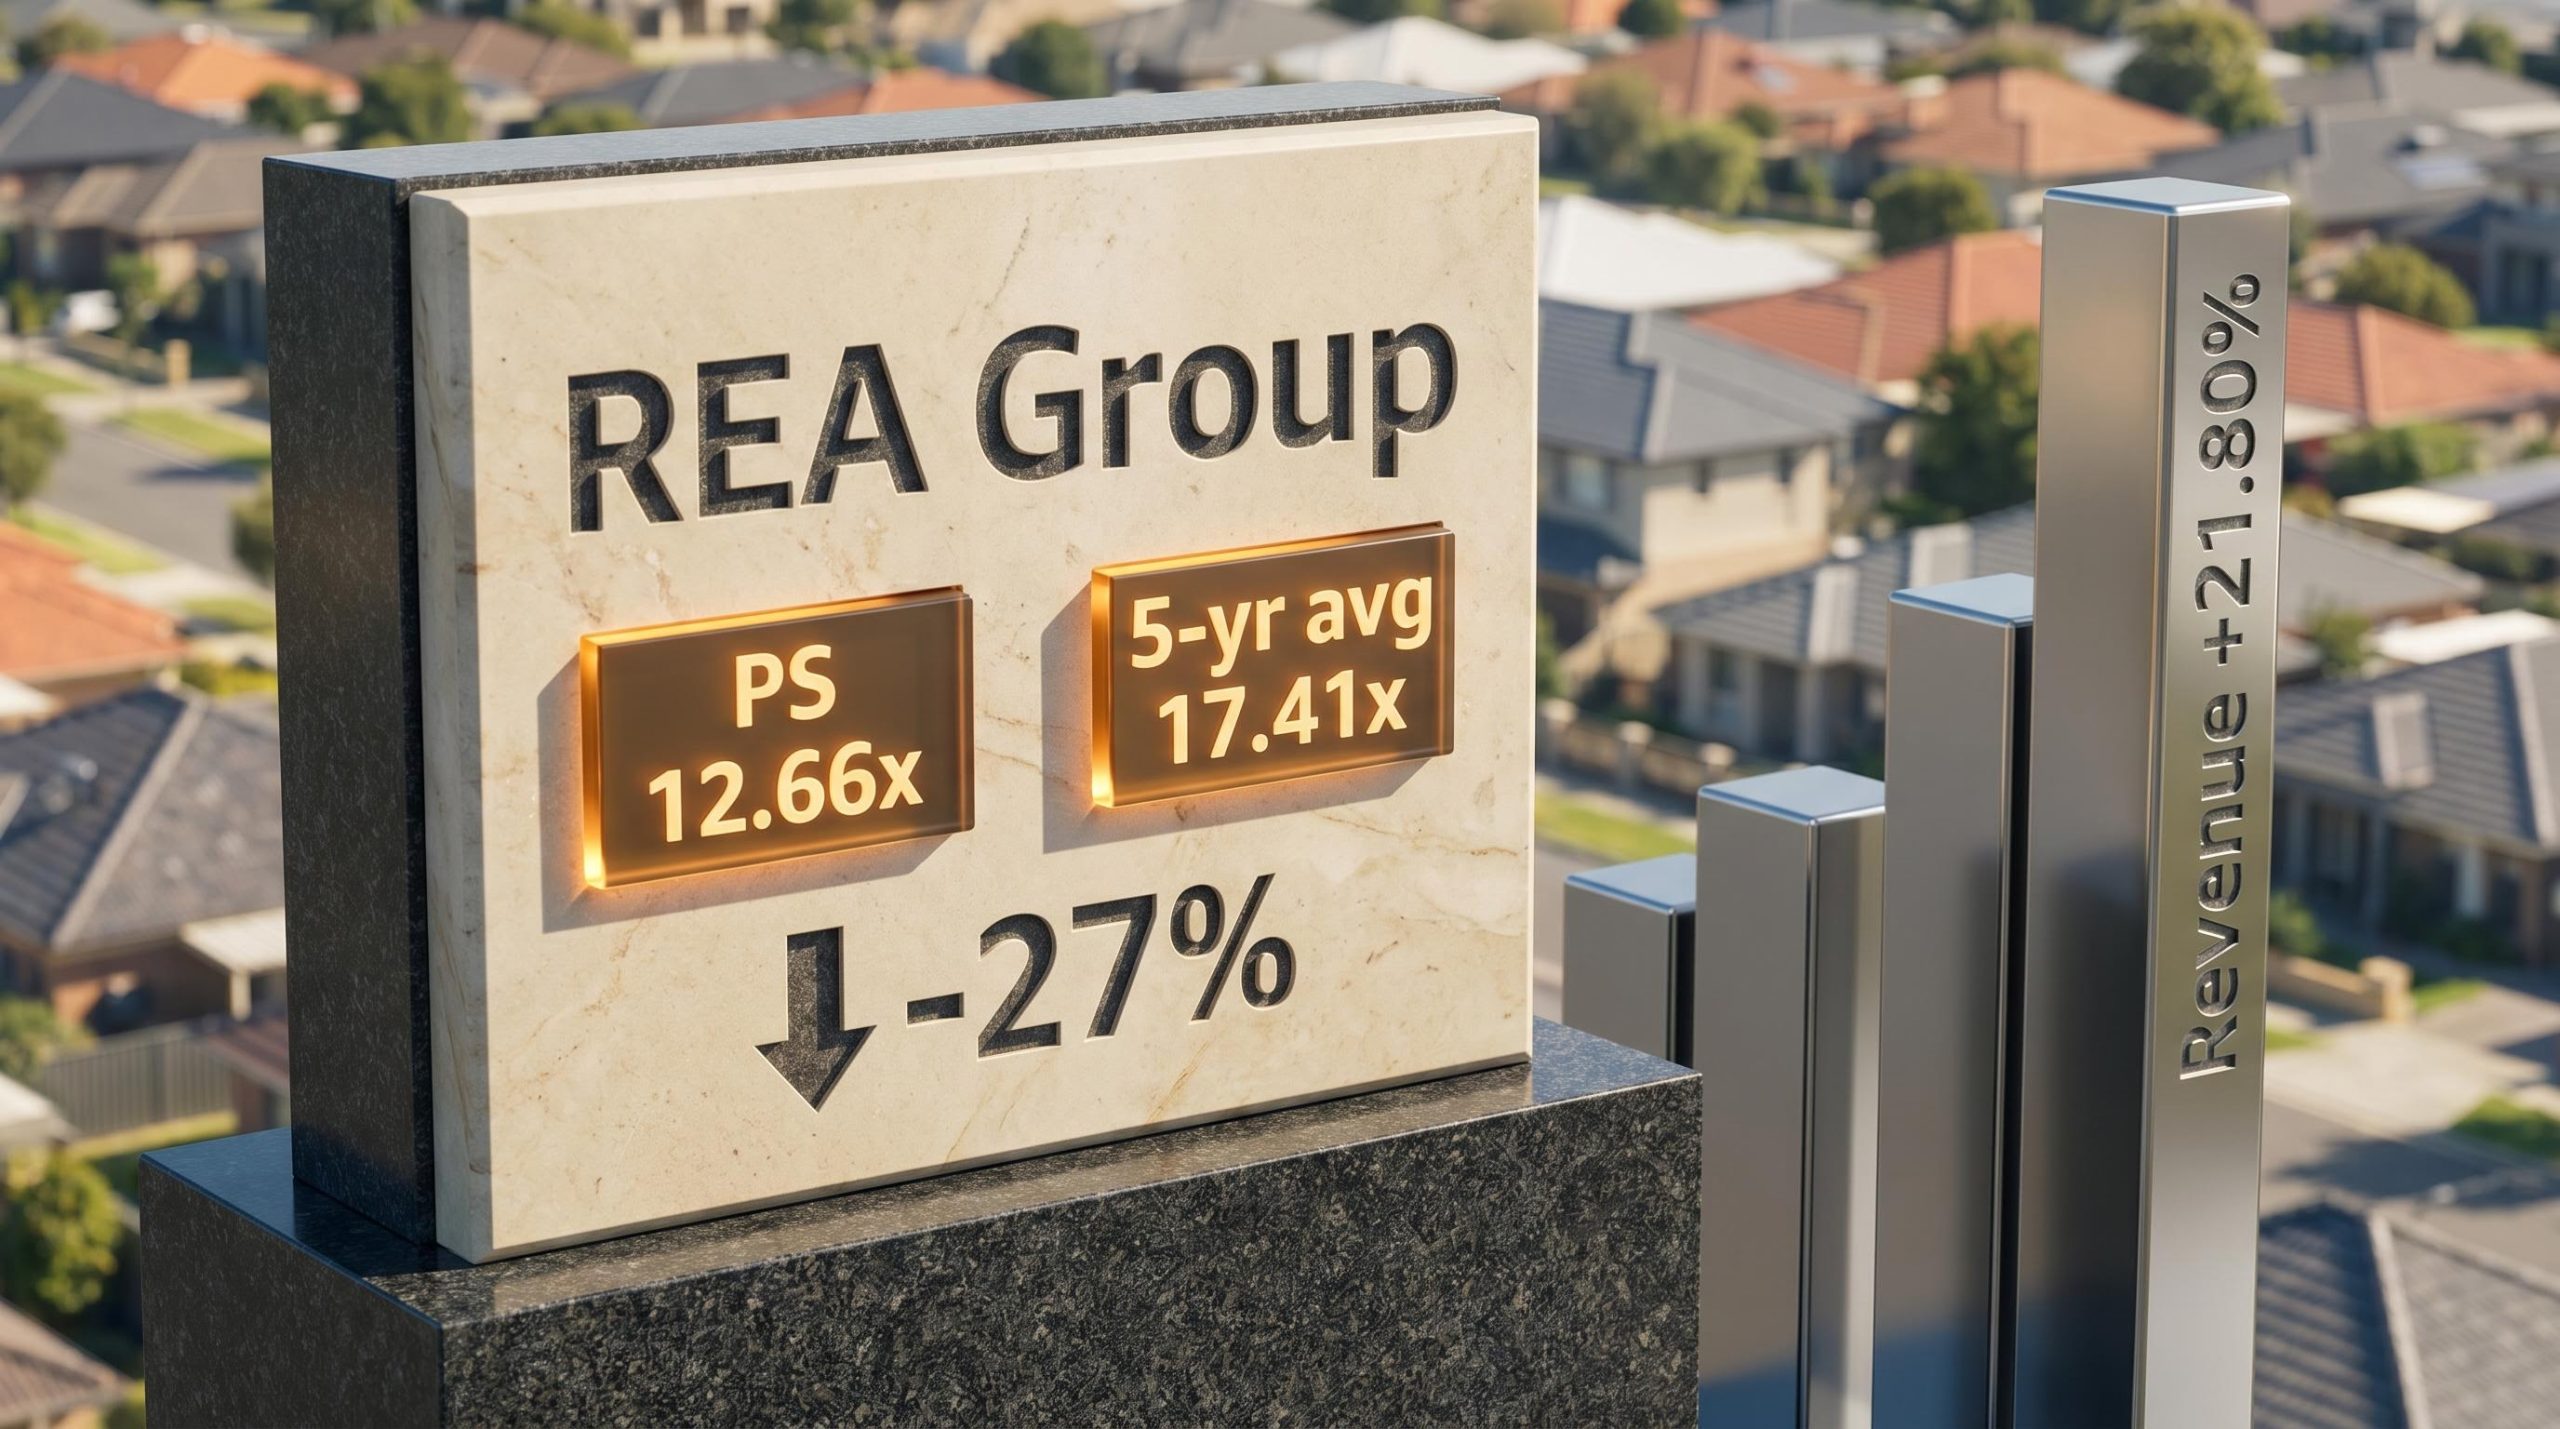
REA Group’s price-to-sales ratio has compressed by roughly 27% from its five-year average, dropping from 17.41x to approximately 12.66x. For investors watching the REA Group share price in 2026, that gap raises a pointed question: is the market offering a discount on one of the ASX’s highest-quality digital businesses, or has the multiple simply corrected to where it belongs?
The answer is less straightforward than either camp suggests. With the RBA past peak rates, Australian property listing volumes showing early signs of recovery, and the share price sitting approximately 9.3% above its 52-week low, the timing tension is real. What follows is an analytical unpacking of what that PS compression actually signals, why price-to-sales is the right lens for a business like REA, and how investors can use this data point as one input in a grounded valuation framework, rather than treating a gap to a historical average as an automatic buy signal.
Why REA Group’s revenue tells a different story than its earnings
At approximately 37-41x trailing earnings, REA Group looks expensive in isolation. A forward PE of roughly 33-35x softens the picture marginally. But neither figure captures the full quality of what sits underneath.
REA operates with an operating margin of 41.98%, a profit margin of 35.74%, and a return on equity of 37.93%. These are not the margins of a business struggling to convert growth into profit. They are the margins of a business choosing to reinvest. And that reinvestment, into new data products, AI tools, vendor lead generation, and rental platform enhancements, compresses reported earnings in ways that make PE ratios unreliable as standalone valuation tools.
Price-to-sales cuts through that noise. Three reasons it serves as a more revealing lens for growth-stage digital platforms:
- Reinvestment distortion: PE ratios penalise companies investing heavily in future revenue capacity; PS isolates the top line from discretionary spending choices
- Margin expansion optionality: A business with 42% operating margins has significant room to harvest profits when it chooses to stop reinvesting at current levels
- Revenue predictability: TTM revenue of AUD 1.90 billion, growing at 21.80% year-on-year, provides a more stable base for comparison than earnings that shift with investment cycle timing
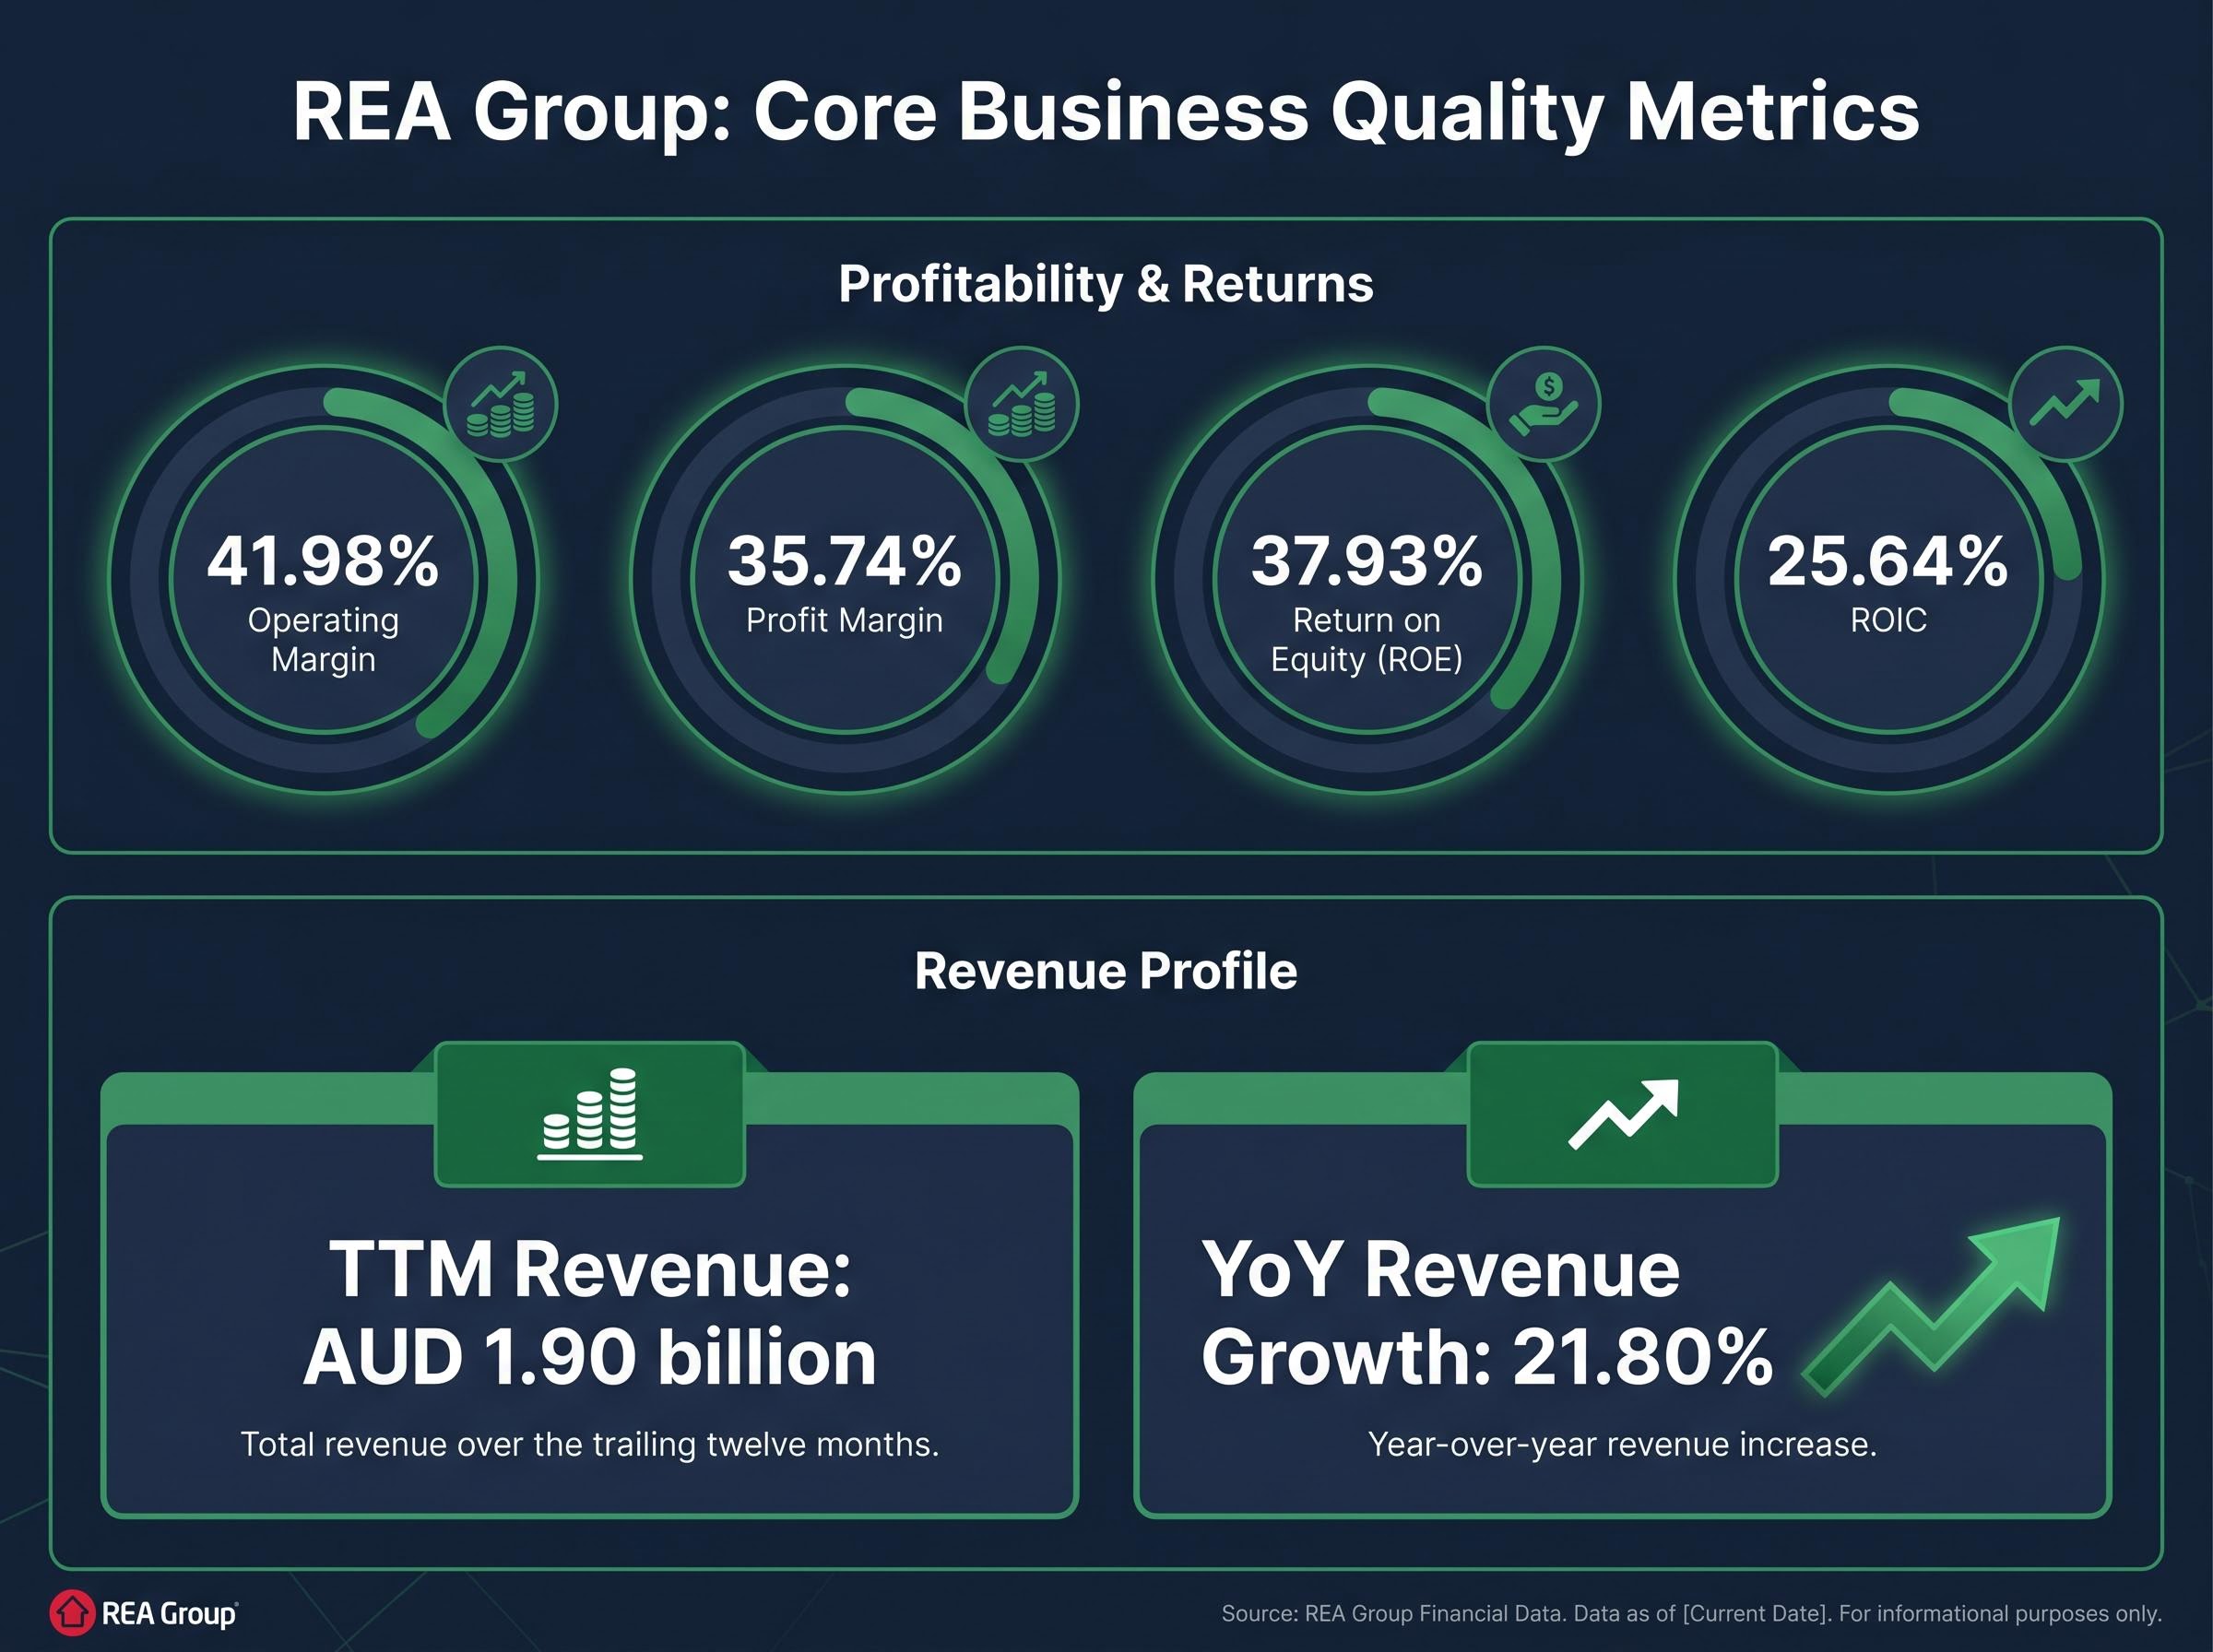
Operating margin: 41.98%. At this level, the gap between reported earnings and underlying business quality is a reinvestment choice, not a profitability problem.
When big ASX news breaks, our subscribers know first
What REA Group actually does and how it makes money
Core Australian portal business
REA Group operates realestate.com.au, Australia’s dominant property portal by traffic, agent adoption, and pricing power. Founded in 1995 and headquartered in Melbourne, the company is majority-owned by News Corp and draws approximately 55 million monthly visits to its Australian platform.
The revenue engine is straightforward: listing fees charged to property vendors through relationships with approximately 20,000 property agents nationwide. The higher-margin growth driver is depth advertising, where vendors pay for premium listing upgrades that increase visibility. Near-universal agent adoption gives REA significant pricing power but also represents an exhausted penetration ceiling. Incremental growth must come from listing volume cycles, price increases, and depth mix improvements rather than new agent sign-ups.
Adjacent revenue and international footprint
Beyond the core portal, REA operates across three revenue streams:
- Portal listings: The dominant contributor, driven by residential depth advertising and vendor campaign spend
- Mortgage broking and financial services: Lower-margin adjacencies that are growing but remain comparatively small
- International operations: Interests across 10 countries including India and Asia-Pacific markets, carrying higher execution and currency risk
The market treats these offshore assets as option value rather than a compounding growth driver. TTM revenue per share growth of 21.80% is overwhelmingly an Australian story, and that distinction matters when assessing what the PS ratio is actually pricing.
The 27% gap: what price-to-sales compression actually measures
The arithmetic is specific. At a share price of approximately AU$239.99 and TTM revenue per share of AU$13.89, REA trades at a PS of roughly 12.66x. The five-year average sits at 17.41x. That is a gap of approximately 27%.
| Metric | Current Value | Historical Reference | Gap |
|---|---|---|---|
| PS ratio (5-year avg) | 12.66x | 17.41x | -27% |
| PS ratio (10-year median) | 11.05x | 14.78x | Context only |
| TTM revenue growth | 21.80% | n/a | n/a |
How does PS compression occur? Either the share price falls, revenue per share rises, or both move simultaneously. In REA’s case, TTM revenue growth of 21.80% means the compression is primarily share-price-driven rather than a deterioration in the underlying business.
That distinction shapes the interpretive question. A 27% gap to the five-year average could represent undervaluation. Or the five-year average itself could be a misleading benchmark.
The five-year average of 17.41x is not a neutral reference point. It includes the 2020-2021 period when near-zero interest rates and surging property transaction activity pushed REA’s multiples to structurally elevated levels. Using that average as a “normal” benchmark without adjusting for those conditions risks treating an anomaly as a target.
A separate GuruFocus reference, using a different rolling window, places the 10-year median PS at 14.78x, with the current ratio sitting approximately 25% below that figure. Different windows tell slightly different stories, but both confirm the compression is real. The question is what it means.
Structural reset or cyclical discount? The case for each
The case for permanent re-rating
Three forces argue the lower multiple is here to stay. The RBA hiking cycle of 2022-2024 raised structural discount rates for long-duration growth stocks. For a business like REA, where value is concentrated in cash flows years into the future, higher risk-free rates mechanically compress the sustainable multiple even if business quality remains unchanged.
The RBA May 2026 monetary policy outlook confirms the Board’s assessment that inflation will likely remain above target through the near term, a condition that continues to weigh on the structural discount rates applied to long-duration growth stocks like REA even as the hiking cycle itself has passed its peak.
The five-year PS average is also inflated by COVID-era conditions. Near-zero rates combined with a surge in digital property advertising pushed multiples to 17-20x and beyond. Most analysts argue rates will not return to those levels, making peak-era multiples structurally unreachable.
Finally, the core Australian portal has matured. With agent penetration effectively exhausted, the growth premium investors will assign narrows to cyclical listing volumes and yield-driven price increases.
The case for cyclical recovery
Listing volumes were suppressed during the rate-hike phase and are showing early recovery signals. Historical patterns suggest activity tends to recover 6-12 months after rate expectations stabilise. With the RBA past peak rates, a gradual improvement into 2026-2027 could support revenue outperformance relative to current sell-side models.
RBA rate decisions now transmit through retail trading platforms with a speed that compresses the traditional lag between policy signals and share price adjustment; for a long-duration compounder like REA, where the multiple is mechanically sensitive to the discount rate, this means the market’s re-rating of the stock can move faster than the underlying listing volume recovery that would justify it.
Depth penetration and price increases have continued to drive 21.80% revenue growth even through a soft macro environment, suggesting the core business is executing well. Quality compounders with a beta of 0.85 have historically seen multiple expansion once macro uncertainty clears.
| Structural Reset Factors | Cyclical Discount Factors |
|---|---|
| Higher structural discount rates post-RBA hiking cycle | Listing volumes cyclically suppressed, showing early recovery |
| COVID-era multiples were anomalies, not benchmarks | Depth and yield runway intact; 21.8% revenue growth in soft macro |
| Core Australian portal maturation limits growth premium | Quality compounder re-rating precedent once uncertainty clears |
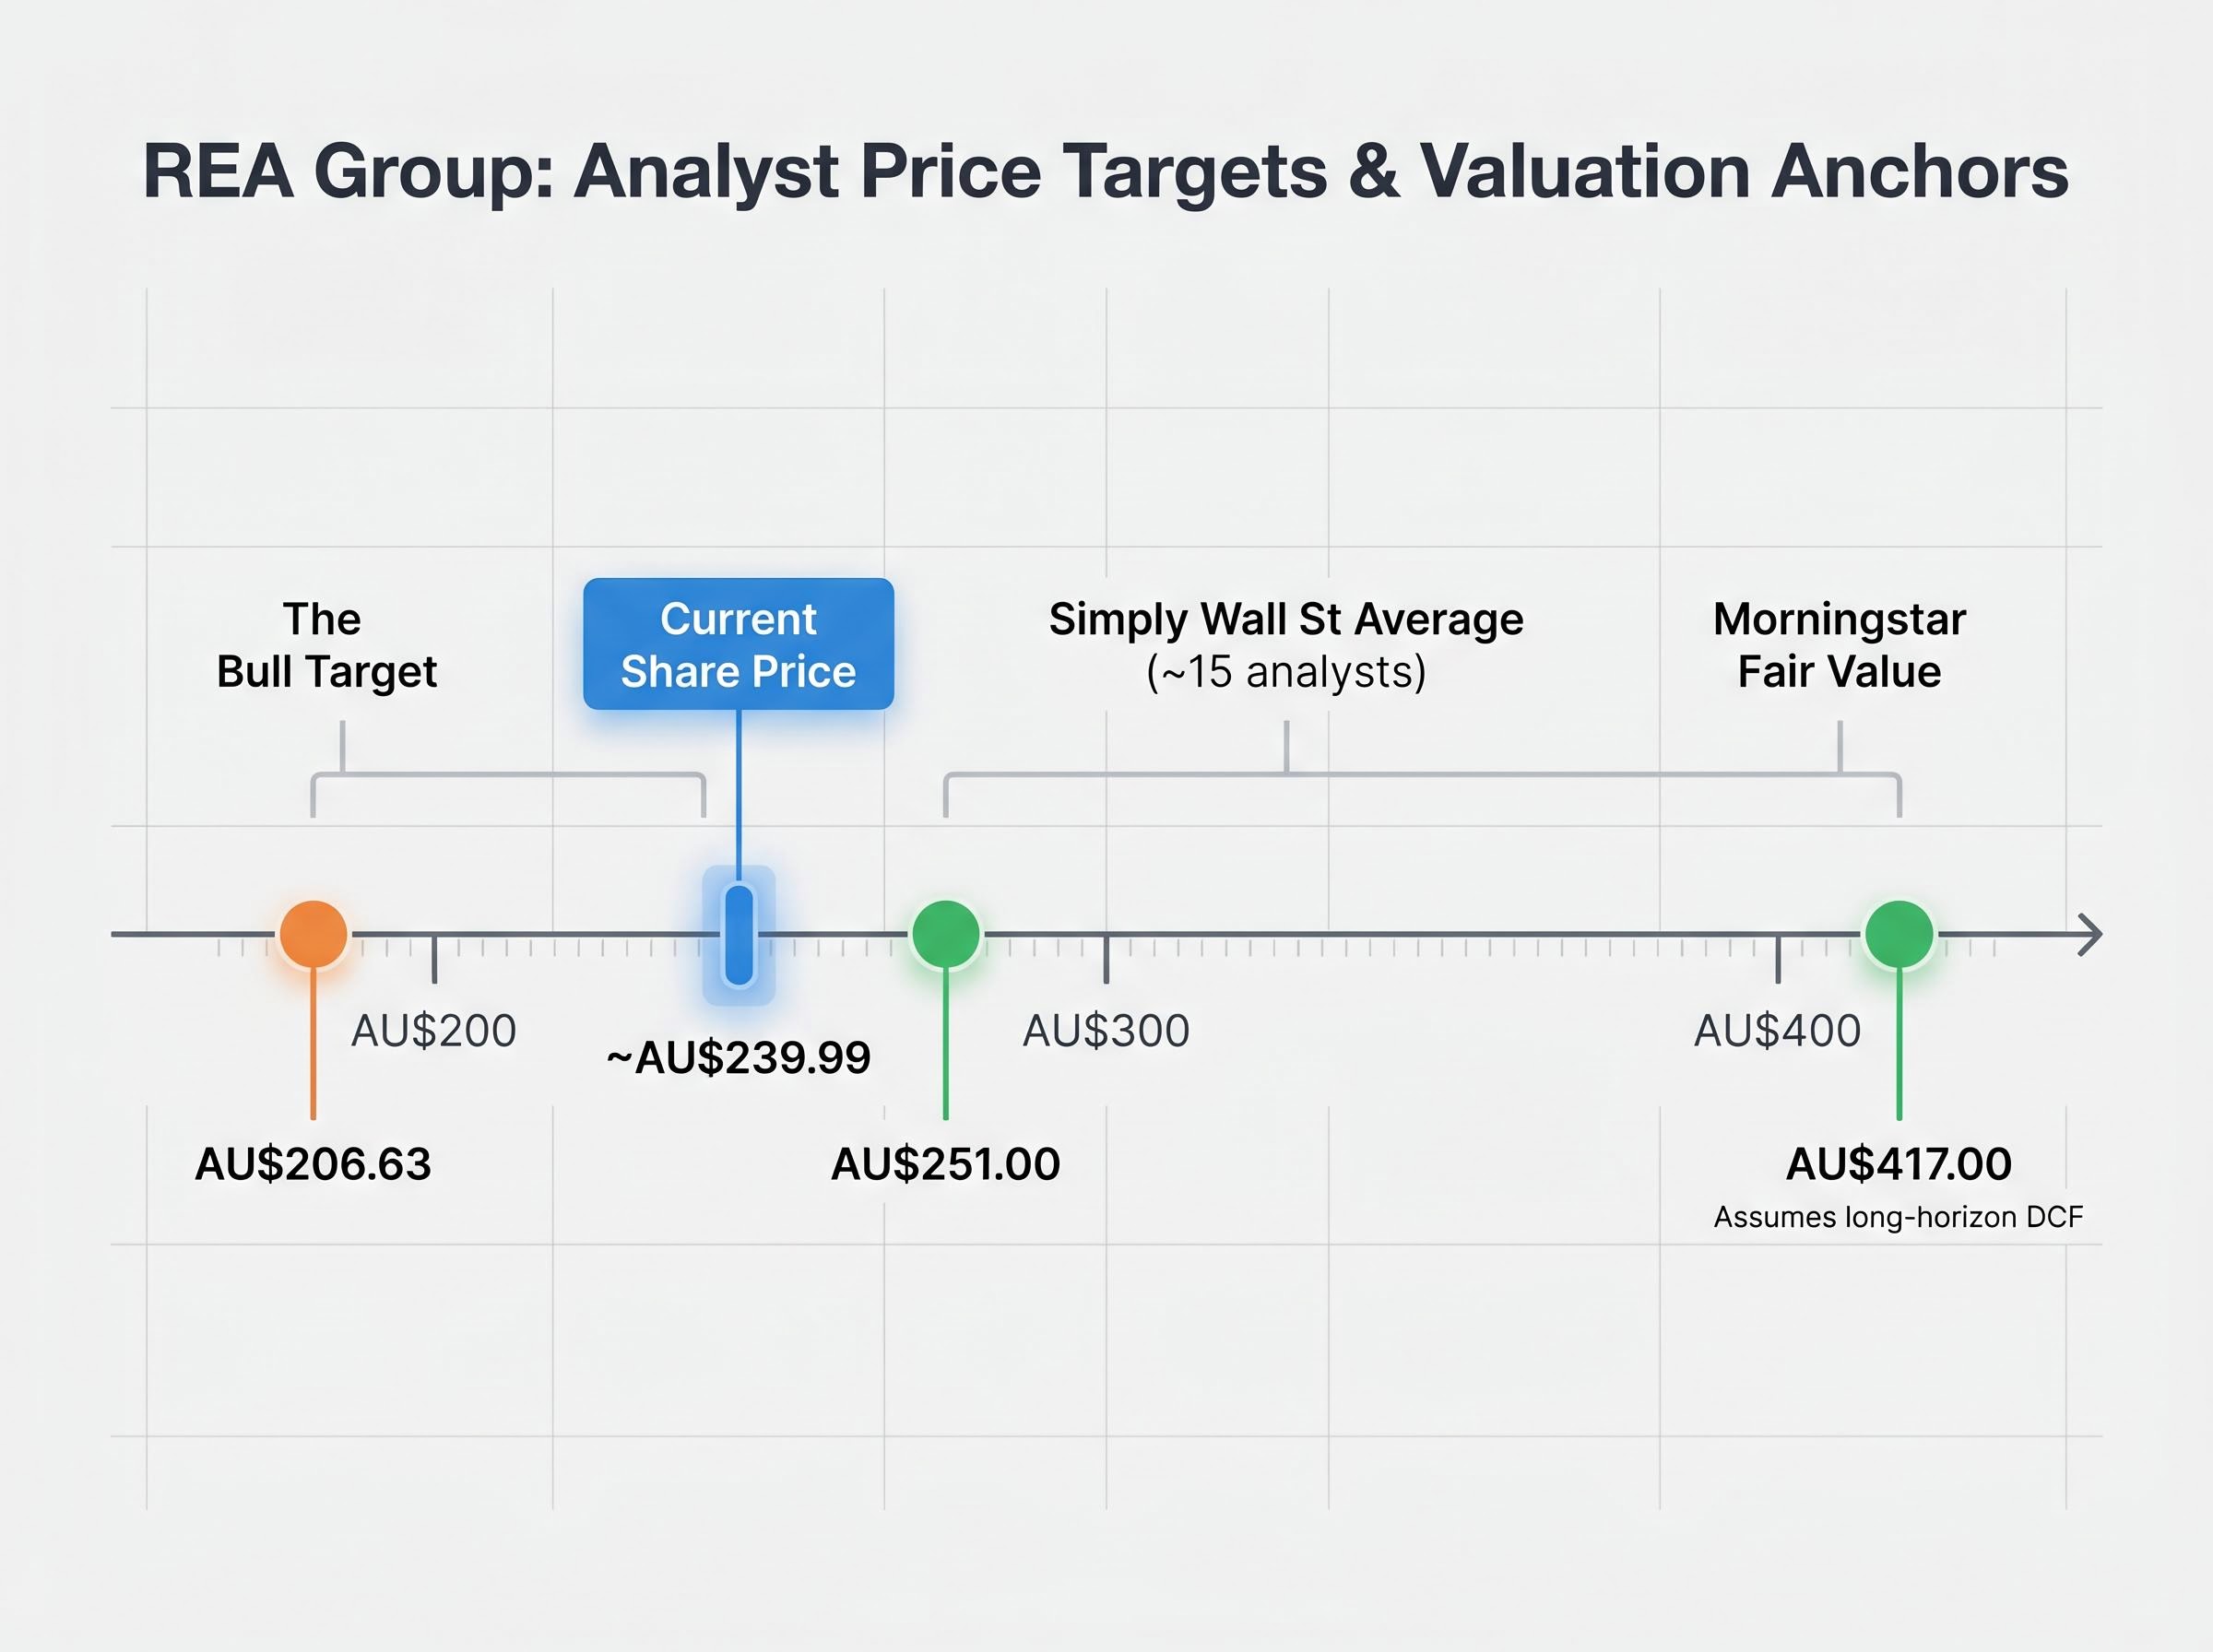
Most covering analysts frame this as partly structural, partly cyclical. The appropriate benchmark for REA’s PS is likely not 17.41x but something closer to 14-15x in a recovered environment. Analyst consensus targets reflect that view: Simply Wall St’s average of AU$251 (approximately 15 analysts) and The Bull’s target of AU$206.63 both sit well below where a full re-rating to historical averages would place the stock. Morningstar’s fair value of AU$417, based on a long-horizon DCF with a wide moat assumption and “High” uncertainty rating, anchors the upper bound of a bull scenario.
Using PS ratio as a starting point, not a signal
A 27% gap to a historical average creates an instinctive pull. The multiple is below average, the business quality is high, therefore it must be cheap. That instinct is worth interrogating.
PS ratios are useful for directional comparison but cannot account for changes in cost of capital, business mix, or competitive structure without additional context. REA’s PEG ratio illustrates the fragility of single-metric conclusions: StockAnalysis calculates a PEG of 3.46, while The Bull arrives at 0.668. The divergence is entirely a function of differing growth assumptions, and both are technically defensible.
The divergence between a PEG of 3.46 and a PEG of 0.668 for the same stock illustrates precisely why share valuation methods work best as a cross-referencing system rather than individual verdicts; each metric captures a different slice of business quality, and the gaps between them are often more informative than any single output.
A more complete framework requires layering multiple inputs:
- Assess PS against a normalised historical range, not COVID-era peaks. A 12-15x range for a business of REA’s quality appears more analytically grounded than benchmarking to 17x
- Cross-check with forward PE and PEG using a consistent growth assumption, acknowledging the sensitivity of PEG to that assumption
- Run or reference a DCF scenario for long-horizon base and bull cases; Morningstar’s AU$417 fair value provides one such anchor, albeit with a “High” uncertainty classification
- Weigh qualitative competitive and regulatory factors, including Domain Holdings as the number-two competitor providing agent negotiation leverage and emerging platform threats
At 12.66x PS with 42% operating margins and 38% ROE, REA is priced as a premium-quality compounder, not a distressed value play. The investment case rests on earnings compounding, not on multiple expansion back to historical peaks.
The returns case for REA at current levels is a compounding story: ROIC of 25.64%, strong margin stability, and a dominant market position that supports mid-teens revenue growth in most sell-side models. That is a quality-premium argument, not a value argument, and the distinction matters for how investors size the position and set return expectations.
What the numbers mean for investors watching REA in 2026
The clearest near-term catalyst is Australian listing volume recovery through 2026-2027. Data from CoreLogic and SQM Research through early 2026 indicates moderate year-on-year increases in new listings in Sydney, Melbourne, and Brisbane. If that trend strengthens, it supports both revenue outperformance and potential PS re-rating toward 14-15x.
Property investor demand is facing a structural reconfiguration under the 2026-27 Federal Budget’s negative gearing ring-fence and CGT discount replacement, changes that could reshape the composition of listings over the medium term as the mix of investor-owned versus owner-occupied properties on the market shifts.
Cotality Australian property market data for 2026 shows new listing volumes rising moderately across Sydney, Melbourne, and Brisbane, consistent with the early-recovery signal that sell-side models are embedding into mid-cycle revenue forecasts for portal operators.
| Scenario | Key Assumptions | PS Range | Price Anchor |
|---|---|---|---|
| Bull case | Listing recovery + quality re-rating; mid-teens revenue growth sustained | 14-15x | AU$417 (Morningstar, long-horizon) |
| Base case | Earnings compounding; PS flat; margins stable | 12-14x | AU$251 (consensus, ~15 analysts) |
| Bear case | Sustained listing weakness; high single-digit revenue growth | 10-11x | AU$206.63 (The Bull) |
The majority of covering brokers maintain Buy, Outperform, or Accumulate ratings. REA is not a value stock and should not be evaluated as one. The question is whether the quality of the business justifies a continued premium at current levels. Most covering analysts argue it does at prices below AU$230-260, where the earnings compounding case carries the return rather than relying on multiple expansion.
REA Group is a premium business at a more rational price, the question investors must still answer
The 27% gap to the five-year PS average is not a straightforward discount signal. It reflects a mix of rational re-rating from COVID-era anomalies and recoverable cyclical compression from listing volume softness. Neither explanation alone accounts for the full picture.
The investment case for REA at current levels rests primarily on sustained earnings compounding over five-plus years. With 42% operating margins, 38% ROE, and a dominant market position, the business quality is not in question. What remains genuinely uncertain is the trajectory of Australian listing volumes and the speed at which that cyclical recovery feeds through to revenue.
Investors conducting further research would benefit from reviewing REA’s most recent ASX-released results and investor presentations, running DCF scenarios using their own growth assumptions, and tracking listing volume data from CoreLogic and SQM Research as a leading indicator of the re-rating catalyst.
This article is for informational purposes only and should not be considered financial advice. Investors should conduct their own research and consult with financial professionals before making investment decisions. Past performance does not guarantee future results. Financial projections are subject to market conditions and various risk factors.