
Most retail investors reach for two tools when sizing up an ASX bank stock: the price-to-earnings ratio and a back-of-envelope dividend discount model. For ANZ trading near $35, those tools produce a tidy result that seems to confirm the stock is roughly fairly valued. The problem is that both models are only as reliable as the assumptions feeding them, and banking is the one sector where the hidden assumptions can be the most damaging.
Australian bank stocks sit at the intersection of several live macro forces: an RBA cash rate that has moved in both directions since early 2026, rising (though still low) arrears across the major lenders, a funding mix that leaves all four majors meaningfully exposed to offshore wholesale markets, and net interest margin pressure that is structural, not just cyclical. Against that backdrop, a PE ratio or DDM calculation tells an investor almost nothing about the specific risks sitting inside any one bank’s balance sheet.
This guide takes investors past the starting point and into the indicators that actually differentiate ANZ, NAB, and CBA when building a conviction position: loan book growth quality, bad debt provisioning philosophy, funding source composition, and net interest margin dynamics. By the end, readers will have a concrete checklist for valuing ASX bank stocks with genuine depth.
Why the standard valuation toolkit falls short for bank stocks
PE ratios and dividend discount models are legitimate entry points. They give investors a price anchor, and for most sectors, that anchor holds up well enough to guide a decision. Banking is different.
Banks are leveraged financial intermediaries, not operating businesses. A retailer earns revenue by selling goods at a margin. A bank earns revenue by borrowing cheaply and lending expensively, while managing a balance sheet leveraged at roughly 15-20 times its equity base. That leverage means small changes in credit quality, funding costs, or provisioning assumptions ripple through earnings in ways that a single PE snapshot cannot capture.
Three structural features make bank earnings harder to value than those of non-financial companies:
- Leverage amplifies everything. A 1% loss on a loan book can consume a disproportionate share of equity, turning a modest credit cycle deterioration into a material earnings event.
- Provisioning is discretionary. Management decides how much to set aside for expected loan losses, and those decisions directly shape reported earnings. Two banks with identical loan books can report very different profits depending on how conservatively they provision.
- Funding costs are market-dependent. A significant share of major bank funding comes from wholesale markets, including offshore sources. When global credit conditions tighten, funding costs rise regardless of domestic conditions.
The DDM is equally fragile. Change the dividend growth assumption by a few percentage points and the output swings wildly.
ANZ’s valuation discount is partly explained by a $1 billion APRA capital add-on and a $250 million ASIC penalty, neither of which appears in any earnings model revision, a pattern that illustrates why qualitative judgment on credit quality and regulatory risk is the input that determines whether a PE-derived price anchor is meaningful or misleading.
Based on ANZ’s FY24 earnings per share of $2.15 and a PE of approximately 16.4x versus the sector average of roughly 18x, a DDM produces a fair value range from as low as $18.78 to as high as $42.25, depending on growth and discount rate assumptions.
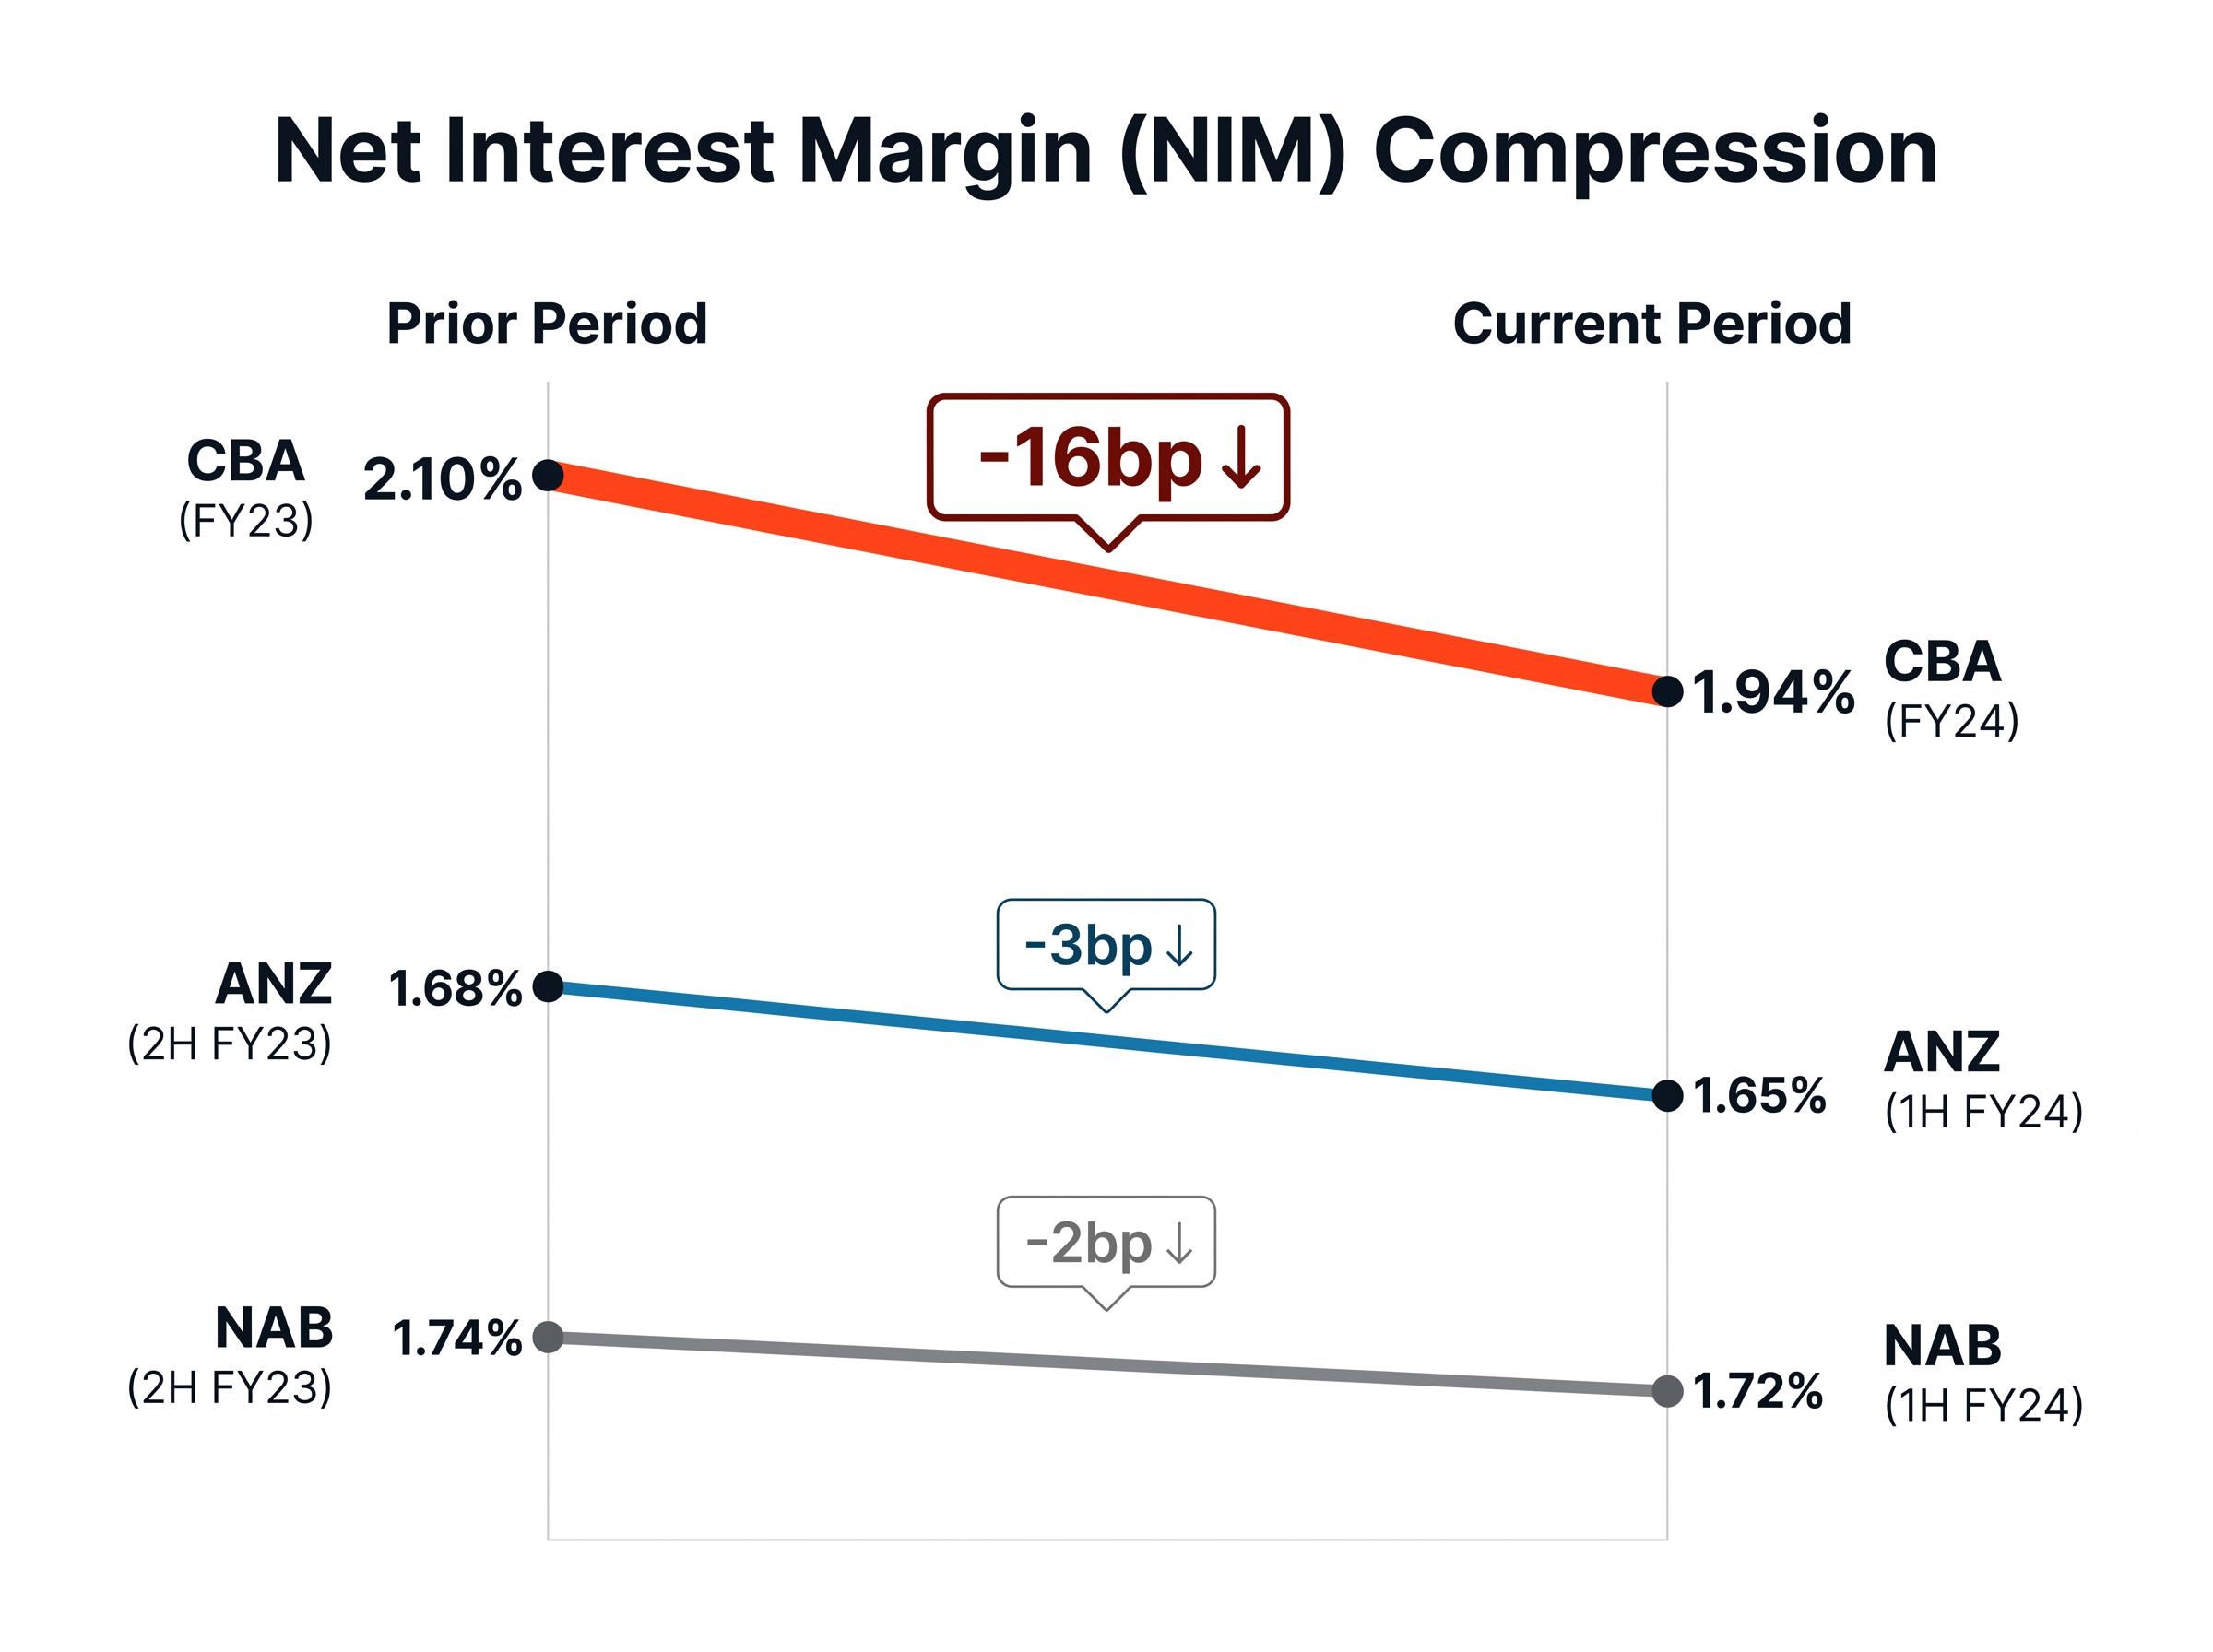
That range is so wide it is functionally useless without deeper work. CBA’s NIM fell from 2.10% in FY23 to 1.94% in FY24, a 16 basis point compression that reduced earnings in a way no static PE multiple could have predicted. The RBA’s October 2024 Financial Stability Review confirmed the dynamic: competitive pressures and higher funding costs had begun compressing major bank margins. The PE ratio recorded the result; it did not warn investors it was coming.
When big ASX news breaks, our subscribers know first
Funding source composition: the risk hiding in plain sight on the balance sheet
Most retail investors focus on the income statement. The funding side of the balance sheet rarely gets the same attention, yet it is where some of the most consequential margin risks sit.
Bank funding exists on a spectrum. At the stable, low-cost end are customer deposits: savings accounts, term deposits, and transaction balances. At the volatile, rate-sensitive end is short-term offshore wholesale funding, which is subject to global credit market conditions, foreign exchange movements, and investor sentiment that has nothing to do with the Australian housing market.
Based on 2024 disclosures, the three majors reported the following funding compositions:
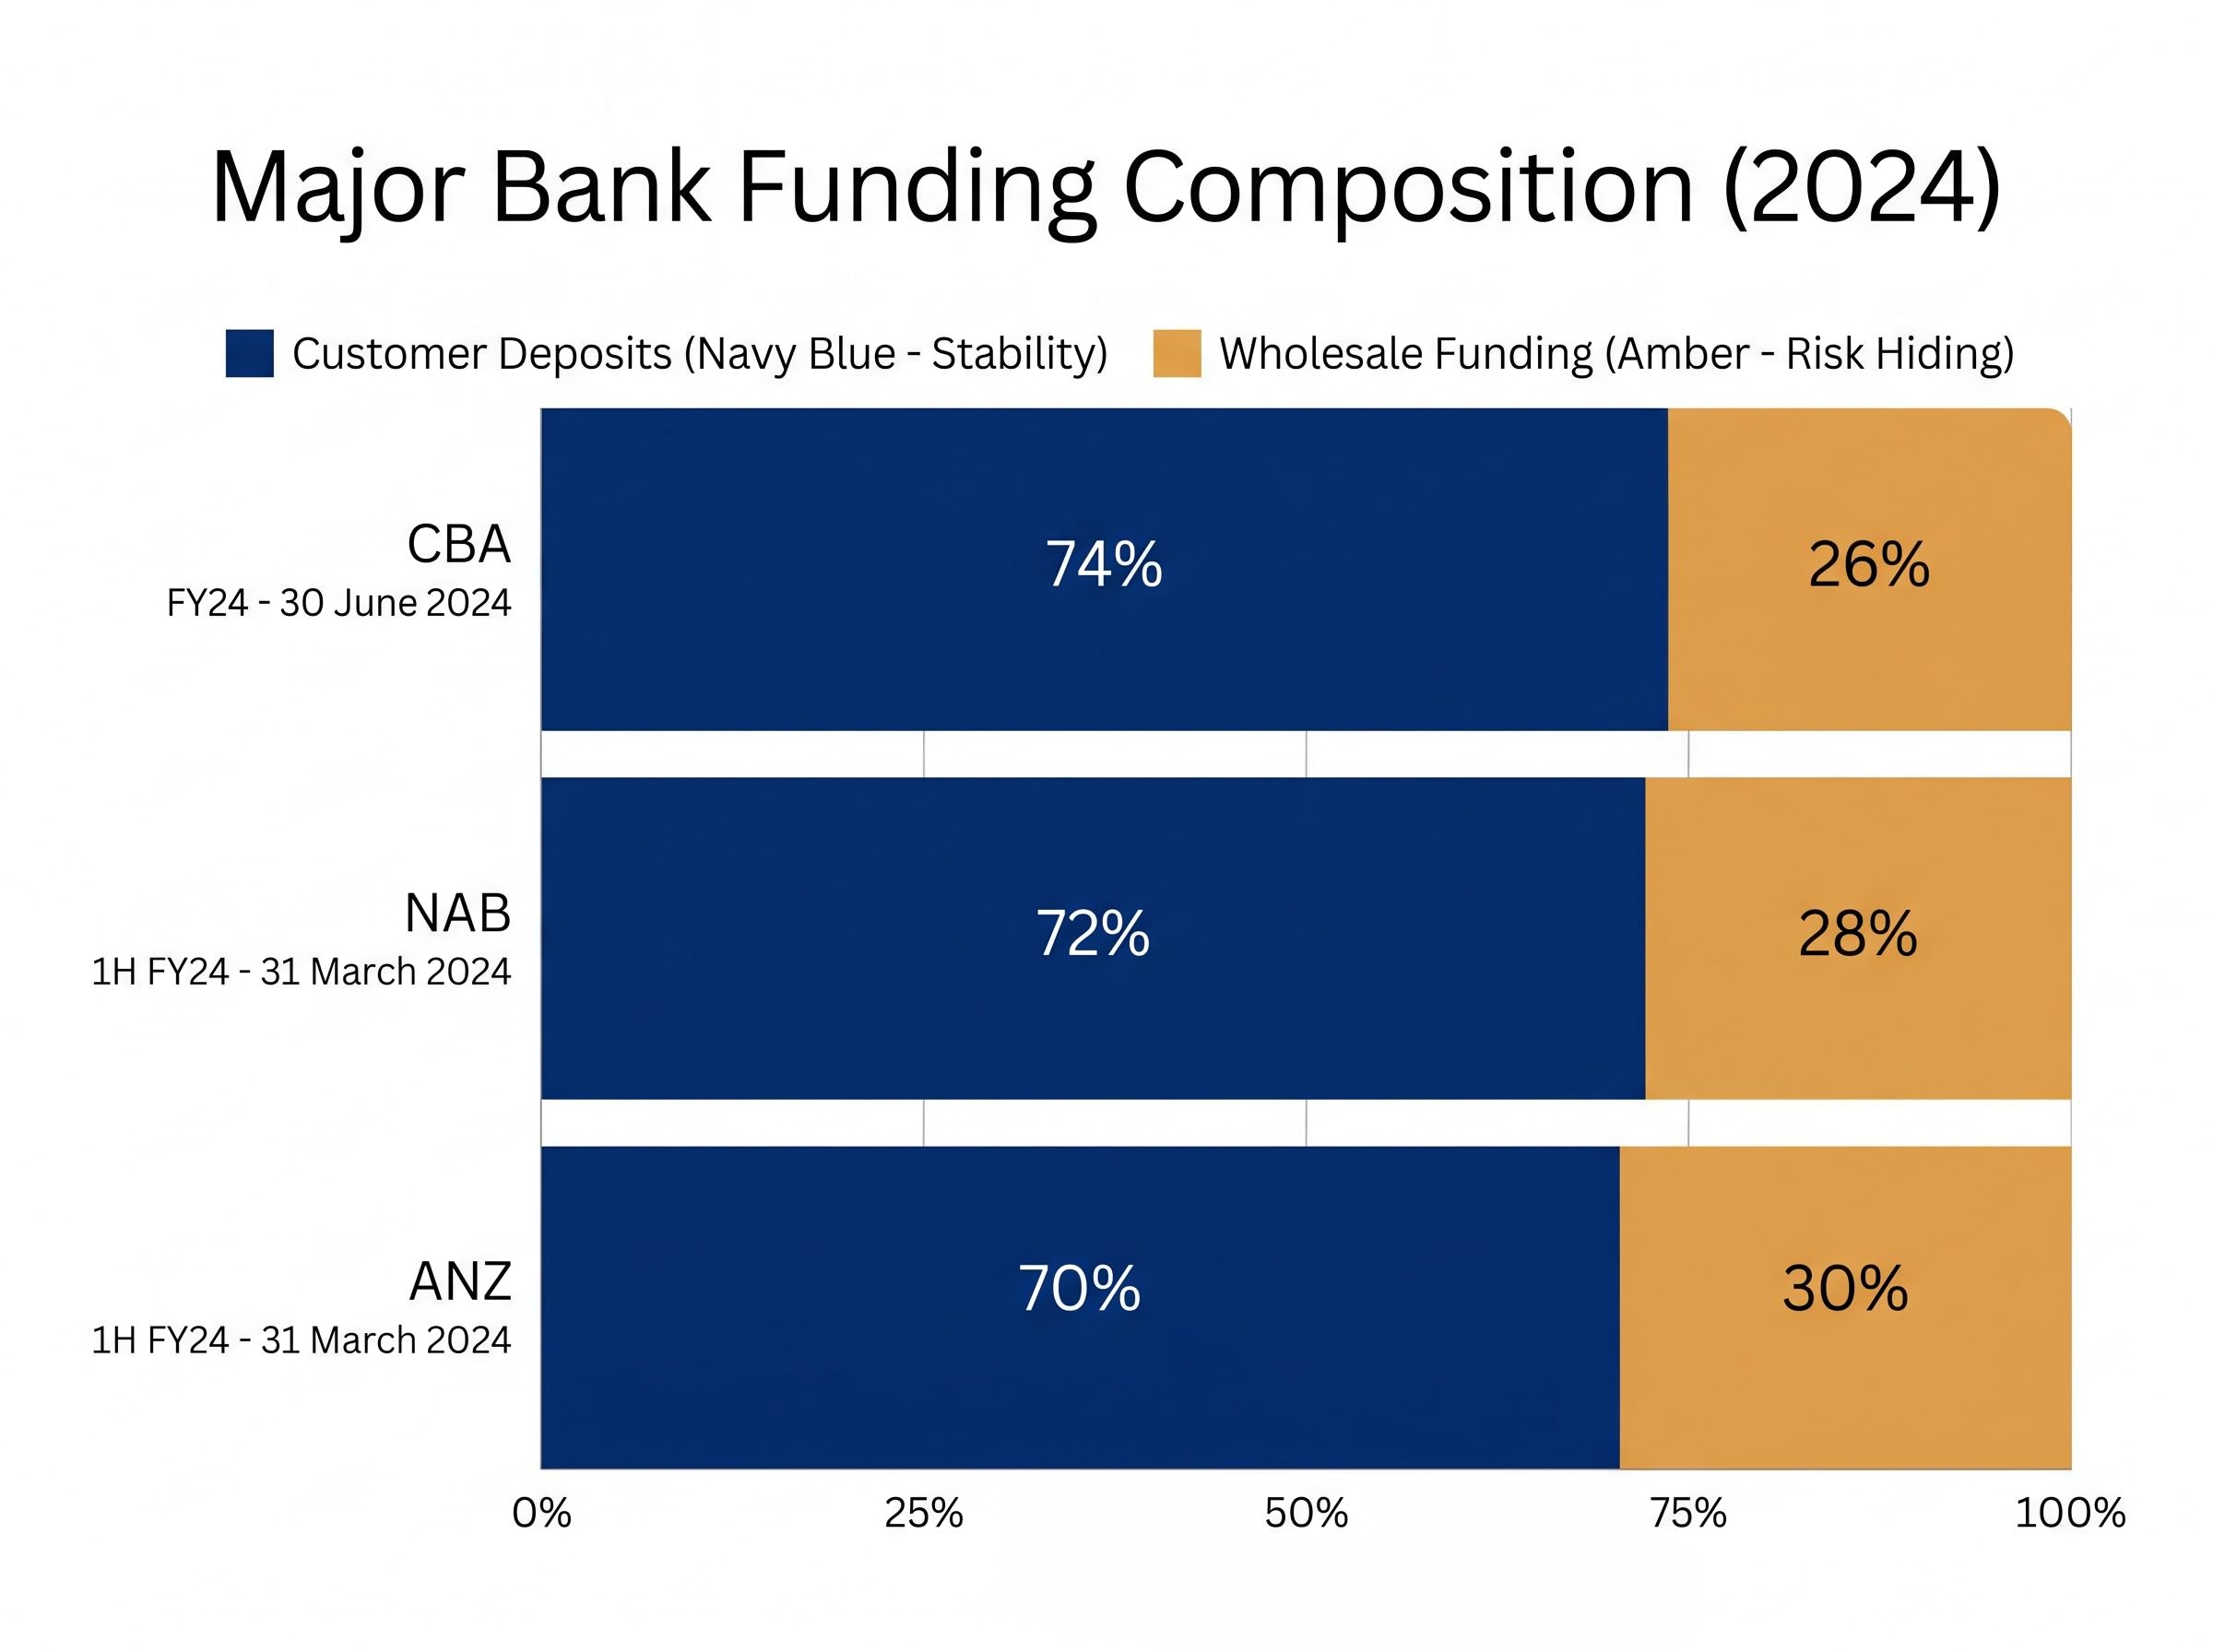
| Bank | Customer Deposits (% of funding) | Wholesale Funding (% of funding) | Reporting Period |
|---|---|---|---|
| CBA | 74% | 26% | FY24 (30 June 2024) |
| NAB | 72% | 28% | 1H FY24 (31 March 2024) |
| ANZ | 70% | 30% | 1H FY24 (31 March 2024) |
The 25-30% sitting outside customer deposits matters disproportionately. When the RBA’s pandemic-era Term Funding Facility (TFF) expired, banks were forced to refinance that cheap central bank funding into more expensive offshore wholesale markets. The RBA’s October 2024 Financial Stability Review noted directly that “funding costs have risen as cheap pandemic-era funding has rolled off.” That single refinancing event contributed to NIM compression across the entire sector.
Offshore wholesale reliance creates several specific risks investors should monitor:
- Foreign exchange exposure on non-AUD denominated issuance
- Global credit spread sensitivity, meaning Australian bank funding costs can rise because of events in Europe or the US
- Refinancing cliff risk when large tranches of term wholesale funding mature within a narrow window
- Rate volatility that feeds directly into the cost of new wholesale issuance
APRA has noted that major banks carry “substantial offshore wholesale funding” but that liquidity coverage ratios remain well above regulatory minimums. The risk is not solvency. It is margin pressure that accumulates quietly and shows up in earnings only at the next result.
Westpac’s decision to exit SEC registration in May 2026 illustrates the strategic significance of the deposit-to-loan funding ratio in practice: with that ratio above 80%, the bank determined it no longer needed the US offshore issuance programme that SEC registration enabled, a real-world example of how a bank’s funding composition directly shapes its strategic and regulatory choices beyond the income statement.
What loan book growth actually signals about a bank’s risk appetite
Headline loan book growth rates are among the most widely cited figures in bank result coverage. They are also among the least informative without context.
All three majors grew their loan books at similar headline rates during 2024:
| Bank | Period | Opening Loan Book | Closing Loan Book | Growth Rate |
|---|---|---|---|---|
| ANZ | 1H FY24 (Oct 2023 – Mar 2024) | A$723.6bn | A$744.5bn | +2.9% |
| NAB | 1H FY24 (Oct 2023 – Mar 2024) | A$718bn | A$735bn | +2.4% |
| CBA | FY24 (Jul 2023 – Jun 2024) | A$1,049bn | A$1,078bn | +2.8% |
Note: These figures are from 2024 reporting cycles. ANZ and NAB 1H FY26 results were released in May 2026. Investors should update with current filings before making decisions.
Similar headline numbers can mask very different composition risks. The question is not whether the loan book grew, but where the growth came from.
Growth rate versus growth quality: what the cohort breakdown reveals
Raw growth only becomes meaningful when broken down by cohort. The segments that matter most in a high-rate environment are:
- Owner-occupier versus investor lending. Investor loans typically carry higher arrears risk during periods of rental market softening or property price correction.
- Fixed versus variable rate. Fixed-rate borrowers who originated at low COVID-era rates face payment shock when those loans roll onto variable rates.
- High debt-to-income lending (DTI greater than 6x). APRA monitors high-DTI lending as a systemic risk indicator. A bank that grew aggressively in this cohort during a rate-rising cycle is building future impairment exposure.
- Interest-only share. Interest-only loans defer principal repayment, meaning borrowers carry higher balances for longer and are more vulnerable to negative equity.
Rapid loan book expansion in the wrong cohorts during a period of elevated rates is a leading indicator of future impairment charges. Two banks growing at +2.5% can carry very different forward risk profiles depending on whether that growth came from low-DTI owner-occupier lending or high-DTI investor and interest-only segments. APRA’s published lending standards provide the benchmark for what prudent growth looks like at a system level; individual bank disclosures reveal how closely each lender adheres to it.
APRA’s bank capital framework sets out the specific CET1 ratio thresholds that define the “unquestionably strong” benchmark, providing investors with the regulatory baseline against which each major bank’s reported capital position should be assessed.
How provisioning decisions reveal what management really believes about credit quality
Impairment charges are the line item most retail investors skip past in a bank result. They should be the first place an investor looks.
Provisions fall into two categories. Individually assessed provisions relate to specific loans already identified as impaired, where the borrower has missed payments or the collateral value has fallen below the outstanding balance. Collectively assessed provisions are forward-looking estimates of future losses across the broader portfolio, calculated using expected credit loss models. It is in the collective provisions, and particularly in the management overlays applied on top of those models, where management discretion lives.
A management overlay is an additional provision that the board adds beyond what the statistical model calculates. The size and rationale of that overlay is one of the clearest qualitative signals available about how cautiously a bank’s leadership is reading the credit cycle. A large overlay maintained during a period of benign credit conditions suggests a board that sees risks the headline data does not yet reflect.
The 2024 impairment charges across the three majors illustrate how differently this can play out:
| Bank | Reporting Period | Impairment Charge | Prior Period Charge | Direction of Travel |
|---|---|---|---|---|
| ANZ | 1H FY24 | A$362m | Prior half comparable | Stable, cautious |
| NAB | 1H FY24 | A$191m | Prior half comparable | Low, overlays maintained |
| CBA | FY24 | A$1,154m | A$511m (FY23) | More than doubled year-on-year |
CBA’s figure stands out. A loan impairment expense that more than doubled in a single year, from A$511m to A$1,154m, is the kind of movement that warrants close attention.
CBA noted that “arrears and troublesome and impaired assets remain low, but have increased from cyclical lows.”
That language is worth parsing carefully. “Remain low” is reassuring. “Increased from cyclical lows” is the signal. It means the direction of travel has turned, even if the absolute level is still manageable. Across all three banks, the 2024 message was consistent: credit quality described as sound but normalising, with collective provisions and overlays maintained in anticipation of ongoing rate and cost-of-living pressure.
An investor who reads provision movements correctly can distinguish a bank that is being prudent from one that may be under-provisioning to protect reported earnings. The difference between those two readings can define the investment outcome over a full credit cycle.
Net interest margin as the operational heartbeat of any bank investment thesis
Net interest margin is the spread between what a bank earns on its loans and what it pays on its deposits and wholesale funding. It is the single most direct measure of a bank’s core profitability, and it is the metric that determines whether an income thesis built on dividends will hold.
All three majors experienced NIM compression between FY23 and FY24:
| Bank | Prior Period NIM | Current Period NIM | Change (bp) | Primary Driver Cited |
|---|---|---|---|---|
| ANZ | 1.68% (2H FY23) | 1.65% (1H FY24) | -3bp | Higher funding costs, competition |
| NAB | 1.74% (2H FY23) | 1.72% (1H FY24) | -2bp | Deposit mix shift, competition |
| CBA | 2.10% (FY23) | 1.94% (FY24) | -16bp | Deposit competition, wholesale costs |
Note: All NIM figures are from 2024 reporting periods and require update from 1H FY26 results before forming a current view.
The RBA’s February 2025 Statement on Monetary Policy confirmed that bank NIMs had peaked and were mildly declining, driven by increasing deposit competition, the benefit from higher rates on at-call deposits having largely flowed through, and funding cost normalisation as pandemic-era facilities expired. The RBA cash rate sits at 4.35% as of 6 May 2026, having been reduced to 4.10% in March 2026 before being raised back, creating a live rate environment where NIM dynamics are actively shifting.
NIM compression of even 15-20 basis points can materially reduce a major bank’s net profit and dividend capacity. Investors who track NIM quarterly, not just annually, are reading the most direct indicator of whether their income thesis remains intact.
Reading NIM disclosures in bank result presentations
Every major bank publishes a NIM bridge slide in its results presentation. Three things are worth looking for:
- The contribution from asset repricing. This shows how much the bank is earning from loans rolling onto higher rates. A declining contribution suggests the repricing benefit is fading.
- The drag from deposit competition. This quantifies how much the shift from low-cost at-call deposits into higher-rate term deposits is costing the bank. A widening drag is a structural headwind.
- The rate sensitivity disclosure. Banks disclose the estimated earnings impact of a 25 basis point move in the cash rate. These figures are often buried deep in results packs, but they are among the most useful forward-looking data points available to a retail investor.
The next major ASX story will hit our subscribers first
Putting the checklist together: from metrics to a considered position
The preceding sections each isolate a single dimension of bank due diligence. The real value comes from combining them into a framework that can be applied to any ASX-listed bank, not as a pass-fail hurdle race, but as a weighting exercise. A bank with strong loan book quality and conservative provisioning can carry more offshore wholesale exposure without disqualifying itself. A bank with compressing NIMs and aggressive growth in high-DTI cohorts warrants closer scrutiny regardless of its headline PE.
The due diligence checklist, in order of priority:
- Loan book growth quality by cohort: Where is growth coming from, and which segments carry elevated arrears risk?
- Provisioning direction and overlay size: Are impairment charges rising or falling, and how large are the management overlays relative to modelled losses?
- Deposit-to-wholesale funding ratio: What share of funding comes from stable customer deposits versus rate-sensitive wholesale markets?
- NIM trajectory and rate sensitivity: Is the margin compressing, and what does the bank’s own sensitivity disclosure say about the impact of the next rate move?
- Capital position relative to APRA’s “unquestionably strong” benchmark: Does the bank carry sufficient buffers above regulatory minimums to absorb a downturn without cutting dividends?
Return on equity and CET1 ratios round out the analytical picture: CBA’s FY25 cash ROE of 13.5% sits well above the sector average of 9.35%, and a bank that consistently earns above its cost of equity justifies trading at a premium to book value, which is why that premium cannot be read as overvaluation without first checking whether the underlying capital position and margin durability support it.
The core principle: valuation is only as reliable as the earnings quality that underlies it, and earnings quality in banking is a balance sheet question, not an income statement question.
Simple valuation metrics establish a price anchor. The indicators in this guide determine whether the earnings and dividends that anchor is built on are sustainable. For current data, ANZ and NAB 1H FY26 results were released in May 2026; CBA’s most recent results are available via commbank.com.au. The Morningstar framework for valuing Australian banks (April 2024) provides an independent public resource for further reading.
The real work starts where the PE ratio stops
PE ratios and dividend discount models are a legitimate starting point for valuing ASX bank stocks. They are not a destination. They tell an investor almost nothing about the credit cycle position, funding risk, or NIM trajectory that will determine whether the investment thesis holds over the next two to three years.
The deeper indicators covered in this guide, loan book composition, provisioning philosophy, funding source mix, and net interest margin mechanics, are not one-time checks. They are a standing checklist that should be reviewed every half-year results cycle, not just at the point of initial purchase.
The ASX majors carry strong capital positions, liquidity coverage ratios well above regulatory minimums, and a long track record of dividend delivery. Those structural strengths are real. They do not, however, insulate any one bank from a mispriced loan book or a funding cost shock that compresses margins beyond what the market has priced in.
All specific figures in this guide are drawn from 2024 reporting cycles and must be refreshed from current results before any position is sized. The balance sheet tells the story that the income statement has not yet reported. Reading it is where the real work begins.
For investors wanting to test this framework against a single bank in depth, our dedicated guide to qualitative bank valuation works through NAB’s management credibility, loan-book discipline, and franking credit mechanics, and shows how a DDM sensitivity table for NAB alone produces outputs ranging from $19.00 to $85.50 depending on discount and growth rate assumptions.
This article is for informational purposes only and should not be considered financial advice. Investors should conduct their own research and consult with financial professionals before making investment decisions. Past performance does not guarantee future results.