A company that has more than doubled its net profit in three years, carries more cash than debt, and is growing revenue at 13.6% annually is not typically associated with a kind of share price performance that leaves investors questioning the market’s logic. Yet that is precisely the situation ResMed finds itself in on the ASX as of May 2026, with the stock down approximately 21% from its highs while operational results have consistently beaten expectations.
ResMed (ASX: RMD) is one of the most globally significant healthcare technology companies with Australian origins, and its 2026 share price performance has reopened a debate about whether sentiment has diverged from fundamental value. The company’s price-to-sales ratio has compressed to roughly half its five-year historical average, even as quarterly earnings reports have delivered double-digit growth.
What follows is a structured walk through ResMed’s business model, its core financial metrics, the bear case driving the multiple compression, and a valuation framework for assessing whether the current price represents genuine opportunity or rational discount.
What ResMed actually does, and why that matters for valuation
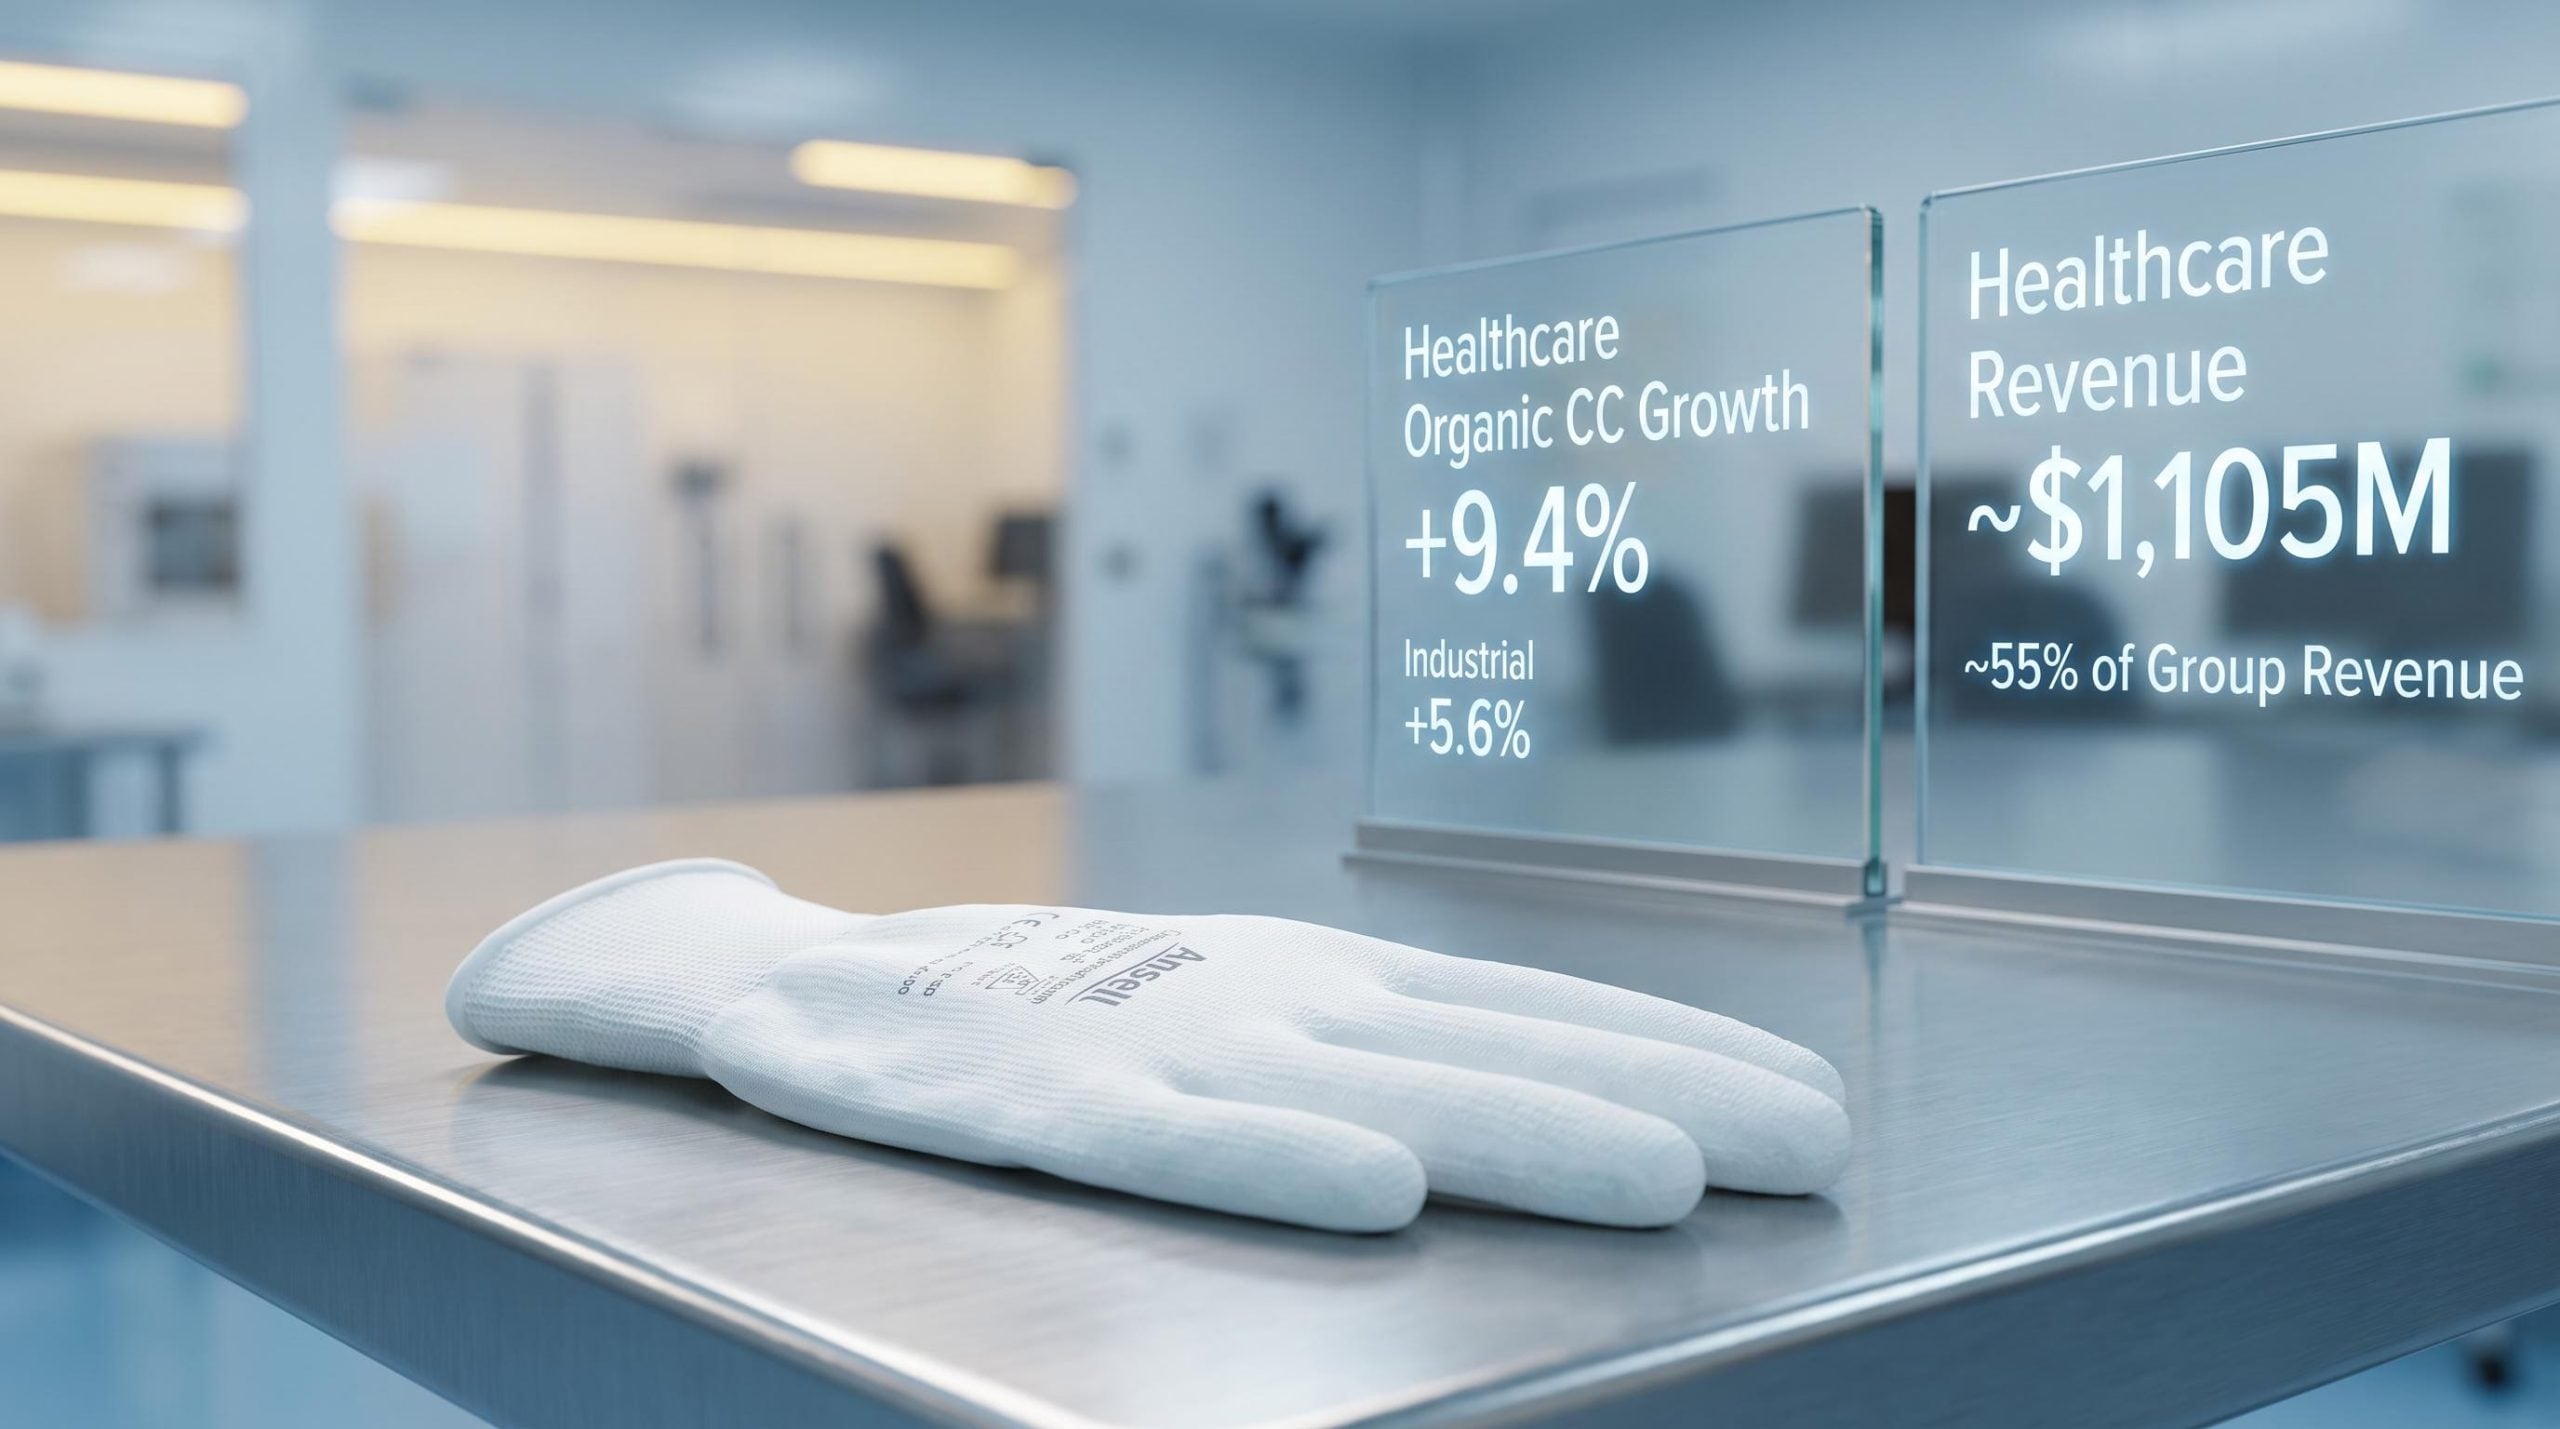
Before any valuation ratio means anything, the business underneath it needs to be understood. ResMed operates across two distinct segments:
Sleep and Breathing Health (Devices):
- Core offering: CPAP machines, masks, and respiratory care devices for obstructive sleep apnoea (OSA) and chronic respiratory conditions
- Primary growth driver: global diagnostic expansion and device replacement cycles
- Reach: more than 10,000 employees across 140-plus countries
Residential Care Software (SaaS):
- Core offering: cloud-connected software platforms for home healthcare providers
- Primary growth driver: recurring subscription revenue with expanding margin profile
- Q1 FY26 growth: 5%, with management guiding toward acceleration into high single-digit growth as SaaS mix increases
The SaaS segment matters disproportionately for valuation. Recurring, higher-margin software revenue partially insulates the business from device-cycle volatility and introduces earnings quality that a hardware-only company cannot match. FY26 guidance targets a gross margin of 62-63% with research and development spend at 6-7% of revenue.
CDI structure and what it means for ASX investors
ResMed was founded in Australia by Peter Farrell, but its primary listing is now on the NYSE. ASX-listed CHESS Depositary Interests (CDIs) represent economic interests in the US-listed share, with the price denominated in AUD and subject to AUD/USD exchange rate translation effects. Market announcements follow US reporting formats and timing, so Australian investors receive results on a US-calendar schedule. This structure means movements in the AUD/USD rate can amplify or dampen the ASX-listed price independently of the company’s underlying operational performance.
CDI settlement mechanics differ in important ways from ordinary ASX share purchases: CHESS Depositary Interests carry T+2 settlement obligations and involve currency conversion at the point of trade, meaning AUD/USD rate movements between trade execution and settlement can affect the effective cost basis independently of any movement in the underlying US-listed security.
When big ASX news breaks, our subscribers know first
The financial scorecard: revenue, profit, and margins in context
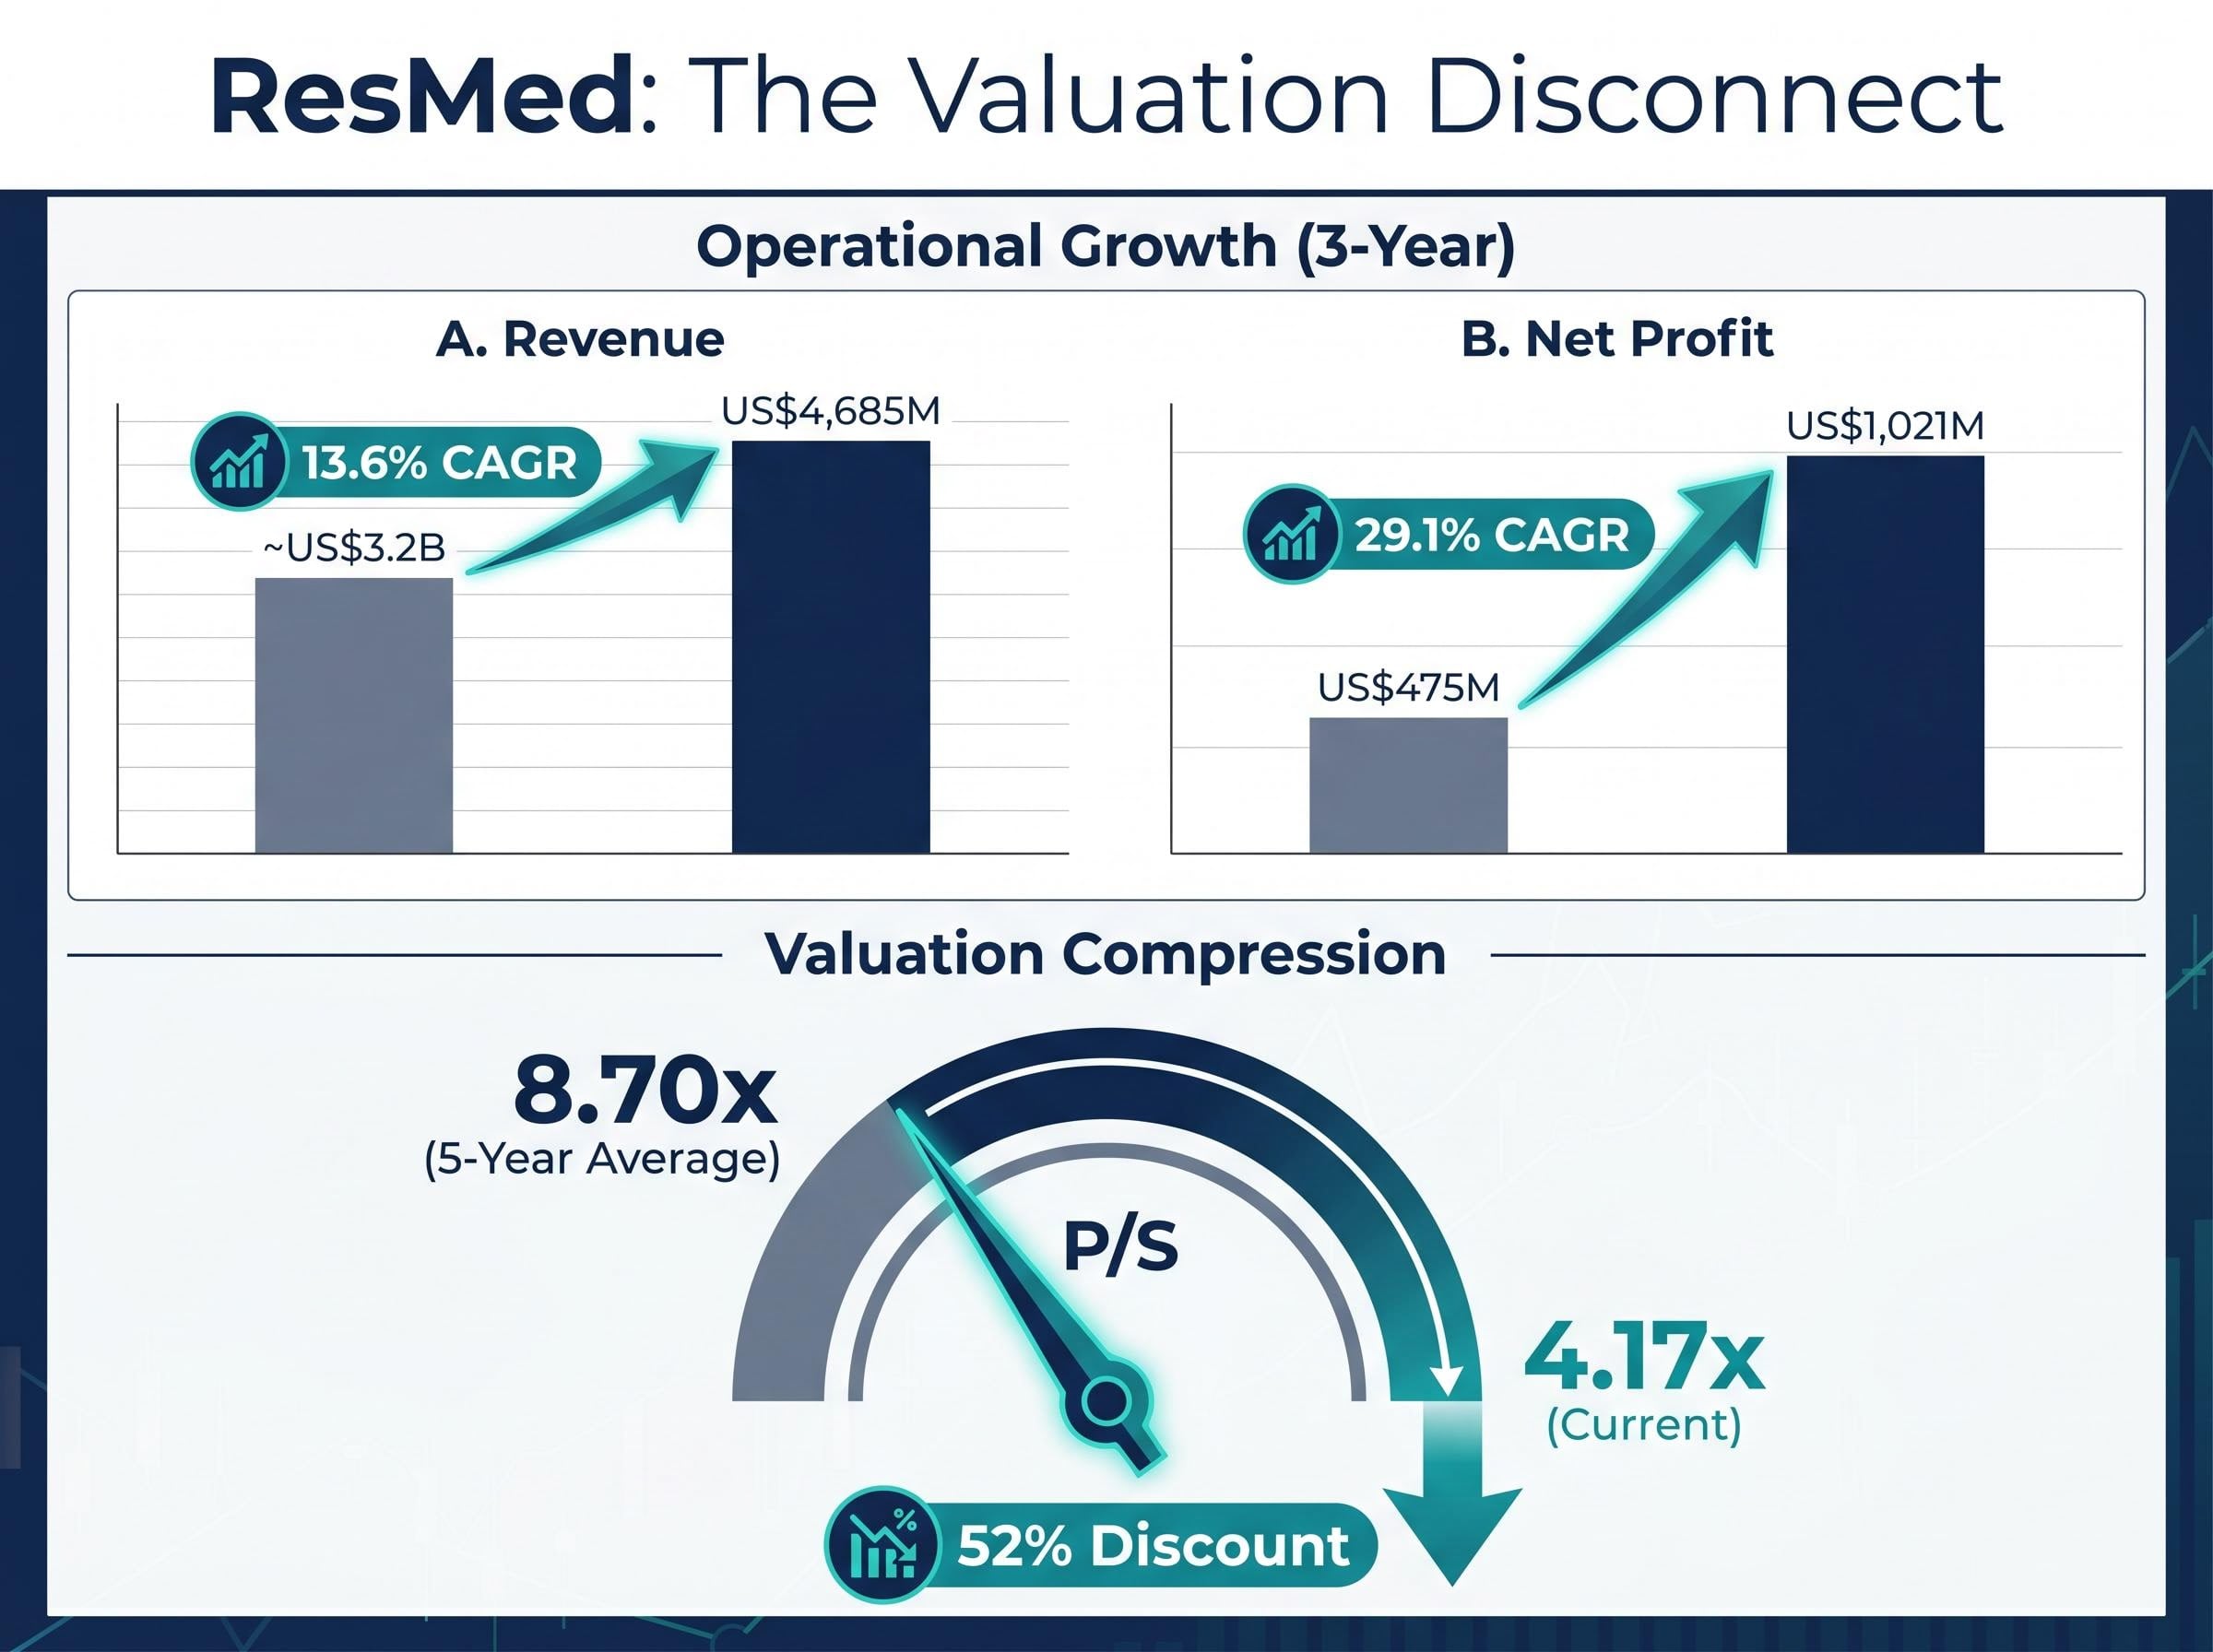
Start with the top line. ResMed generated US$4,685 million in annual revenue, growing at a 13.6% compound annual growth rate (CAGR) over the preceding three years. That is consistent, high single to low double-digit growth sustained across multiple quarters without material interruption.
The profit story is where the numbers become harder to reconcile with the share price. Net profit reached US$1,021 million in the most recently reported year, up from US$475 million three years prior. That translates to a 29.1% profit CAGR, meaning profitability has grown at more than double the rate of revenue. This is not top-line expansion alone; it is operational leverage converting revenue growth into accelerating earnings.
Standout metric: A 29.1% net profit CAGR over three years, more than double the revenue growth rate, signals durable operational leverage rather than margin-neutral expansion. This is the single data point that most directly challenges the valuation decline narrative.
The most recent quarter confirmed the trajectory. Q3 FY26 (quarter ended 31 March 2026) delivered revenue of US$1.43 billion, up 11% year-over-year. Non-GAAP earnings per share came in at US$2.86, up 21% year-over-year. Net income for the quarter was US$398.7 million.
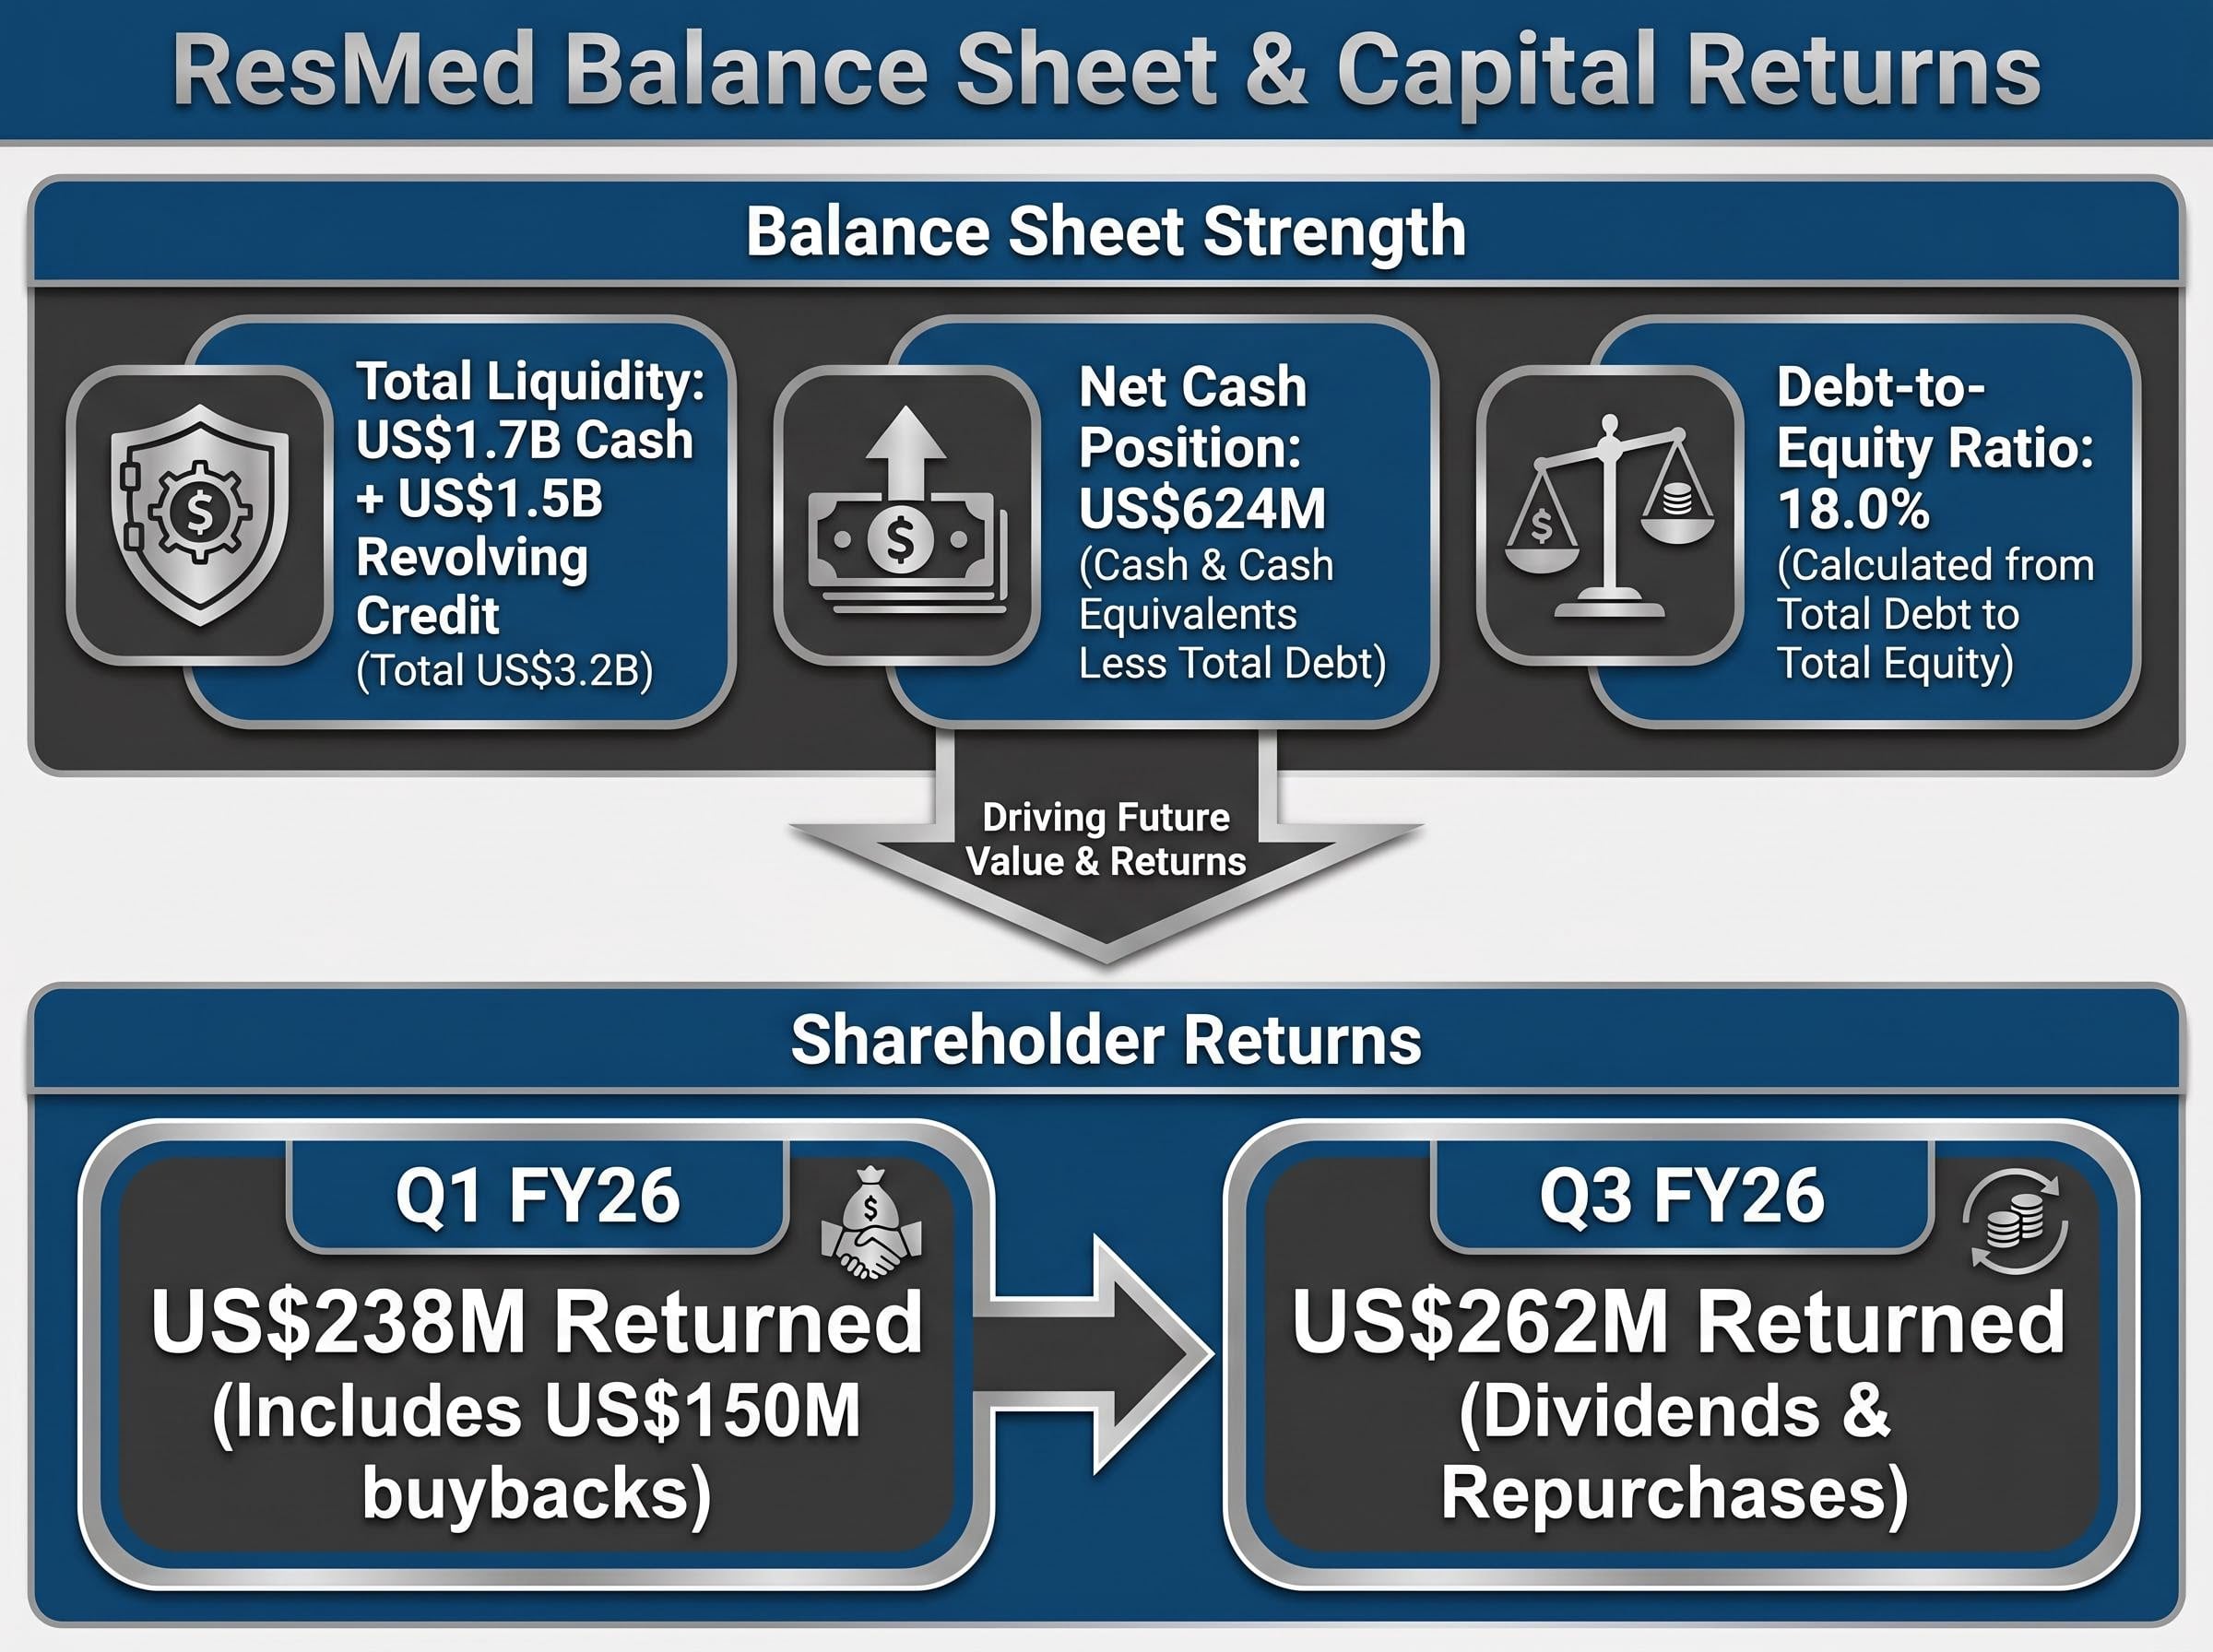
Gross margins have expanded consistently, with the annual figure at 57.4% and the Q1 FY26 quarterly gross margin reaching 62%. The balance sheet carries a net cash position of US$624 million (negative net debt), with a debt-to-equity ratio of just 18.0%.
| Metric | Three Years Prior | Most Recent Annual | Direction |
|---|---|---|---|
| Revenue | ~US$3.2B (implied) | US$4,685M | ↑ 13.6% CAGR |
| Net Profit | US$475M | US$1,021M | ↑ 29.1% CAGR |
| Gross Margin | Lower base | 57.4% (annual); 62% (Q1 FY26) | ↑ Expanding |
| Net Debt | Positive (net borrower) | -US$624M (net cash) | ↑ Strengthened |
These metrics collectively describe a business with durable pricing power, accelerating profitability, and a conservative balance sheet. That combination typically supports premium valuation multiples, not discounts.
The respiratory healthcare operating leverage dynamic is visible across the sector: Fisher and Paykel Healthcare lifted its FY26 guidance to NZ$2.30 billion in revenue with NPAT of NZ$450-470 million, as hospital product demand accelerated and efficiency gains expanded margins, demonstrating that durable demand tailwinds for respiratory care companies extend well beyond any single player.
The GLP-1 risk: understanding why the market has re-rated ResMed
The bear case against ResMed is not about what the company has done. It is about what the market believes could happen to its addressable market over the next decade. The logic follows a three-step chain:
- Obesity is a primary driver of obstructive sleep apnoea (OSA) incidence, the condition that creates demand for CPAP devices.
- GLP-1 receptor agonist drugs (such as semaglutide and tirzepatide) are reducing obesity prevalence at population scale.
- If GLP-1 adoption continues to grow, the long-term addressable market for CPAP devices could compress materially.
This is a structurally coherent concern. It is not a near-term earnings shock; it is a long-horizon risk to the total addressable market that began repricing ResMed’s multiple from 2023-2024 onward. Accessible 2026 commentary, including AlphaSpread’s investor-relations summary updated after Q3 FY26 results, characterises the situation as “ongoing repricing” despite improving operational fundamentals.
ASX healthcare valuation compression is not unique to ResMed; Cochlear’s price-to-sales ratio contracted from approximately 9.18x to 2.82x over the same period, illustrating how interest rate-driven multiple de-rating across the sector has created a pattern where share prices have moved independently of structural business drivers.
The risk deserves analytical respect. If GLP-1 drugs reduce OSA incidence by even 10-15% over a decade, the effect on device demand growth rates could be meaningful. This is the single most important factor an Australian investor needs to understand before interpreting the valuation discount.
The SURMOUNT-OSA trial findings, published in Nature Medicine, documented tirzepatide’s effects on OSA-related cardiometabolic outcomes in a randomised controlled setting, providing the kind of peer-reviewed clinical evidence that has given institutional investors a defensible basis for applying a structural discount to device-focused sleep health companies.
How management is responding to the structural risk
ResMed’s response has been concrete rather than rhetorical. Two strategic moves disclosed alongside Q3 FY26 results signal deliberate diversification.
The acquisition of Noctrix Health for US$340 million expands ResMed into restless leg syndrome (RLS) treatment, a sleep disorder with no dependency on OSA prevalence. A new home sleep apnoea test, designed for easier at-home use, aims to widen the diagnosed OSA population, effectively expanding the top of the patient funnel and partially offsetting any long-term demand headwinds.
Governance changes reinforce the narrative management shift. Brett Sandercock, the long-serving CFO, announced his retirement, with Aaron Bloomer appointed as successor. Salli Schwartz was named Chief Investor Relations Officer, a move that signals active management of the company’s capital-markets communication during a period of multiple compression.
Management has reaffirmed its five-year outlook: high single-digit revenue growth sustained, with earnings growth above revenue growth. That guidance has not been revised downward despite more than two years of GLP-1 repricing.
How to think about valuation: P/S ratios, ROE, and the case for deeper analysis
The simplest valuation lens available is the price-to-sales (P/S) ratio, which measures what investors are paying per dollar of revenue. It strips out margin assumptions and gives a raw read on how the market values the top line.
ResMed’s current P/S multiple sits at 4.17x, compared to a five-year historical average of 8.70x. That represents an approximately 52% discount to its own historical norm.
In plain terms, the market is paying roughly half what it has historically been willing to pay for each dollar of ResMed revenue. For a company that is growing revenue faster today than it was during much of that five-year window, the compression demands explanation.
Return on equity (ROE) adds a second lens. ResMed’s ROE of 22.7% (FY24) measures how effectively the company converts shareholder equity into profit. A figure above 15% is generally considered strong for a healthcare company; 22.7% indicates the business is generating returns well above its cost of capital.
Analyst consensus on the RMD share price and analyst consensus sits at a Moderate Buy with a 12-month NYSE target of US$286, implying material upside from the A$28-32 range where ASX CDIs have traded through May 2026, a gap that reflects sentiment overhang rather than any revision to earnings forecasts.
| Metric | ResMed (Current) | Context / Benchmark |
|---|---|---|
| P/S Ratio | 4.17x | 5-year average: 8.70x (52% discount) |
| ROE | 22.7% | High-quality benchmark: 15%+ |
| Net Debt | -US$624M (net cash) | Leveraged peer: typically net borrower |
These ratios, however, are starting points rather than conclusions. P/S alone cannot determine whether a stock is undervalued because it ignores margins, reinvestment requirements, and the cost of capital. A discounted cash flow (DCF) model or dividend discount model (DDM) would incorporate assumptions about GLP-1 market impact, margin trajectory, and required rates of return. For investors considering a position, that deeper modelling work, or consultation with a financial professional, is where the valuation question moves from observation to actionable insight.
Capital returns offer additional context. In Q3 FY26, ResMed returned US$262 million to shareholders via dividends and share repurchases. In Q1 FY26, US$238 million was returned, including US$150 million in buybacks alone. The company holds US$1.7 billion in cash alongside a US$1.5 billion revolving credit facility.
Capital returns, shareholder signals, and what the balance sheet is telling investors
Numbers on a page tell one story. What management does with capital tells another.
ResMed has accelerated shareholder returns during the very period its share price has been under pressure:
- Q3 FY26: US$262 million returned via dividends and share repurchases
- Q1 FY26: US$238 million returned, including US$150 million in share buybacks
- Dividend increase confirmed alongside Q1 FY26 results
- Total available liquidity: US$1.7 billion cash plus US$1.5 billion revolving credit facility
Companies rarely accelerate buybacks at this scale when internal models suggest the stock is fairly valued or overvalued. A net cash position of US$624 million combined with active repurchases at compressed prices implies management views the stock as undervalued relative to its intrinsic assessment.
The debt-to-equity ratio of 18.0% confirms conservative financial management, with equity substantially exceeding borrowings. For investors weighing whether the current valuation discount might be capturing hidden balance sheet risk, the answer from the financials is that it is not. The balance sheet is a source of strength, not a source of the discount.
Opportunity or value trap? What Australian investors need to weigh before acting
The tension between the bullish fundamentals and bearish structural uncertainty is real and unresolved. Both cases rest on verifiable evidence.
| Dimension | Bull Case | Bear Case |
|---|---|---|
| Revenue Growth | 13.6% CAGR sustained; Q3 FY26 up 11% YoY | GLP-1 adoption could slow long-term OSA demand growth |
| Valuation Multiple | P/S of 4.17x is 52% below 5-year average of 8.70x | Compression may be rational re-rating, not a discount |
| GLP-1 Impact | No revenue impact visible through Q3 FY26; guidance reaffirmed | Structural risk may take 5-10 years to materialise in device demand |
| Strategic Diversification | Noctrix (US$340M) and home testing expand addressable market | New segments unproven at scale; integration risk present |
Forward-looking signal: Management has reaffirmed its five-year outlook of high single-digit revenue growth with earnings growing faster than revenue. This guidance has not been revised downward despite more than two years of GLP-1 multiple compression.
Three variables deserve monitoring for investors updating their thesis over time. New clinical evidence on GLP-1 drugs and OSA incidence rates would be the most material data point. Quarterly revenue guidance revisions from ResMed itself would signal whether management’s confidence is shifting. And for ASX investors specifically, AUD/USD movements will continue to affect CDI pricing independently of the company’s operational trajectory.
FY26 gross margin guidance of 62-63% provides a near-term benchmark against which execution can be measured.
This article is for informational purposes only and should not be considered financial advice. Investors should conduct their own research and consult with financial professionals before making investment decisions.
Strong numbers, compressed price: the disconnect is real but so is the risk
The gap between ResMed’s operational performance and its current ASX valuation is quantifiable and significant. Revenue is growing at double digits. Profit is compounding at nearly 30% annually. The balance sheet carries net cash. Management is buying back stock at scale.
The GLP-1 discount is not irrational. It reflects a structurally coherent concern about the long-term addressable market for sleep apnoea devices. Whether the market is correctly pricing that risk or over-discounting a long-term uncertainty that has yet to appear in any quarterly result is the question that separates the bull and bear thesis.
Resolving it requires DCF-level analysis with explicit assumptions about the pace and depth of OSA market disruption. For Australian investors considering a position, that modelling work, calibrated to individual risk tolerance and tax circumstances, is the logical next step.
Past performance does not guarantee future results. Financial projections are subject to market conditions and various risk factors.