WOW’s 12% Rally Masks a 1.9% ROE and 300% Leverage
4 mins ago

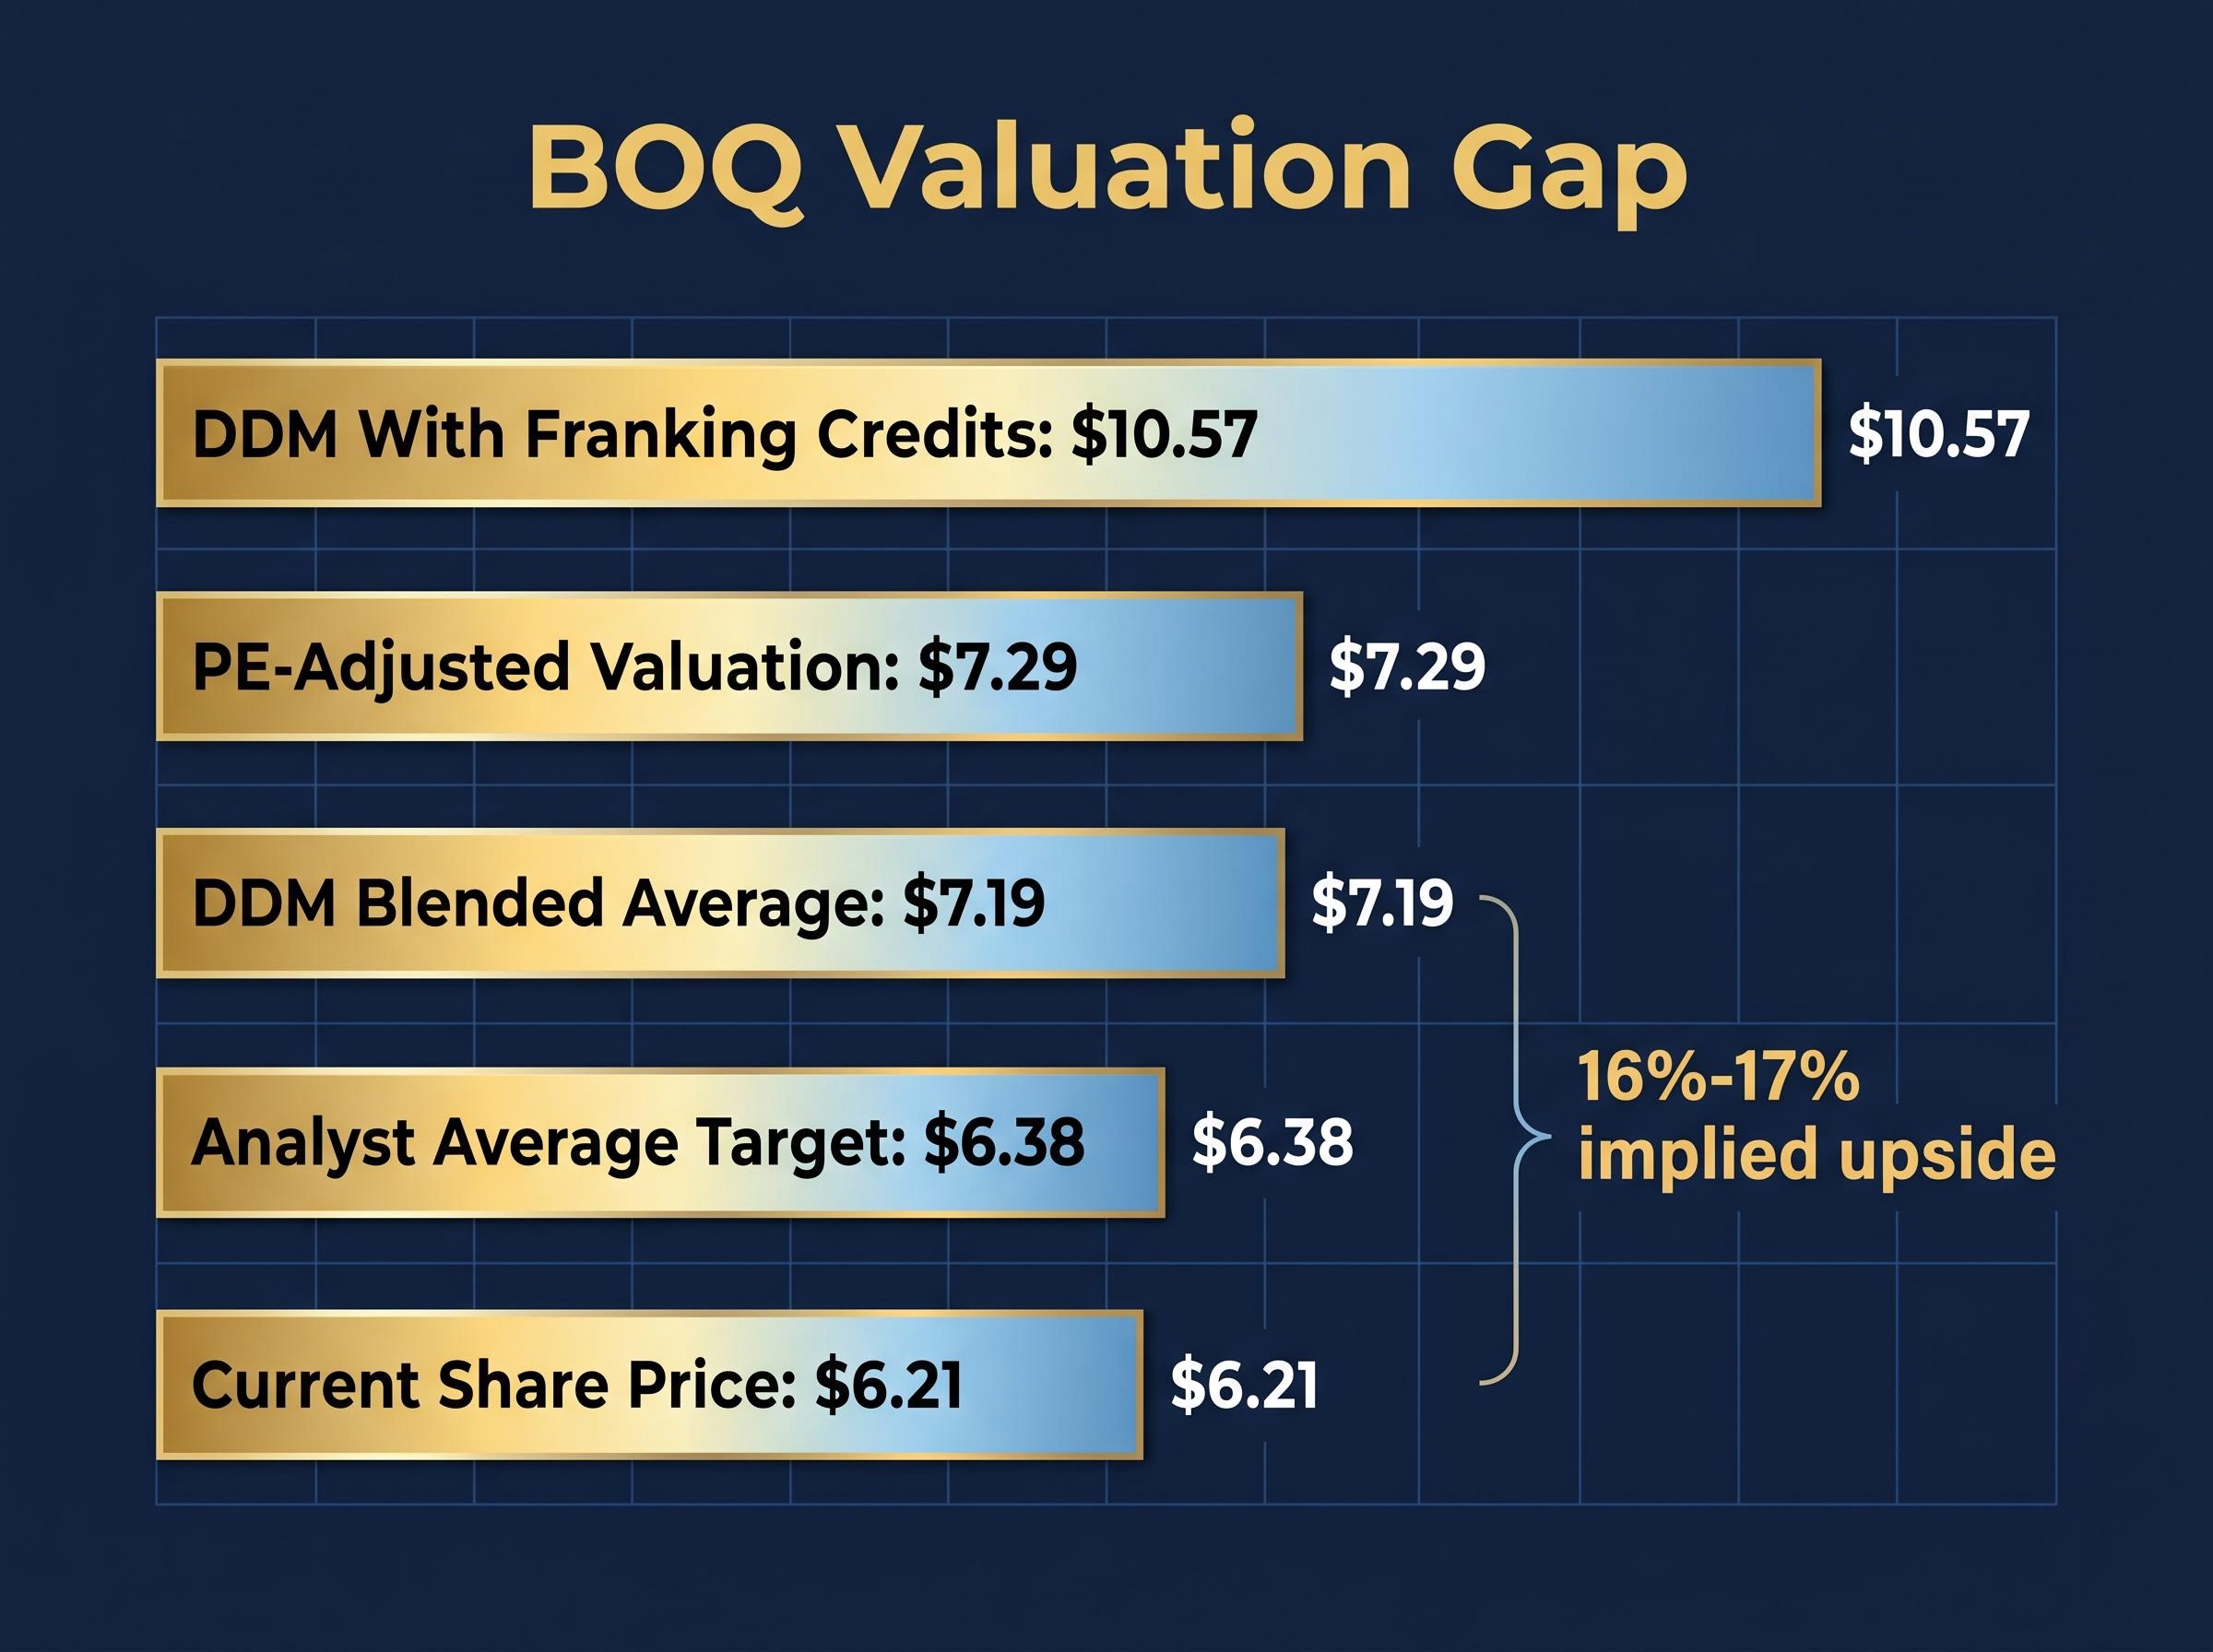
Bank of Queensland shares closed at $6.21 on 15 May 2026, yet two independent valuation models place intrinsic value somewhere between $7.29 and $10.57. That gap, ranging from 17% to 70% above the current price, is wide enough to demand scrutiny rather than excitement. The 1H FY2026 results released on 22 April 2026 showed a net interest margin improving by 10 basis points year-on-year, while cash earnings slipped 4%. Analyst consensus sits at Sell, with an average price target of $6.38, barely above the current price. What follows walks through both the price-to-earnings (PE) ratio method and the Dividend Discount Model (DDM) step by step, explains the assumptions behind each output, and gives readers a grounded view of what the numbers do and do not tell them about BOQ’s investment case.
The $6.21 close on 15 May 2026 sits just $0.17 below the average analyst price target of $6.38. Across 14 covering analysts, only 1 rates the stock a Buy, 7 hold, and 6 recommend selling.
Analyst consensus breakdown: 1 Buy, 7 Hold, 6 Sell across 14 analysts, with an average price target of $6.38 (as of May 2026).
The 1H FY2026 results, covering the half-year to 28 February 2026, gave investors a mixed picture:
The NIM improvement signals pricing discipline, but the earnings decline suggests costs or provisioning are absorbing the benefit. Forward EPS guidance of $0.40-$0.41 for FY2026-27 provides the earnings anchor that feeds directly into the valuation work below. At a price-to-book ratio of 0.71x, the market is pricing BOQ below the value of its net assets, a signal worth interrogating rather than accepting at face value.
BOQ’s 7.3% share price drop on 22 April 2026 was driven by a 20% statutory profit decline that obscured genuine strategic progress: commercial lending grew 16% and NIM improved 10 basis points, yet the market focused on costs growing 6% and outpacing revenue by two percentage points, a reaction that embedded significant execution risk into the current $6.21 price.
The price-to-earnings ratio measures how much investors pay for each dollar of a company’s annual earnings. It is calculated by dividing the share price by earnings per share (EPS), a figure representing a company’s net profit allocated to each ordinary share.
The steps are straightforward:
| Metric | BOQ observed | Financials sector avg | Peer group avg |
|---|---|---|---|
| PE ratio | 15.1x | 9.9x | 18.0x |
| Implied valuation (EPS × PE) | $6.21 (market) | $4.06 | $7.29 |
At $7.29, the peer-adjusted valuation implies BOQ would need to re-rate by roughly 17% to trade in line with comparable banks. One important caveat: Investing.com reports a BOQ PE of 42.78x, which reflects a different earnings basis (likely trailing twelve-month statutory earnings diluted by one-off items). The discrepancy illustrates why the choice of earnings period can shift a PE from 15x to 43x, and why readers should always verify which earnings figure underpins the ratio they are reading.
Banks lend themselves to dividend-based valuation more naturally than most sectors. Their relatively stable payout histories make dividends a reasonable proxy for the cash flows shareholders can expect, in a way that would not hold for a pre-revenue technology company.
The dividend discount model is most reliably applied to sectors where regulatory constraints or distribution mandates produce predictable payout histories: Australian banks, REITs, utilities, and infrastructure companies all fit this profile, which is why the DDM has long been a standard tool in ASX bank analysis rather than an approach imported from other sectors.
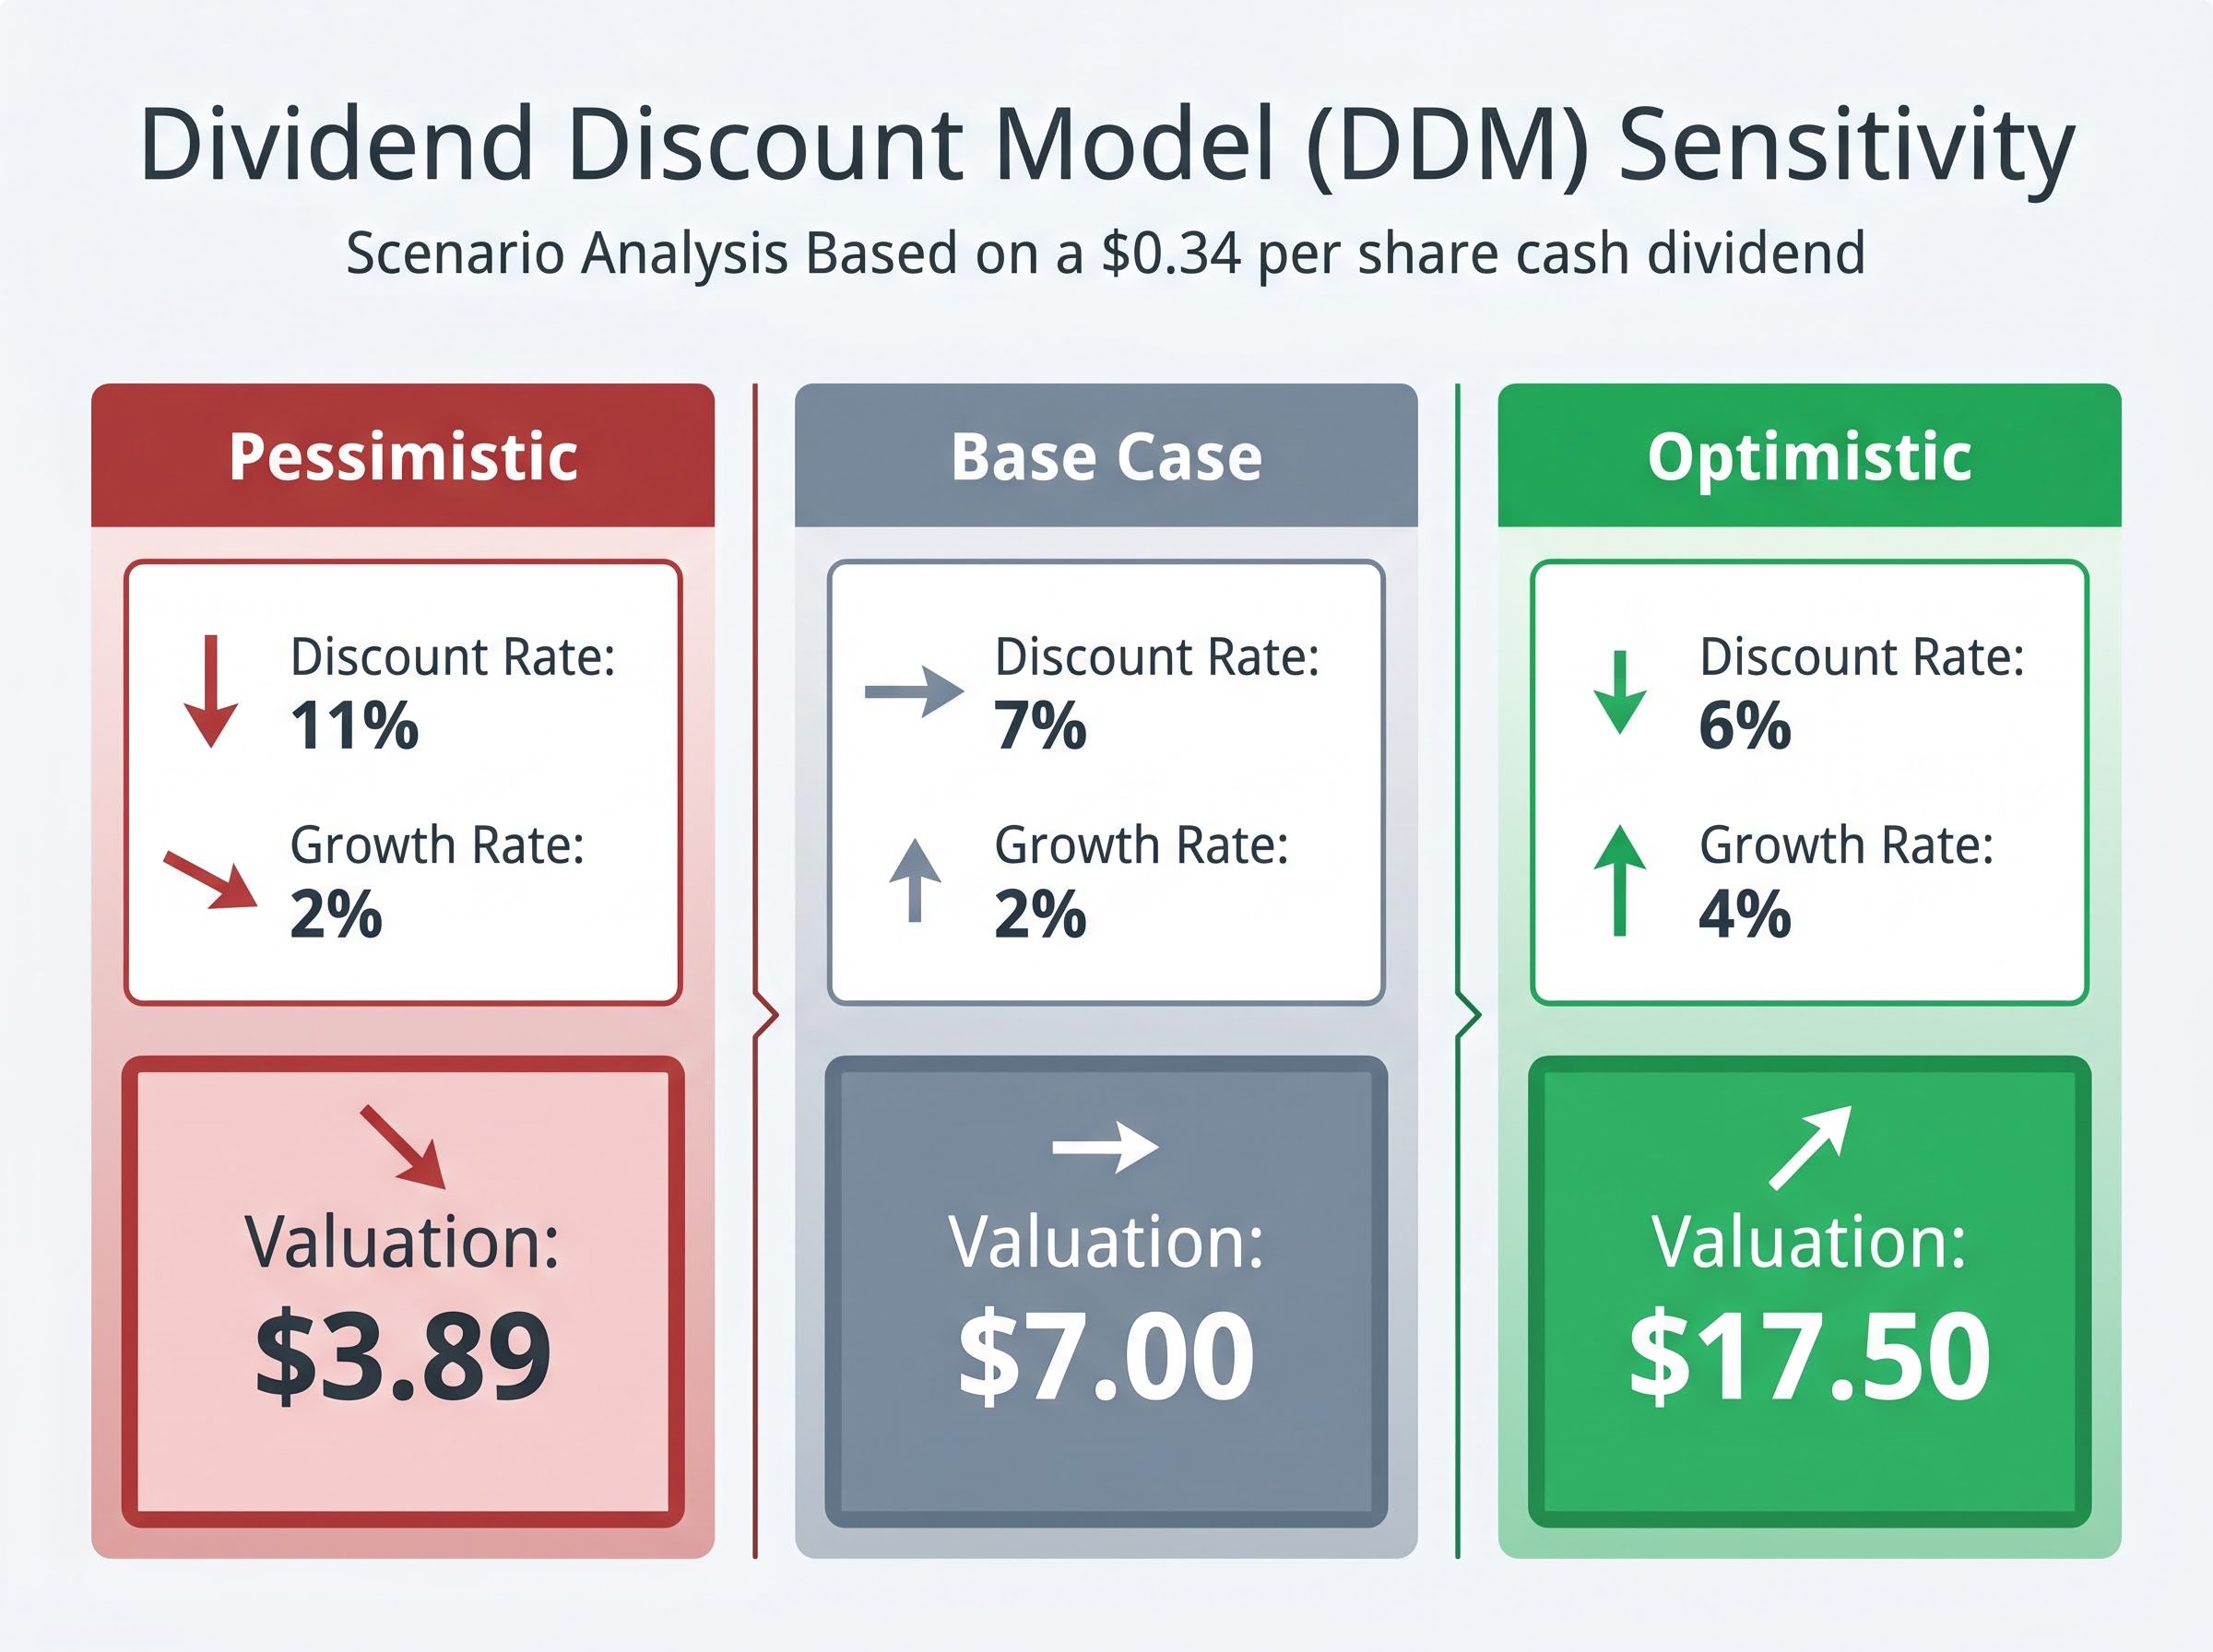
The DDM formula divides the annual dividend per share by the difference between the required rate of return (the discount rate) and the expected long-term dividend growth rate. Using BOQ’s last twelve months cash dividend of $0.34 per share, a 7% discount rate, and a 2% growth assumption produces a base-case valuation of approximately $7.00. Shifting the dividend to $0.35 (reflecting potential modest growth) lifts the output to $7.40.
The model’s value, however, lies not in any single output but in the range it produces when assumptions shift.
| Scenario | Discount rate | Growth rate | DDM valuation |
|---|---|---|---|
| Base case | 7% | 2% | $7.00 |
| Optimistic | 6% | 4% | $17.50 |
| Pessimistic | 11% | 2% | $3.89 |
| Blended average | Various | 2%-4% | $7.19 |
The spread from $3.89 to $17.50 is not a failure of the model. It is the model doing precisely what it should: exposing how sensitive the valuation is to assumptions about growth and risk.
BOQ dividends are fully franked, meaning eligible Australian shareholders receive a company tax credit alongside each dividend payment. For investors in taxable accounts, the gross dividend figure (cash plus franking credits) is the more relevant measure of total return.
Fully franked dividends carry a 30% company tax credit that eligible Australian shareholders can use to offset personal income tax. This makes the gross dividend per share, $0.50 (cash plus franking credits), more representative of total shareholder value than the $0.34 cash figure alone.
Running the DDM on the $0.50 gross dividend produces a valuation of $10.57, the highest output in this analysis. For resident Australian shareholders in taxable accounts, this figure captures the full economic value of BOQ’s distributions in a way the cash-only DDM does not.
Using the grossed-up dividend yield as the DDM input rather than the cash dividend can shift a bank valuation estimate by more than 40%, a gap that explains why eligible Australian investors and SMSFs in pension phase often arrive at materially higher intrinsic value figures than overseas analysts applying the same model to the same stock.
The PE method arrives at $7.29. The DDM blended average lands at $7.19. Two distinct methodologies, built on different inputs, converging in a narrow $7.19-$7.29 zone is worth noting. It provides modest cross-model confirmation that the current price of $6.21 sits below what both approaches identify as fair value on base-case assumptions.
That zone represents roughly 16%-17% implied upside. The franking-adjusted DDM stretches the case further, to $10.57.
The models suggest upside, yet 13 of 14 covering analysts rate BOQ as Hold or Sell. The average target of $6.38 implies the analyst community sees limited near-term catalyst for re-rating. This divergence matters. Models capture what a stock could be worth under certain assumptions; analyst ratings reflect an assessment of whether those assumptions are likely to materialise within an investable timeframe. Both perspectives belong in any honest appraisal.
Valuation models produce numbers. They do not produce investment decisions. The gap between the two is filled by qualitative assessment, and BOQ carries several dimensions that no formula can automate.
APRA’s quarterly ADI performance statistics track net interest income, margin compression, and capital ratios across the authorised deposit-taking sector, providing the industry-wide context against which BOQ’s 1.67% NIM and cost trends should be benchmarked.
Price/Book at 0.71x: The market is pricing BOQ below the book value of its net assets. This may reflect a valuation opportunity, or it may signal structural concerns about return on equity and earnings quality that the models above do not capture.
Both models point to a plausible undervaluation in the $7.00-$7.40 base-case range, with the franking-adjusted DDM stretching that case to $10.57. Neither model changes the fact that 13 of 14 analysts are Hold or Sell.
The conditions that would strengthen the bull case are specific: NIM holding above 1.67%, dividend stability at or above $0.34 per share, and a re-rating catalyst such as earnings recovery or sector rotation into regional banks. Forward EPS guidance of $0.40-$0.41 for FY2026-27 provides the next data point to watch.
For readers looking to sharpen or challenge this analysis, three next steps follow:
For readers wanting to examine the underlying data before forming a view on the valuation case, our full coverage of the 1H FY2026 results walks through the $3.7 billion Challenger asset sale, the CET1 ratio movement to 11.18%, the loan impairment expense increase from $3 million to $20 million, and management commentary on the macroeconomic outlook that shapes the FY2026-27 earnings assumptions used in the models above.
This article is for informational purposes only and should not be considered financial advice. Investors should conduct their own research and consult with financial professionals before making investment decisions. Past performance does not guarantee future results. Financial projections are subject to market conditions and various risk factors.
The Dividend Discount Model (DDM) values a stock by dividing the expected annual dividend by the difference between the required rate of return and the expected dividend growth rate. Applied to BOQ using a $0.34 cash dividend, a 7% discount rate, and 2% growth, the base-case DDM produces a valuation of approximately $7.00 per share.
BOQ dividends are fully franked, meaning eligible Australian shareholders receive a 30% company tax credit alongside each cash dividend. When the grossed-up dividend of $0.50 (cash plus franking credits) is used as the DDM input instead of the $0.34 cash figure, the model produces a valuation of $10.57, which is more than 40% higher than the cash-only DDM result.
BOQ's 1H FY2026 results, released on 22 April 2026, showed net interest margin improving 10 basis points year-on-year to 1.67%, while cash earnings fell 4% to $176 million. Home lending grew 4% on the prior half and commercial lending grew 7% year-on-year.
As of May 2026, analyst consensus on BOQ sits at Sell, with 1 Buy, 7 Hold, and 6 Sell ratings across 14 covering analysts. The average price target is $6.38, only $0.17 above the $6.21 closing price recorded on 15 May 2026.
BOQ's price-to-book ratio of 0.71x means the market is pricing the stock below the net asset value on its balance sheet. This can indicate either a valuation opportunity or structural concerns about return on equity and earnings quality that standard valuation models do not fully capture.