Sonic Healthcare has shed approximately 30% of its share price since the end of FY25, placing its price-to-sales ratio at 1.03x against a five-year historical average of 1.94x. That gap, between where the market prices the stock today and where it has typically valued Sonic’s revenue stream, is the central question for ASX investors right now.
At a closing price of A$18.73 on 15 May 2026, the SHL share price sits materially below levels where major brokers held positive ratings in early 2025. The healthcare sector itself has compounded the problem, delivering annualised returns of -11.52% over five years versus 4.21% for the broader ASX 200. What follows is an analysis of what Sonic Healthcare actually does, why the share price has fallen as sharply as it has, how to read valuation signals like price-to-sales in proper context, and what more rigorous methods reveal about whether the current price represents a genuine opportunity or a value trap.
What Sonic Healthcare actually does and why its business model matters
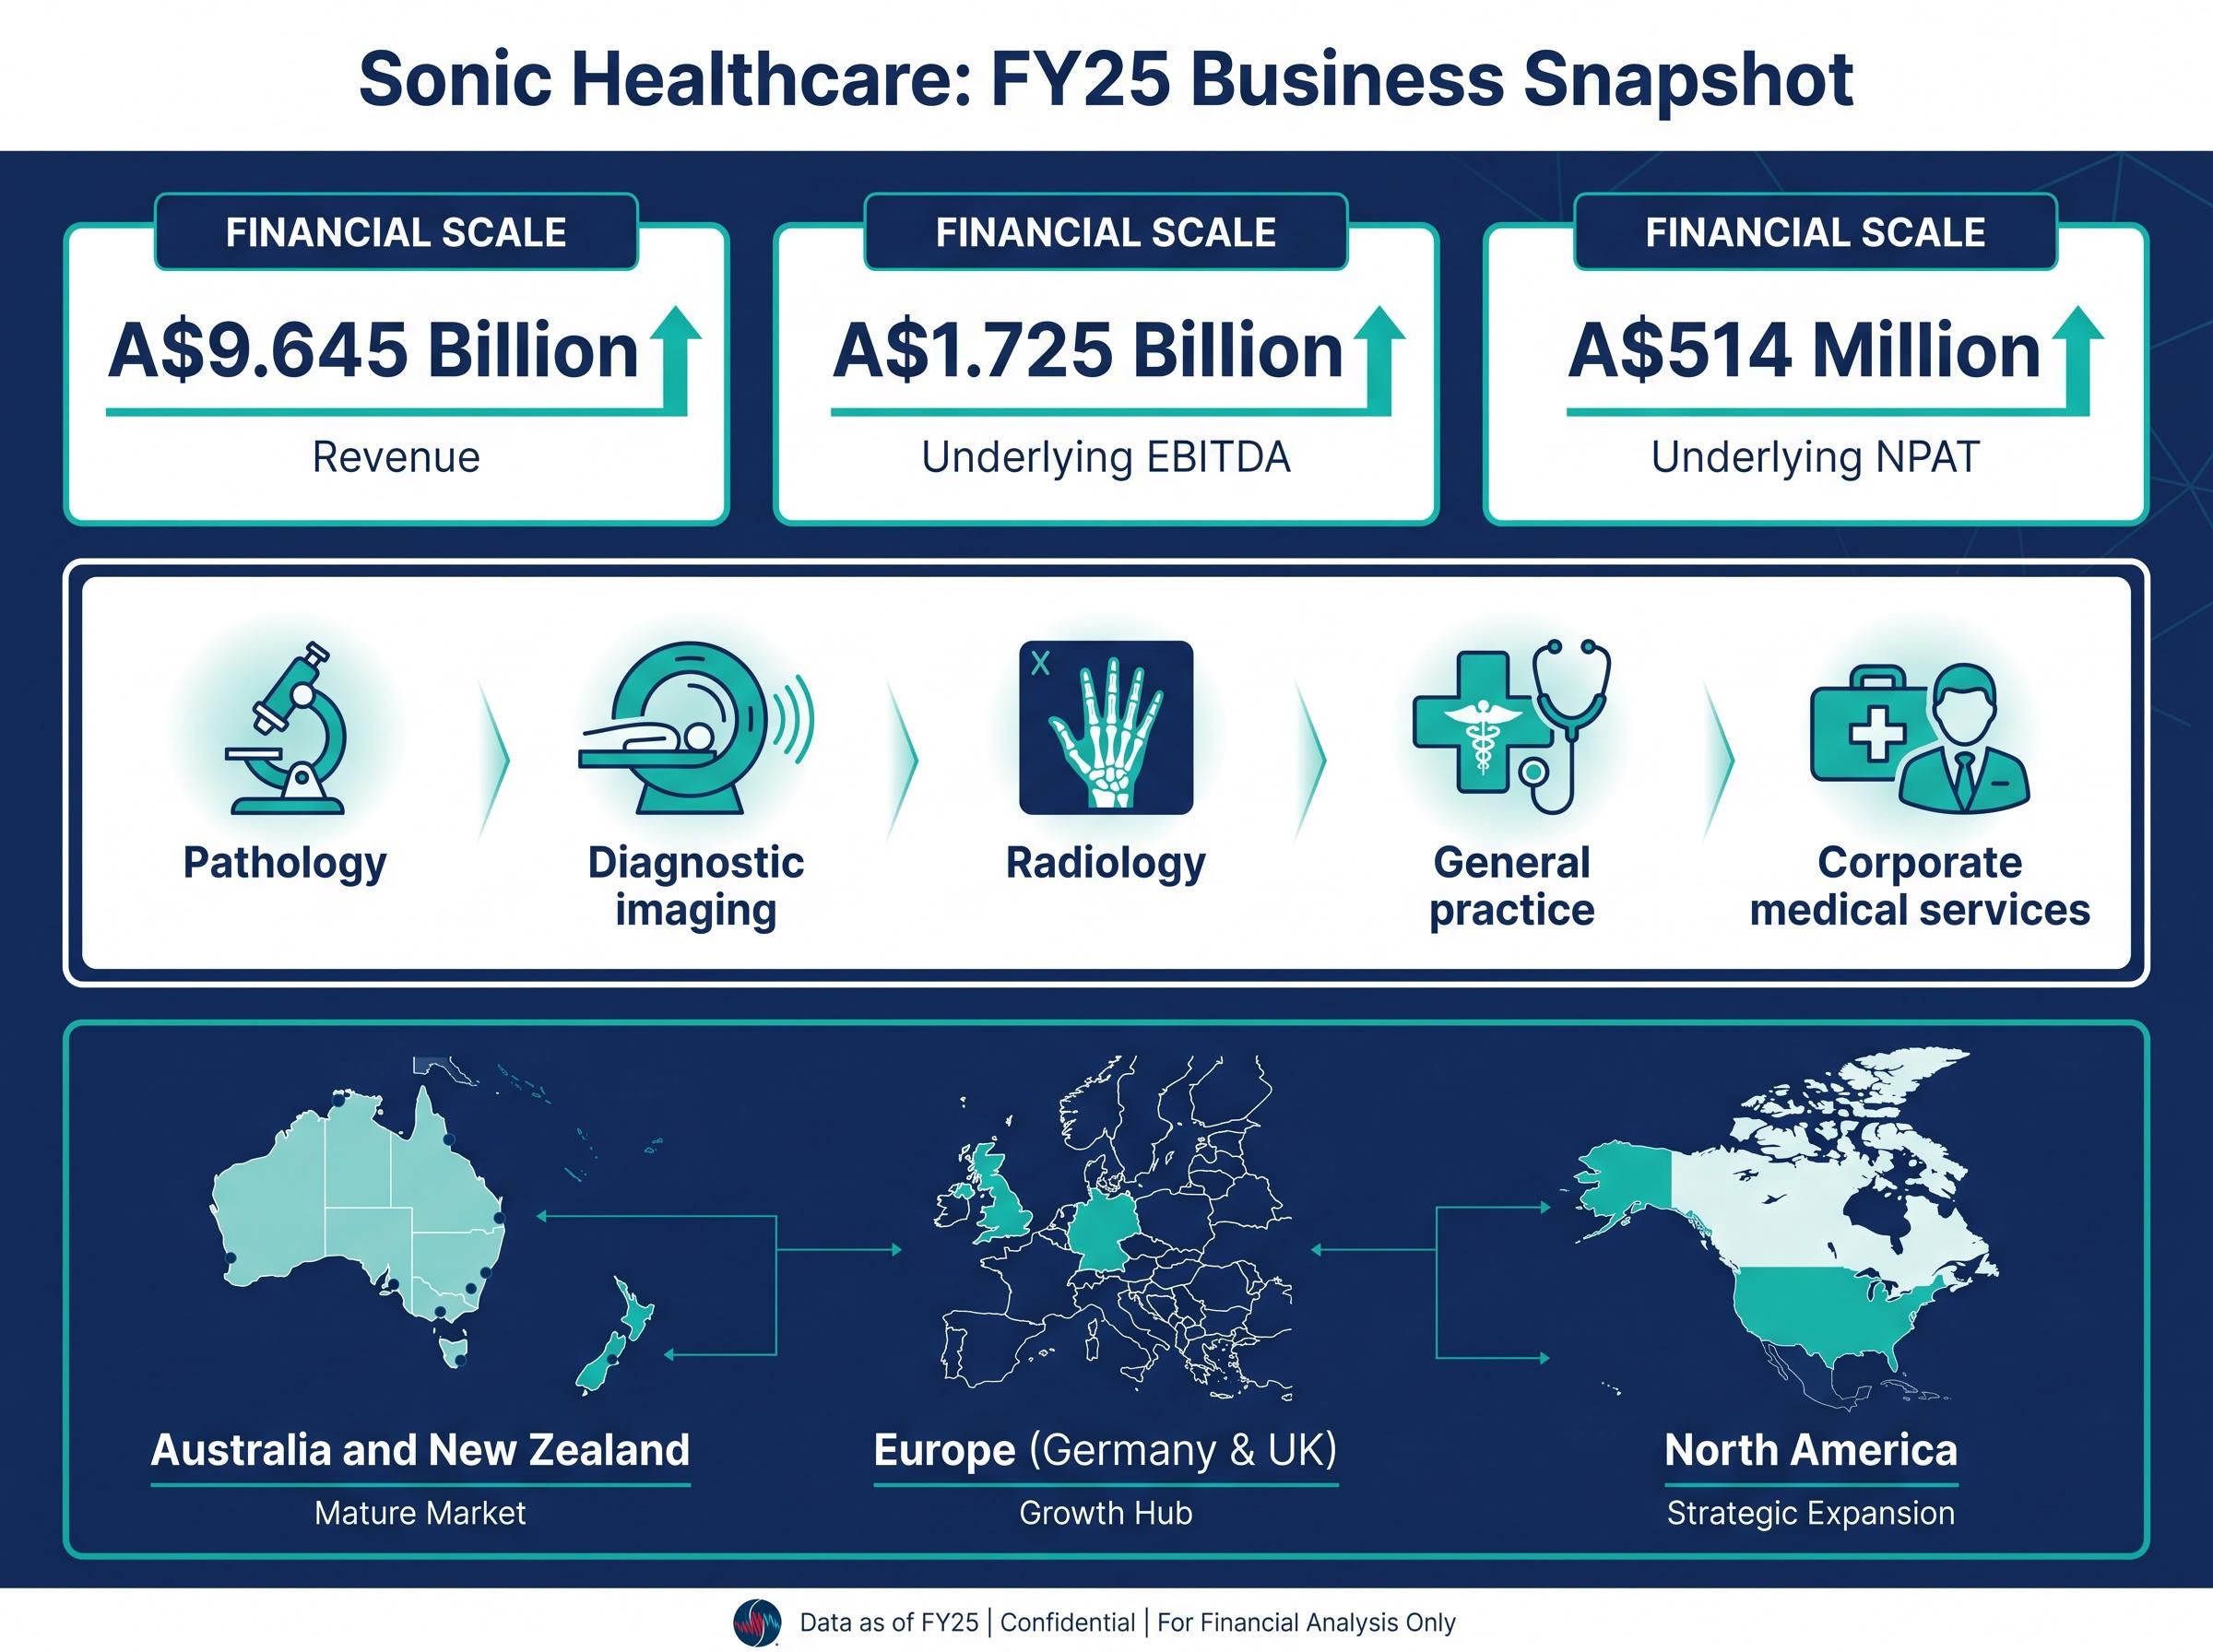
Before any valuation discussion is useful, the underlying business needs to be visible. Sonic Healthcare, listed on the ASX since April 1987, operates across five service categories:
- Pathology
- Diagnostic imaging
- Radiology
- General practice
- Corporate medical services
These are non-discretionary medical services. Patients and referring physicians do not defer diagnostic testing because equity markets are weak. That structural demand characteristic is what makes a 30% price decline analytically interesting rather than simply bad news.
Sonic’s geographic footprint spans:
- Australia and New Zealand
- Europe (including Germany and the United Kingdom)
- North America
In FY25, the company reported full-year revenue of A$9.645 billion, underlying EBITDA of A$1.725 billion, and underlying net profit after tax (NPAT) of A$514 million. A business generating A$9.6 billion in recurring revenue from medically necessary diagnostics is structurally different from a cyclical or speculative name. That distinction shapes how every data point in the sections that follow should be interpreted. It also introduces complexity: four currency zones, multiple regulatory regimes, and margin profiles that vary by geography.
When big ASX news breaks, our subscribers know first
Why the ASX healthcare sector has struggled and what that means for SHL
Sonic’s decline is not happening in isolation. The S&P/ASX 200 Healthcare Index (XHJ) has delivered annualised returns of -11.52% over five years, while the ASX 200 has returned 4.21% over the same period.
The ASX Healthcare Index has returned -11.52% per year over five years, versus 4.21% for the broader ASX 200: a performance gap of more than 15 percentage points annually.
Healthcare has long been considered defensive. Spending on medical services is non-discretionary, revenues are sticky, and the sector historically held up well through periods like the global financial crisis. The paradox is that those same defensive qualities have made healthcare stocks vulnerable in a rising interest rate environment. When bond yields climb, investors rotate away from low-growth, income-oriented equities, the so-called bond proxies, toward cyclical and resource names offering higher near-term returns. Sonic, as a consistent dividend payer with moderate earnings growth, fits squarely in that category.
The pressure on ASX healthcare’s defensive label has intensified through 2026 as four simultaneous headwinds, including AUD appreciation, rising interest rates, weakening US consumer sentiment, and FDA regulatory uncertainty, have compressed multiples across the sector in ways that a purely defensive business profile should theoretically resist.
The long-run case for global healthcare demand
The sector-wide de-rating sits against a structural backdrop that argues against permanent impairment. US healthcare expenditure is projected to reach approximately US$819 billion by 2027, growing at roughly 7% annually. Healthcare IT and software-as-a-service (SaaS) sub-sectors are forecast to grow revenue at more than 15% per year from 2024 to 2030. A 2024 Morgan Stanley survey found that more than half of investors planned to increase sustainable investment allocations, a trend that favours healthcare exposure over time.
None of this resolves the short-term pricing pressure. But it does establish that the market’s current valuation of healthcare names, Sonic included, reflects cyclical rotation dynamics rather than a permanent reassessment of demand for diagnostic services.
The specific reasons SHL shares have fallen approximately 30%
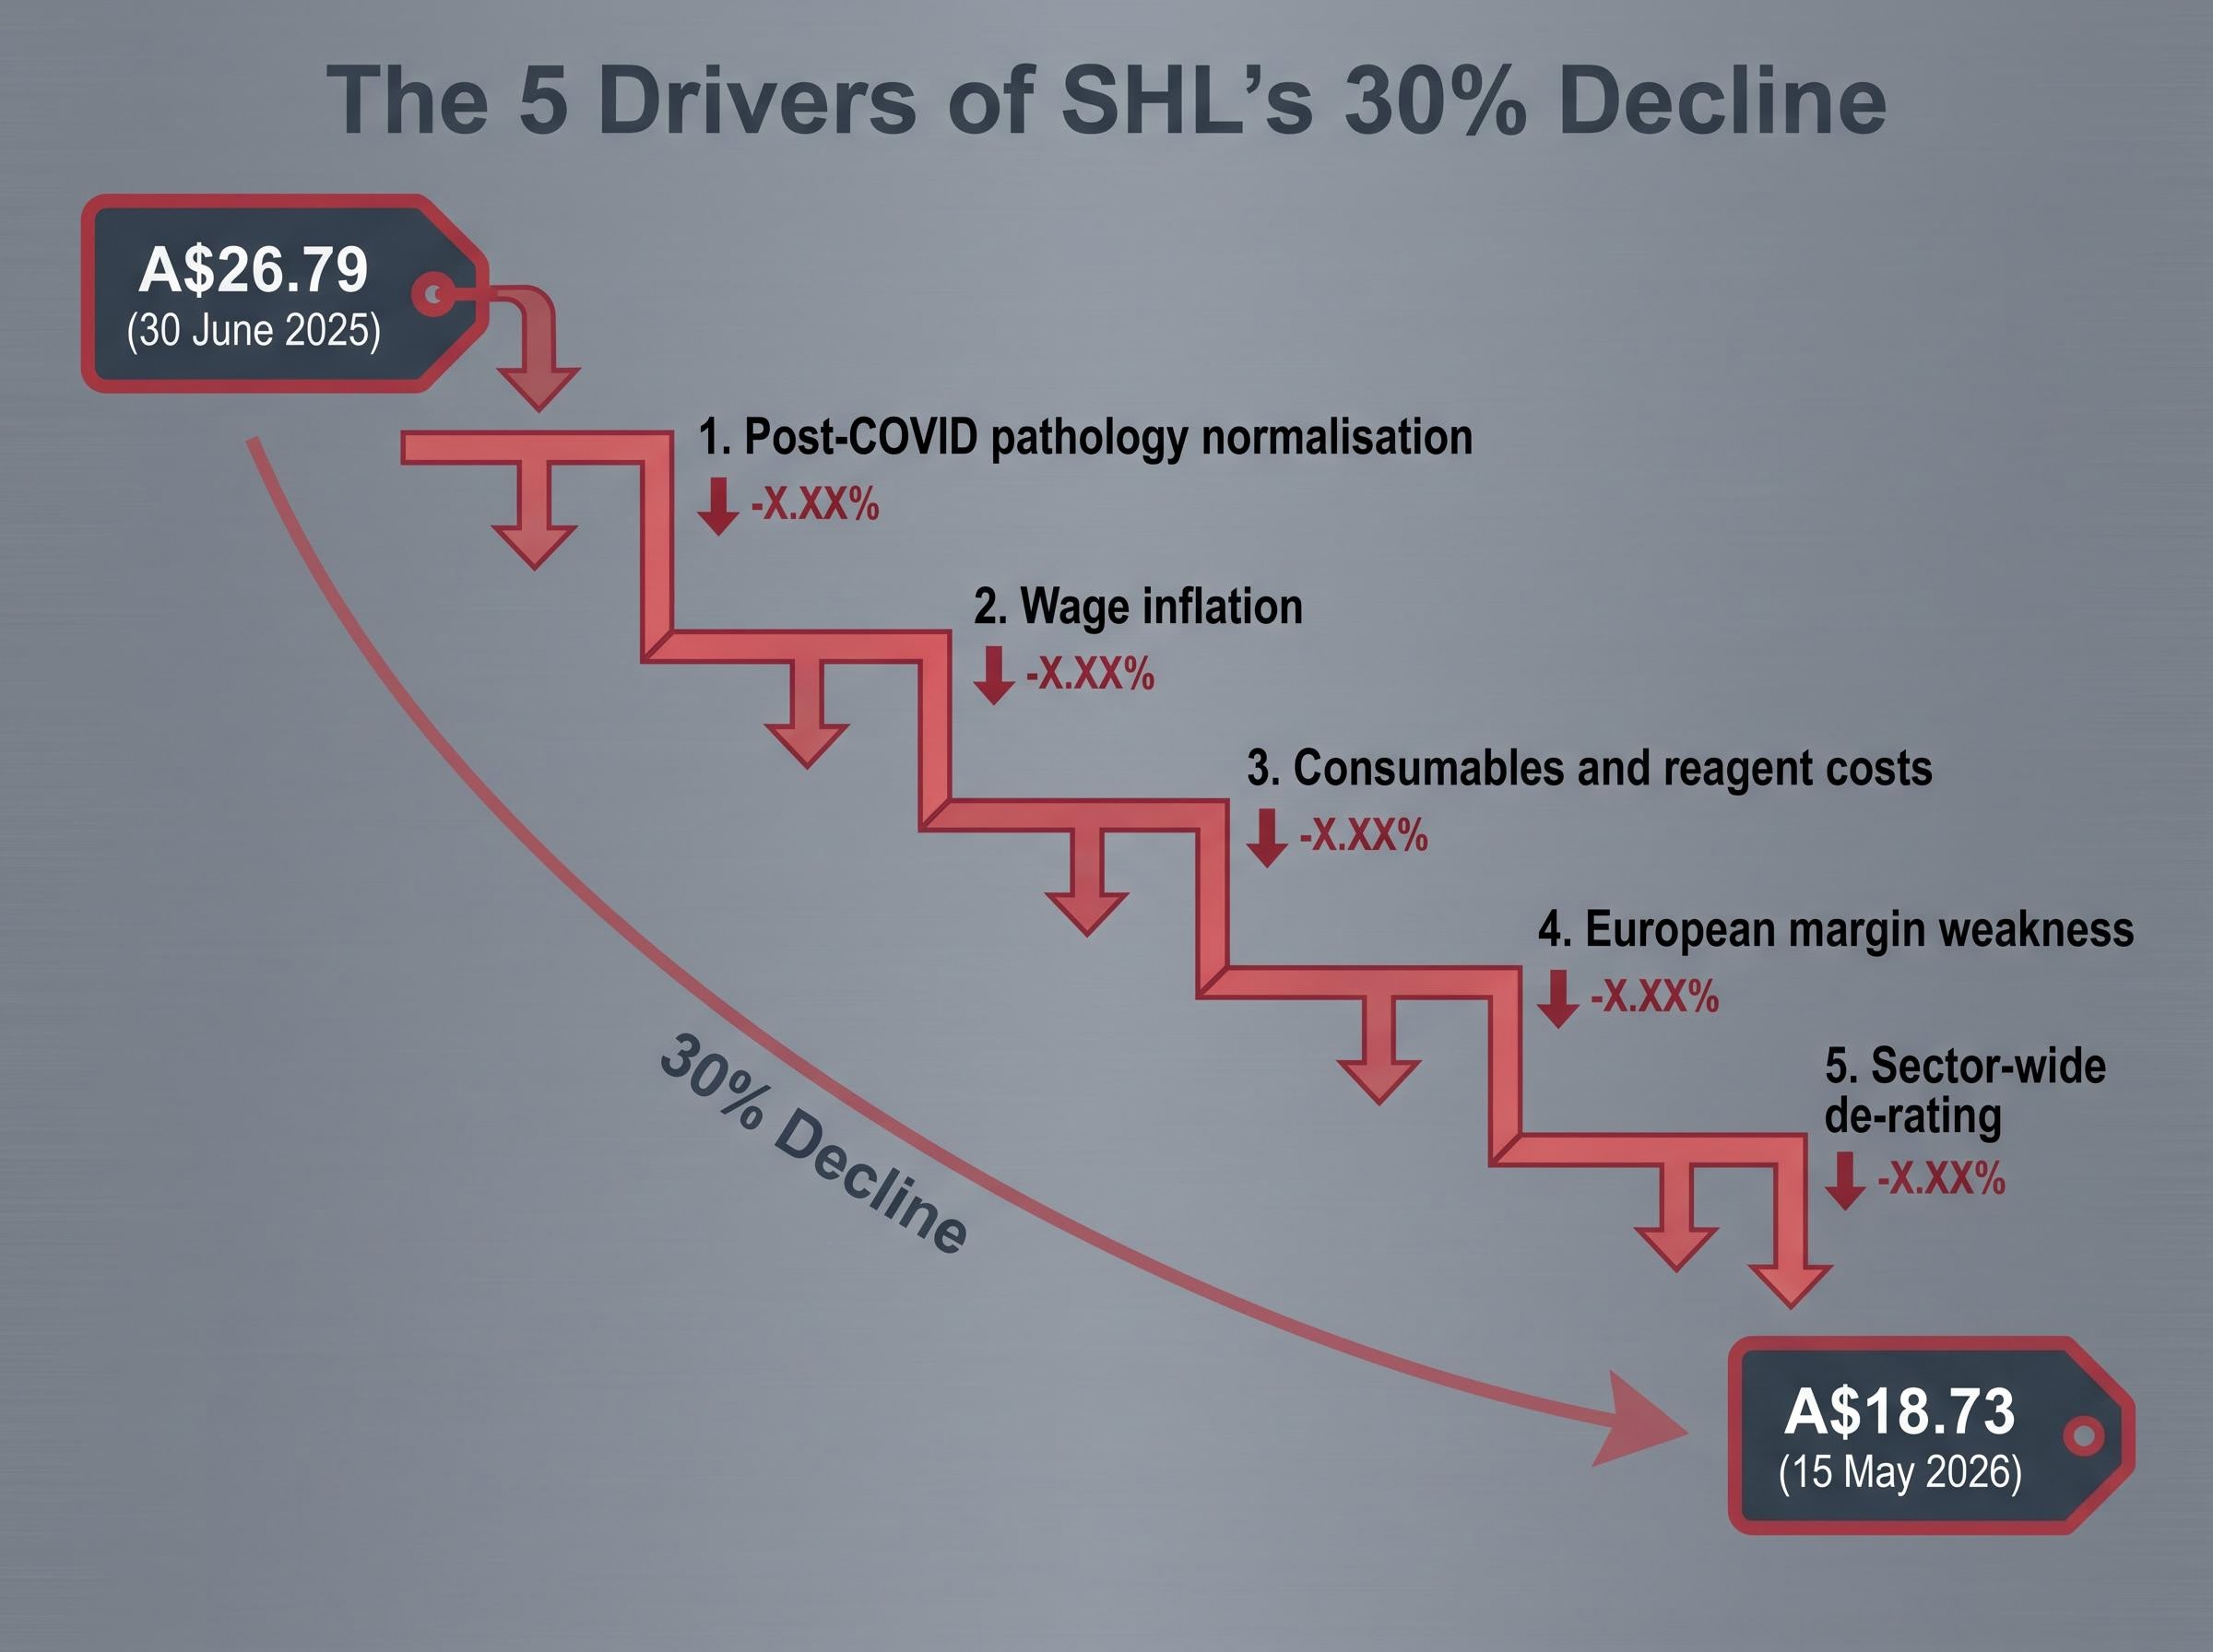
From the FY25 year-end close of A$26.79 on 30 June 2025 to A$18.73 on 15 May 2026, Sonic Healthcare shares have fallen approximately 30%. No single event explains the decline. Five distinct drivers have layered on top of one another:
- Post-COVID pathology normalisation: COVID testing revenue has largely disappeared, creating an earnings gap versus FY21-22 peaks that the market has been repricing across several reporting periods.
- Wage inflation: Laboratory staff and pathologist wages in Australia and Europe have been running above CPI, compressing margins from the cost side.
- Consumables and reagent costs: Higher prices for laboratory reagents and consumables have added to the cost pressure, a factor Macquarie explicitly cited in its March 2025 note when trimming FY25-26 earnings-per-share forecasts by approximately 3-5%.
- European margin weakness: Operations in Germany and the United Kingdom have faced margin pressure from competitive tendering and payor pricing constraints, alongside FX headwinds from a stronger AUD against the EUR and GBP.
- Sector-wide de-rating of defensive income stocks: The broader rotation away from bond-proxy equities in a higher-rate environment has amplified every stock-specific earnings concern.
The Australian Government pathology funding reforms announced in the 2024-25 Budget reintroduced annual indexation for a subset of Medicare Benefits Schedule pathology services and adjusted COVID-19 testing arrangements, changes that directly affect the reimbursement environment underpinning Sonic’s Australian operations.
Broker price targets from early 2025 ranged from A$27 to A$31, with all three major ratings skewed positive, yet the stock has since fallen to A$18.73. All targets pre-date the current price level and should be treated as stale.
Morgans held an Add rating with a A$31 target in February 2025. Macquarie rated the stock Outperform at A$27 in March 2025. UBS maintained a Neutral rating with a A$28 target in April 2025. No public broker notes post-dating May 2025 have been located. The gap between those targets and today’s price is striking, but without updated consensus, it is a gap that cannot yet be interpreted.
Identifying whether this decline reflects permanent earnings impairment or temporary cyclical pressure is the judgment call that matters. Each driver listed above carries a different implication for recovery probability. The post-COVID normalisation is largely a one-time re-basing. Wage and consumables inflation may prove persistent. The sector rotation could reverse if rate expectations shift. Each thread requires separate assessment.
US policy disruption in ASX healthcare adds a layer of structural risk that sits beneath the wage inflation and FX headwinds already weighing on Sonic: FDA approval instability under the current commissioner and declining vaccination rates linked to the HHS policy reorientation are raising the discount rate investors apply to globally exposed healthcare businesses in ways that have no natural cyclical reversal point.
Why a single valuation metric is not enough to assess SHL at current prices
Many investors will have encountered the price-to-sales ratio as a starting point. The price-to-sales (P/S) ratio divides a company’s market capitalisation by its annual revenue, producing a multiple that shows how much investors are paying per dollar of sales. It is a blunt instrument: it takes no account of margins, debt levels, or the quality of earnings.
At A$18.73, Sonic’s P/S ratio sits at 1.03x, against a five-year average of 1.94x. That compression is notable for a specific reason: Sonic’s revenue has grown over the preceding three years. The P/S decline is driven primarily by the share price falling, not by a revenue collapse. When a valuation multiple compresses because the numerator (price) drops while the denominator (revenue) holds or grows, it is a signal worth investigating further, not a conclusion in itself.
| Metric | Current Reading | Historical Average (5-Year) | What It Signals |
|---|---|---|---|
| Price-to-Sales Ratio | 1.03x | 1.94x | Market paying roughly half the historical rate per dollar of Sonic revenue |
| Implied Fully Franked Yield (FY24 total dividends) | ~5.7% (at A$18.73) | Lower yield at higher prices | Yield materially higher than when brokers described dividend as “attractive” |
The P/S ratio alone, however, cannot answer whether Sonic is undervalued. A company with declining margins could trade at a low P/S for good reason. The metric ignores cost structure entirely.
SHL’s net debt and return on equity add important context to the P/S compression story: the company carries approximately A$3.87 billion in net debt alongside a return on equity of just 6.8%, meaning capital is not compounding efficiently at current profitability levels without meaningful margin recovery, a constraint the P/S ratio cannot surface.
Beyond Price-to-Sales: Deeper Valuation Approaches
A discounted cash flow (DCF) analysis projects a company’s future free cash flows and discounts them back to a present value, estimating what those future earnings are worth in today’s dollars. A dividend discount model (DDM) does something similar but focuses specifically on future dividend payments, making it particularly relevant for a consistent dividend payer like Sonic.
With a fully franked FY24 total dividend of 106 cents per share and a payout ratio brokers characterised at approximately 70-80% of underlying NPAT, the DDM framework has direct applicability. At A$18.73, the implied fully franked yield is materially higher than at the A$23-A$27 range where brokers assessed the dividend as sustainable and attractive in early 2025.
Both methods require assumptions about earnings growth, discount rates, and dividend sustainability that cannot be verified without current broker consensus data, which is not publicly available as at 16 May 2026. They are the right tools; they simply need updated inputs.
What the structural positives and key risks look like at the current price
At A$18.73, the investment case for Sonic Healthcare contains genuine positives and genuine risks. Presenting both with equal weight is the only honest analytical approach when the information landscape is incomplete.
| Structural Positives | Key Risks |
|---|---|
| Materially higher implied fully franked yield than prior broker assessments | Ongoing wage and consumables cost inflation compressing margins |
| Recurring, non-discretionary revenue base (FY25 revenue: A$9.645 billion) | European margin weakness, particularly in Germany and the UK |
| Geographic diversification across four regions | Potential for further sector de-rating if bond yields remain elevated |
| Ongoing bolt-on acquisition pipeline and cost-efficiency programmes | Slow base-business volume recovery in pathology post-COVID |
| FY25 underlying NPAT of A$514 million; EBITDA of A$1.725 billion | FX headwinds from AUD strength against EUR, GBP, and USD |
The Macquarie, Morgans, and UBS ratings (Outperform, Add, and Neutral respectively) were all published before the current price level and should not be treated as current guidance.
No H1 FY26 results have been publicly verified as at 16 May 2026. Investors should consult Sonic Healthcare’s ASX announcements page before drawing conclusions.
That data gap is material. Investors considering the stock at A$18.73 are making decisions without the most recent half-year earnings confirmed. The structural positives, a A$9.6 billion revenue base, fully franked dividends, and non-discretionary demand, remain intact on the available evidence. But “available evidence” is the operative phrase. The H1 FY26 results, expected to have been released around February 2026, would reveal whether cost pressures have stabilised, whether European margins have improved, and whether the base-business pathology recovery has gained traction.
A 30% decline demands better evidence, not a faster decision
The compression of Sonic Healthcare’s P/S ratio to 1.03x against a 1.94x five-year average is notable. The fully franked yield at A$18.73 is materially improved relative to any recent historical entry point. Structural demand for diagnostic services is intact, supported by ageing populations and rising global healthcare expenditure.
But the absence of verified H1 FY26 results and current broker consensus means the investment case rests on incomplete information. A serious assessment requires specific steps:
- Check the Sonic Healthcare ASX announcements page for the H1 FY26 results release.
- Consult the Investor Relations “Analyst Coverage” page for current broker targets and ratings.
- Apply DCF or DDM analysis to updated earnings and dividend estimates.
- Assess dividend sustainability at the current earnings trajectory, particularly given the 70-80% payout ratio against potentially compressed NPAT.
Price dislocations of this magnitude in defensive, recurring-revenue businesses do historically create opportunities. They also reflect the market processing information that the individual investor may not yet have. The question is not whether A$18.73 is cheap. The question is whether the evidence required to act on that cheapness is available yet.
Pathology sector funding pressures are not unique to Sonic: Healius, Sonic’s closest domestic competitor, flagged in May 2026 that the Federal Budget delivered no new pathology funding, leaving the sector under an indexation freeze, while Fair Work Commission wage rulings add approximately A$1.8 million in additional costs from April 2026 with further phased increases extending through to 2031.
This article is for informational purposes only and should not be considered financial advice. Investors should conduct their own research and consult with financial professionals before making investment decisions. Past performance does not guarantee future results. Financial projections are subject to market conditions and various risk factors.