Woolworths’ 4% Dividend Yield: Opportunity or a Warning Signal?
12 mins ago
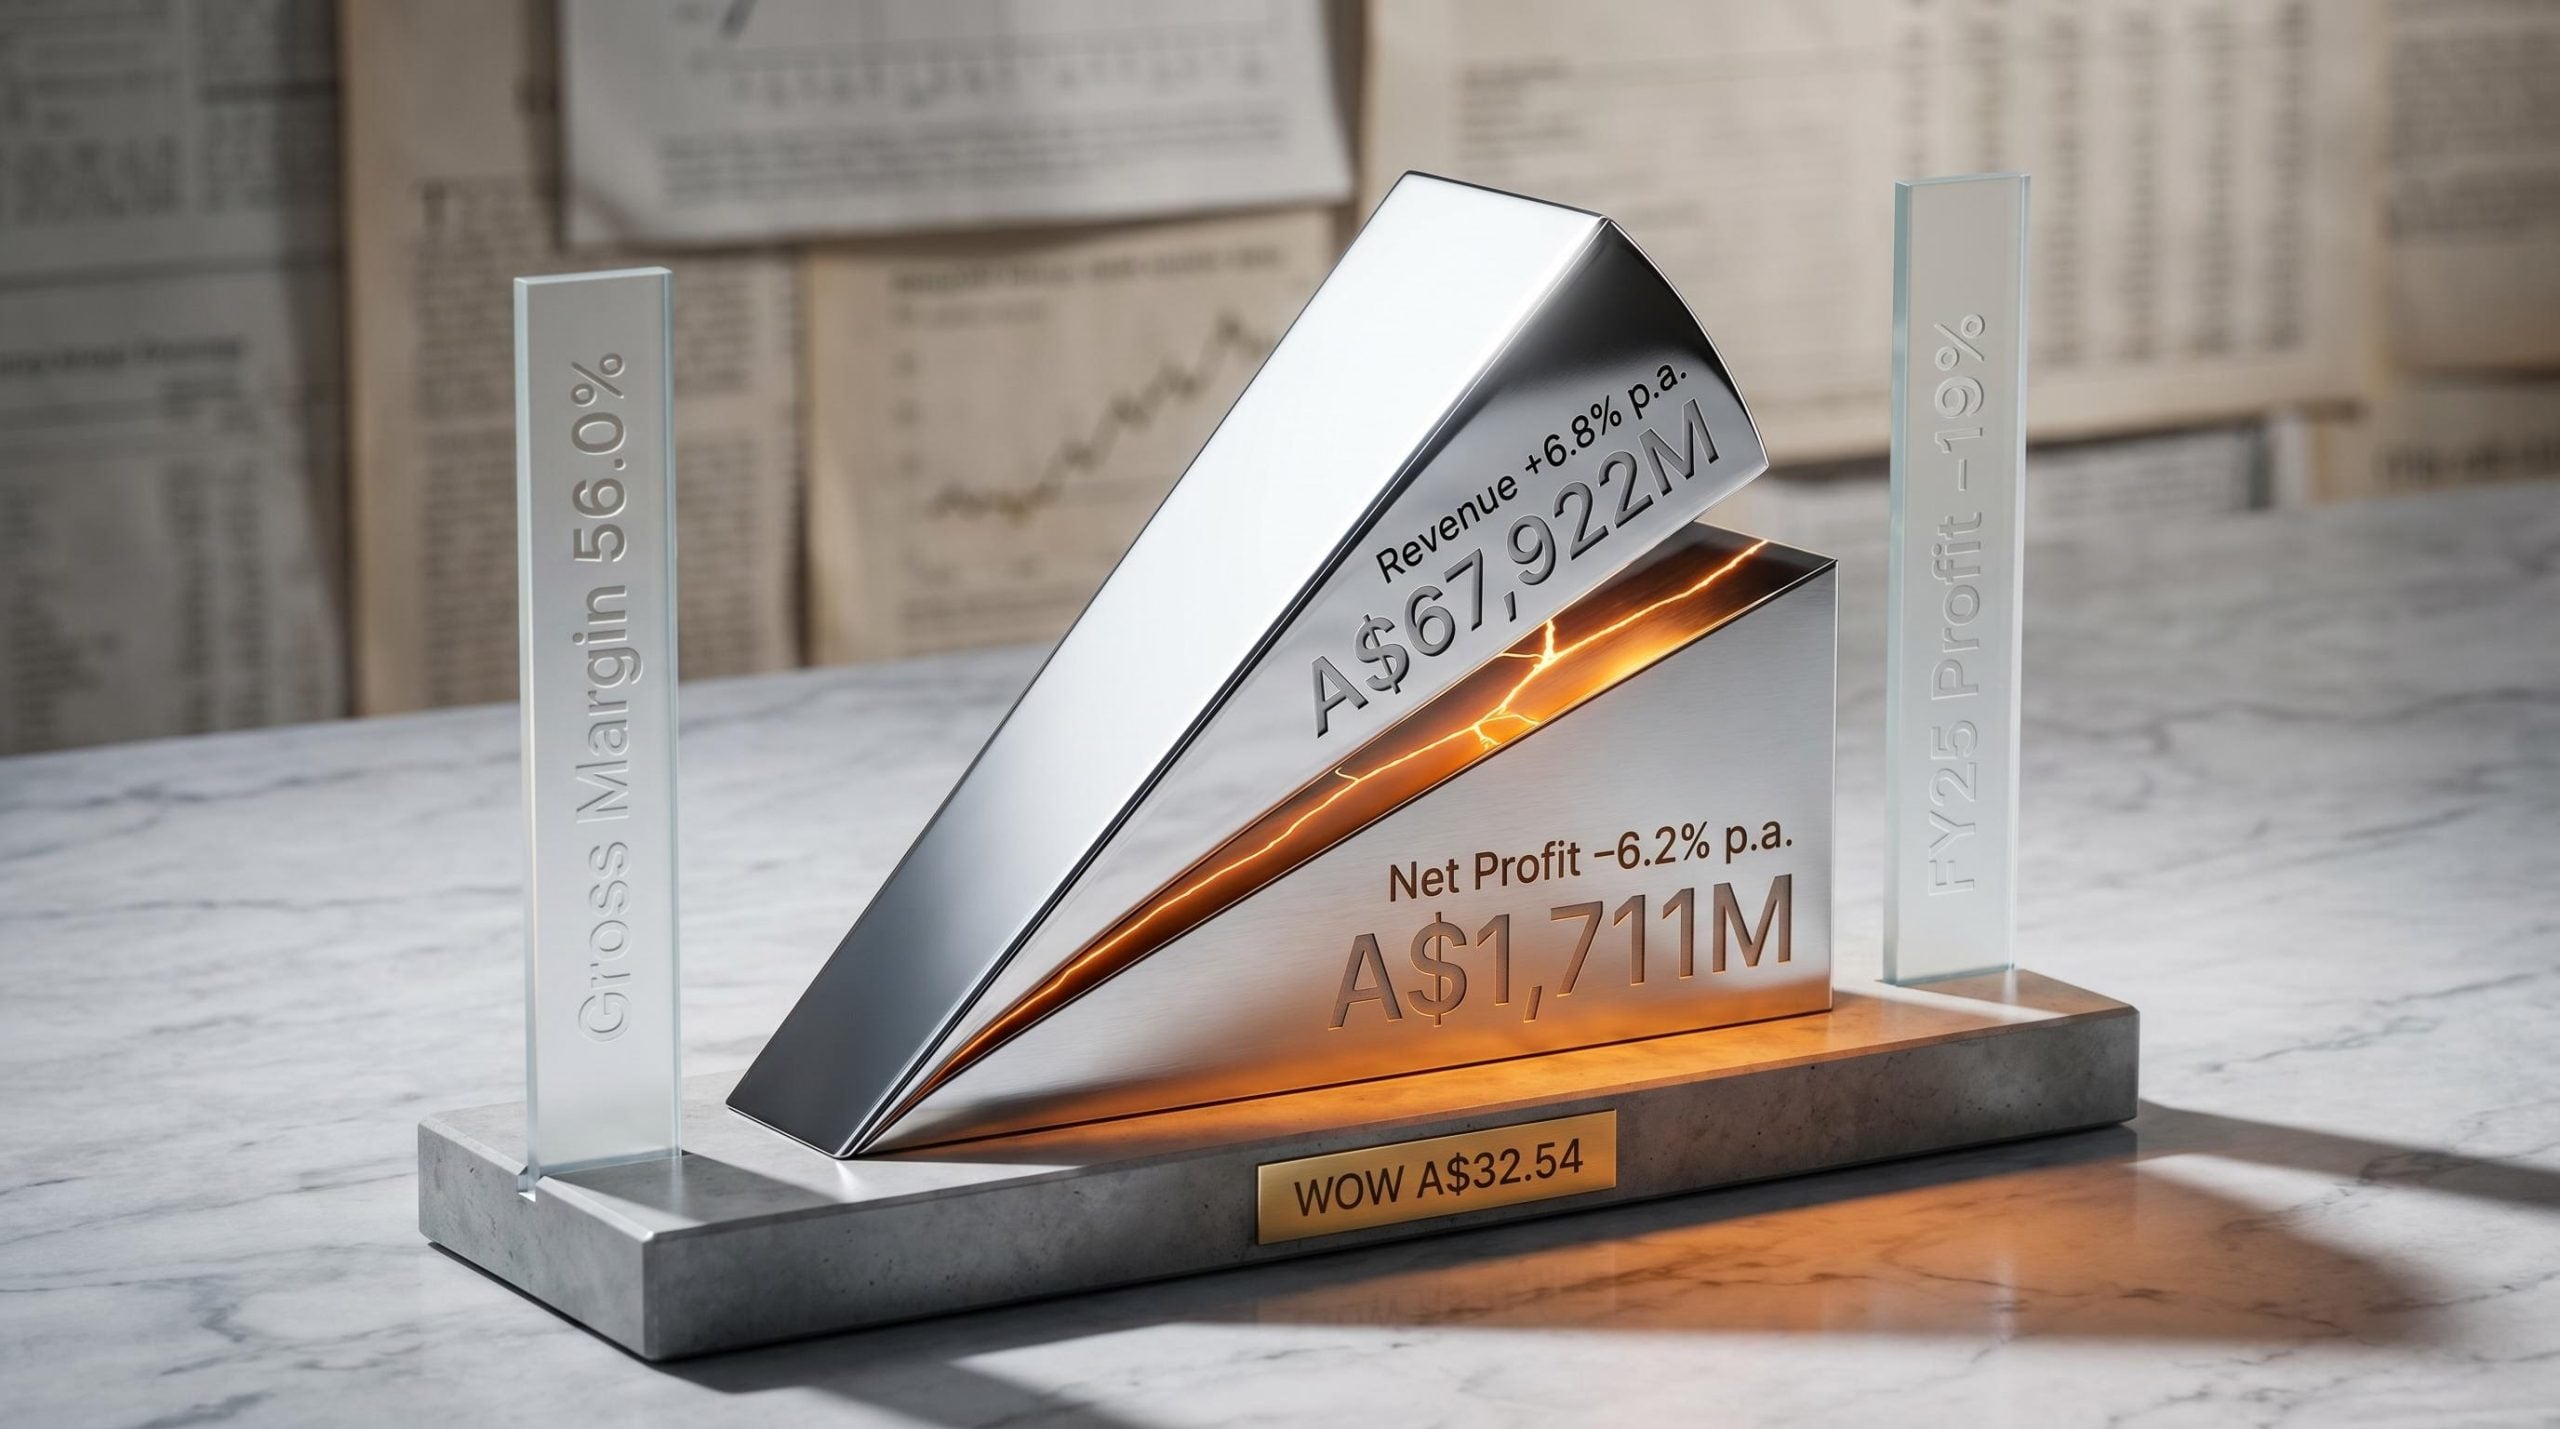
Woolworths Group has grown annual revenue at 6.8% per year for three consecutive years. Over the same period, net profit has contracted at negative 6.2% per annum. That divergence, not the share price chart, is the signal that defines the current investment case for WOW. With the stock trading at A$32.54 as of mid-May 2026 and broker consensus placing fair value at approximately A$33.50, Woolworths is priced near the upper boundary of what analysts consider reasonable. A 19% full-year profit slump in FY25 has reset the earnings base materially lower. This analysis unpacks the specific cost pressures compressing margins, explains how to read the headline financials in context, and assesses what the current valuation implies for investor risk and return. The goal is a framework for evaluating Woolworths’ fundamentals, not just its share price movement.
The numbers tell the story before any interpretation is needed.
“Net profit has compounded at negative 6.2% per annum over three years while revenue grew at 6.8%.”
The FY25 profit decline of 19% represents the most acute deterioration in this three-year window. Revenue growth without corresponding profit growth can signal structural cost problems rather than a temporary blip. For investors relying on top-line momentum as a positive indicator, the profit trajectory tells a materially different story.
That gap between revenue and profit is the central analytical question. The rest of this analysis explains what is driving it, why it may persist, and what it means for the stock at current prices.
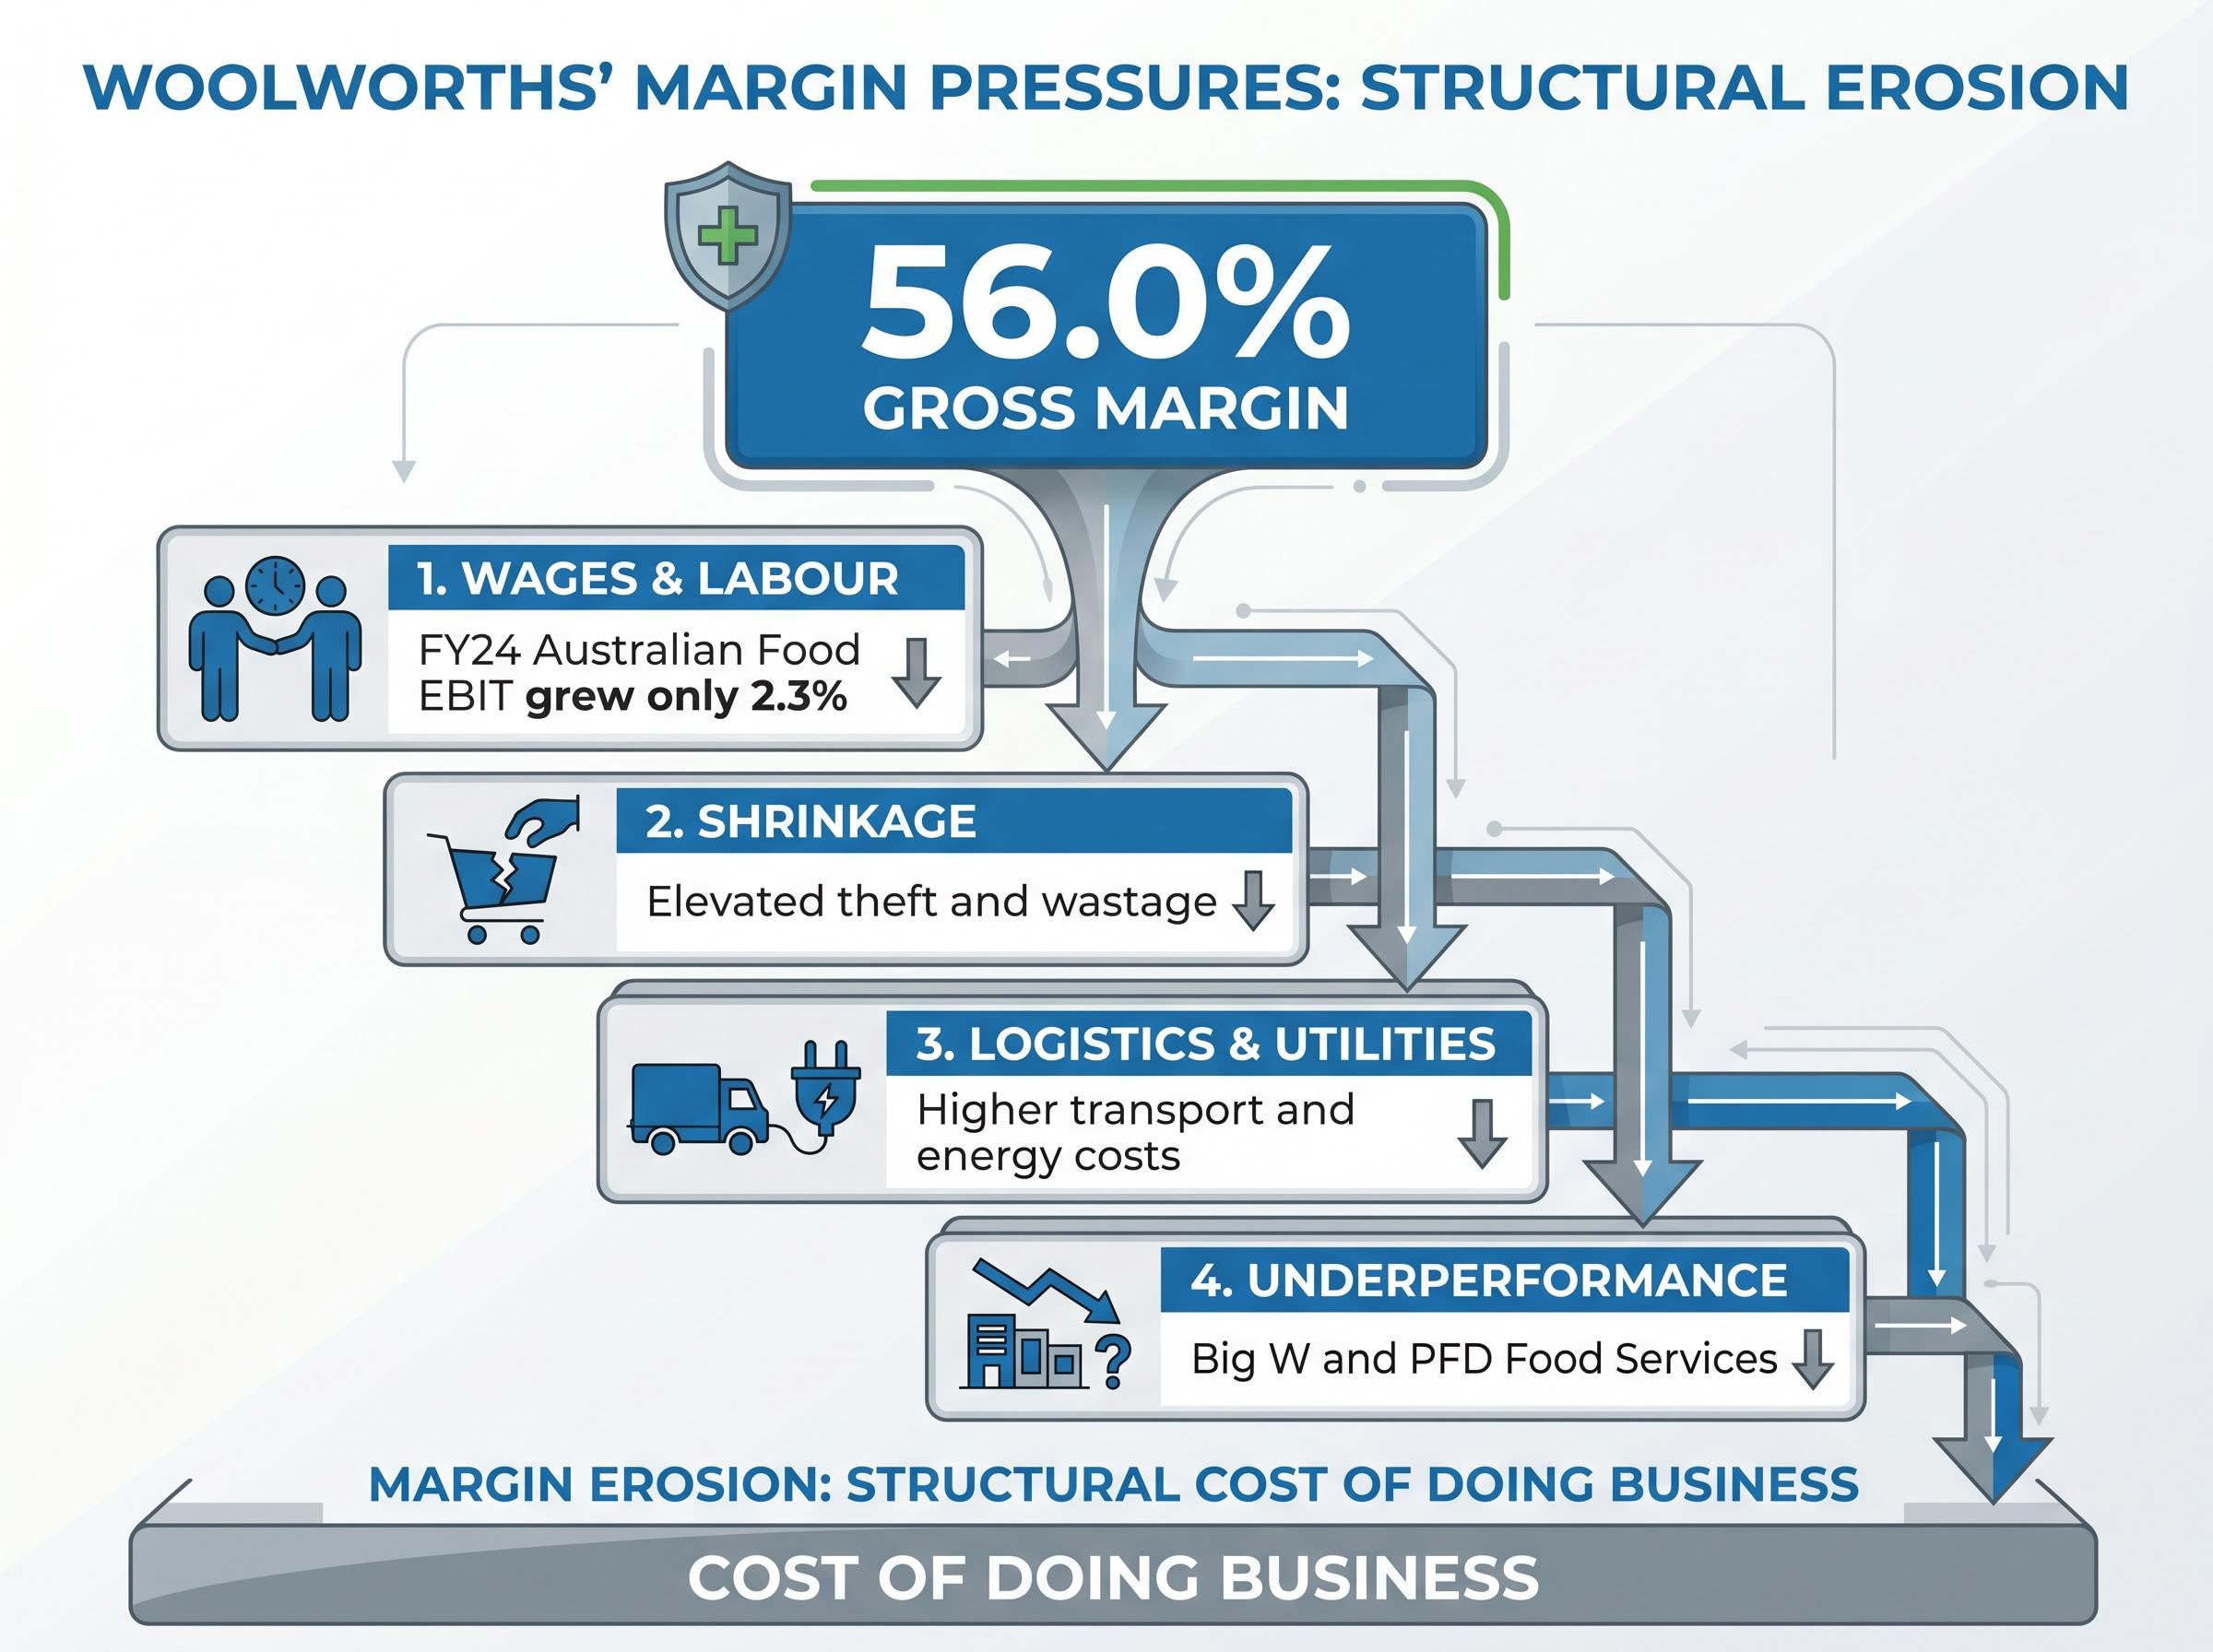
The margin compression is not one problem. It is several, reinforcing each other simultaneously, and the order of magnitude matters.
The New Zealand Food segment impairment of approximately NZ$1.6 billion (roughly A$1.5 billion) was the dominant statutory profit headwind in 1H FY24. This was a non-cash, non-recurring item that distorted statutory net profit after tax (NPAT) but does not represent an ongoing cost drag.
The distinction matters. The recurring margin headwinds, wages, shrinkage, and utilities, persist regardless of the impairment. Stripping out the one-off does not resolve the underlying picture.
Woolworths’ gross margin of 56.0% looks healthy at first glance. Gross margin measures the difference between revenue and the direct cost of goods sold, essentially capturing product-level profitability before rent, wages, energy, logistics, and other overhead costs are deducted.
Net profit margin, by contrast, reflects what remains after all those costs. When CODB growth outpaces sales growth, the gap between a healthy gross margin and a shrinking net profit widens. That is precisely the dynamic playing out at Woolworths.
“A 56% gross margin looks healthy until you see that cost-of-doing-business growth is eroding all the headroom between the product and the bottom line.”
| Metric | WOW Figure |
|---|---|
| Revenue growth (3-year CAGR) | 6.8% |
| Gross margin (current) | 56.0% |
| Net profit growth (3-year CAGR) | Negative 6.2% |
Australian Food EBIT growing at only 2.3% in FY24 despite solid sales growth illustrates this mechanism in practice. Revenue figures can be a misleading primary indicator for companies operating in high-volume, low-margin categories like grocery, where the overhead cost base is large relative to the product margin.
Investors who can identify CODB growth as the separating factor between gross margin and net margin are better equipped to avoid over-relying on top-line revenue signals, not just for Woolworths but across any ASX company operating with a similar cost structure.
The income statement tells one story. The balance sheet adds a dimension of risk the revenue-versus-profit framing alone does not surface.
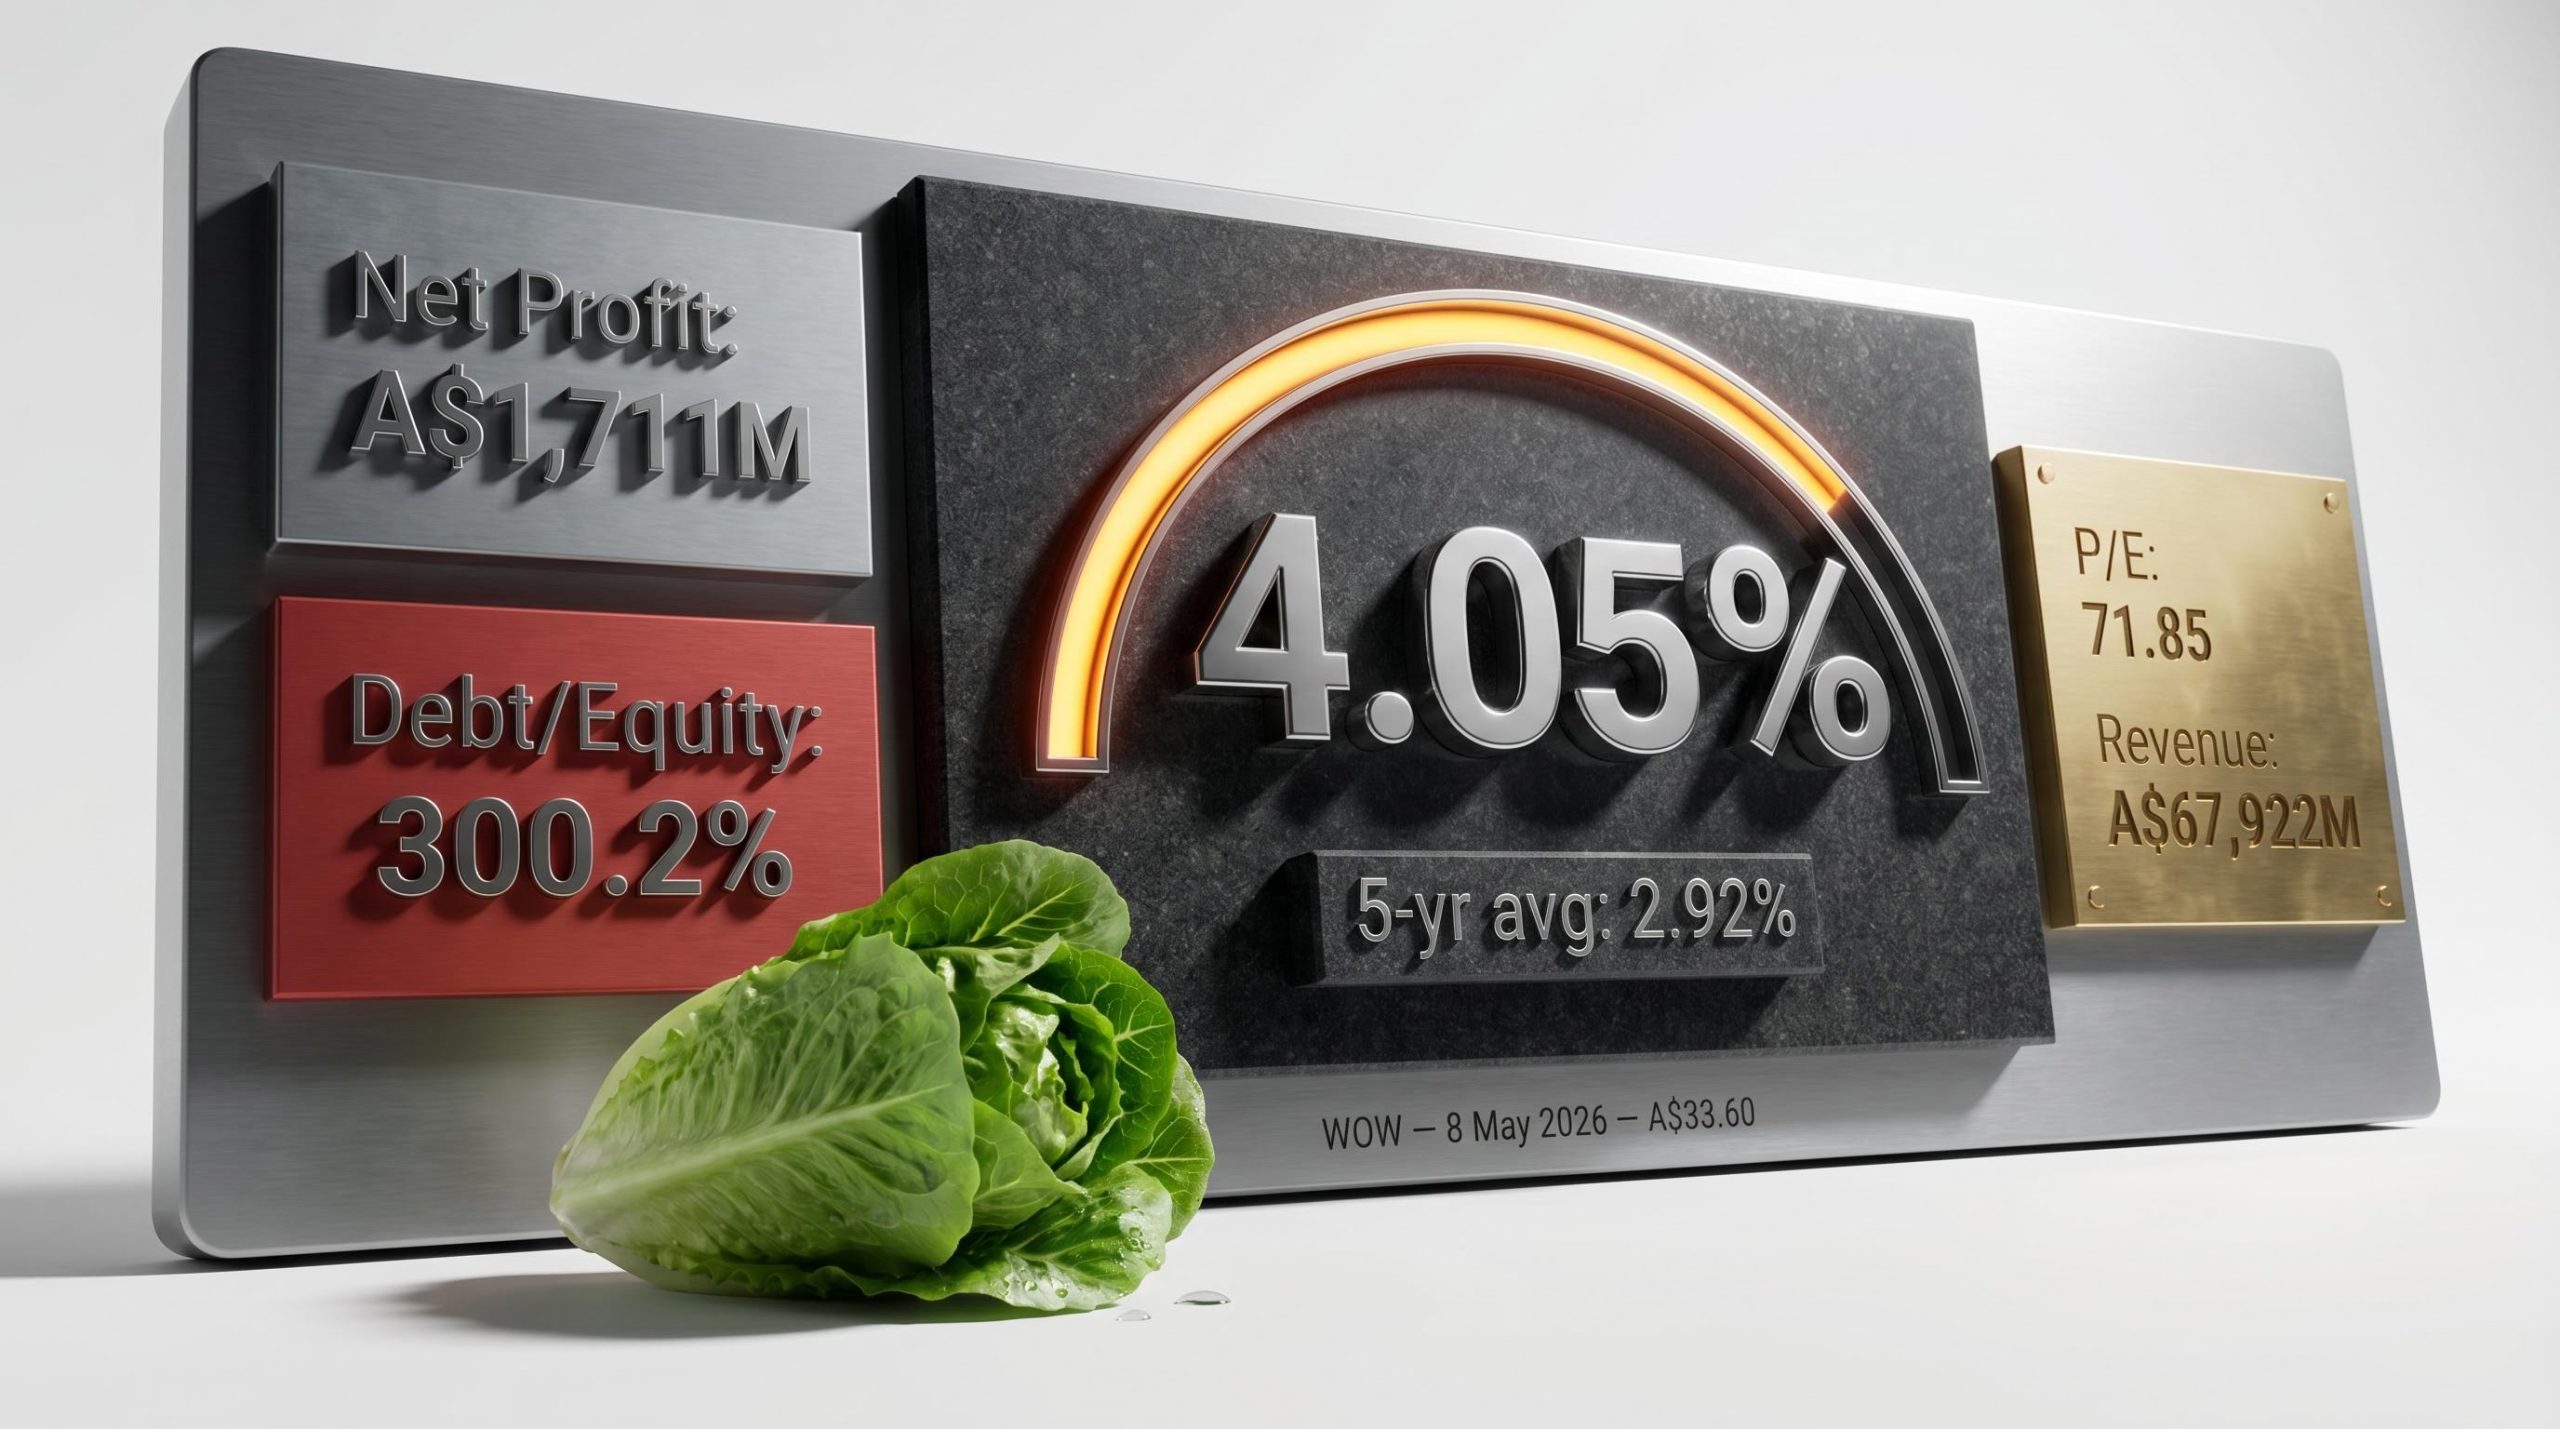
The distinction between dividend yield and total return matters acutely here: a yield that has risen from 2.92% to 4.37% because the share price has declined is a fundamentally different income proposition from one driven by genuine dividend growth, and conflating the two leads investors to misread the income opportunity.
| Metric | WOW Figure |
|---|---|
| Net debt | A$15,424 million |
| Debt-to-equity ratio | 300.2% |
| Return on equity (FY24) | 1.9% |
| Dividend yield (current vs. 5-year avg) | 4.37% vs. 2.92% |
A return on equity of 1.9% signals poor capital efficiency. When a stock is priced near broker consensus fair value, that figure warrants scrutiny.
Total FY24 ordinary dividends came to 103 cents per share (46 cents interim, 57 cents final), fully franked, with the payout ratio toward the upper end of the group’s target range. The interim FY25 dividend has already been trimmed to 45 cents per share, consistent with a more cautious capital allocation stance following the 19% profit slump.
Woolworths’ EBIT trajectory tells the leverage story most directly: interest coverage has declined from 4.5x to 3.4x in a single year, and with net gearing now at 324.7%, the earnings headroom available to sustain the current dividend is narrower than the headline yield figure suggests.
“WOW’s current yield of 4.37% sits well above its five-year average of 2.92%, but with profits falling 19% in FY25, the sustainability of that payout is a legitimate question.”
The Endeavour Group divestment raised approximately A$851 million across two tranches in 2024, simplifying the group and raising capital for balance sheet management. That capital event, however, does not resolve the structural earnings pressure that will determine whether the current dividend level can be maintained.
Even if Woolworths’ internal efficiency programmes deliver, the external environment constrains how much margin recovery is realistically achievable.
ACCC pricing conduct proceedings against Coles, which resulted in a Federal Court finding of misleading promotional timing even as the price increases themselves were ruled commercially justifiable, illustrate the precise regulatory ceiling that constrains both supermarket operators from using promotional pricing as a margin recovery lever.
The ACCC Supermarkets Inquiry final report, published in February 2025, recommended pricing transparency improvements and supplier codes of conduct as its central remedies, stopping short of structural penalties but signalling that regulatory oversight of supermarket pricing practices will remain active in the years ahead.
These dynamics mean that margin recovery depends primarily on cost reduction rather than revenue yield improvement. Cost reduction at the scale required is harder to execute, particularly when wage costs are structurally higher and shrinkage remains elevated. Investors weighing a recovery thesis need to account for these constraints as structural features of the operating environment, not temporary headwinds.
At A$32.54 (as of 14 May 2026), Woolworths trades close to the broker consensus target of approximately A$33.50, implying roughly 3% price upside from current levels. The stock has declined approximately 10.6% year-to-date. Hold ratings dominate the broker consensus as of May 2026, with several brokers having trimmed ratings citing the disconnect between resilient sales and softer profit trends.
“At A$32.54 with a broker consensus target of A$33.50, WOW offers approximately 3% price upside. The question is whether that margin compensates for ongoing earnings uncertainty.”
HY26 NPAT rose approximately 16.4% on the prior corresponding period, providing a tentative positive signal. That recovery, however, is measured against a depressed FY25 base following the 19% profit slump, and a single half-year result does not confirm a sustained earnings turnaround.
Before making a position decision, investors may consider evaluating three factors:
Institutional investors including Morningstar Investment Management and Franklin Templeton have been building the contrarian case for consumer staples at current valuations, with the thesis resting on distinguishing cyclical headwinds from structural impairment, a distinction the analytical framework in this article is designed to help individual investors apply.
If the answer to all three remains uncertain, the limited valuation buffer at current prices becomes a material risk rather than a buying opportunity.
Revenue growth of 6.8% per annum alongside profit contraction of negative 6.2% per annum is the defining tension in any Woolworths investment thesis. Structural cost pressures from wages, shrinkage, and utilities remain unresolved. The dividend sustainability question is open, with the FY25 payout already trimmed. Current pricing offers limited buffer against further earnings disappointment.
Investors considering a position in WOW should consult primary sources, including Woolworths’ FY25 annual report, current ASX filings, and broker research, for up-to-date balance sheet metrics and price-to-earnings comparisons before making decisions.
The analytical framework applied here, comparing revenue trend against profit trend, identifying CODB growth as the separating mechanism, stress-testing capital structure and dividend sustainability, and weighing external constraints, is not specific to Woolworths. It applies to any ASX company where a strong top line may be masking a deteriorating bottom line.
This article is for informational purposes only and should not be considered financial advice. Investors should conduct their own research and consult with financial professionals before making investment decisions. Past performance does not guarantee future results. Financial projections are subject to market conditions and various risk factors.
Cost-of-doing-business (CODB) refers to the operating overhead expenses a retailer incurs beyond the direct cost of goods, including wages, logistics, utilities, and shrinkage. For Woolworths investors, CODB growth has been outpacing sales growth, which is why net profit is shrinking even as revenue rises.
Woolworths' revenue has grown at 6.8% per annum over three years, but structural cost pressures including higher wages from enterprise agreements, elevated theft and wastage, and rising logistics and energy costs have caused net profit to contract at negative 6.2% per annum over the same period.
Woolworths reported a 19% profit slump in FY25, and its interim FY25 dividend was already trimmed to 45 cents per share from 46 cents in the prior interim period. With interest coverage declining from 4.5x to 3.4x and net gearing at 324.7%, the sustainability of the current payout level is an open question.
The ACCC Supermarkets Inquiry final report, published in February 2025, recommended pricing transparency improvements and supplier codes of conduct, stopping short of major penalties. However, the ongoing regulatory scrutiny creates a practical ceiling on Woolworths' ability to use pricing as a margin recovery lever.
As of mid-May 2026, Woolworths traded at A$32.54, close to the broker consensus fair value target of approximately A$33.50, implying only around 3% price upside. Hold ratings dominate broker consensus, reflecting concerns about the gap between resilient sales and declining profit trends.