
The Memo That Halved Meta’s AI Infrastructure Cost Estimate
4 hrs ago
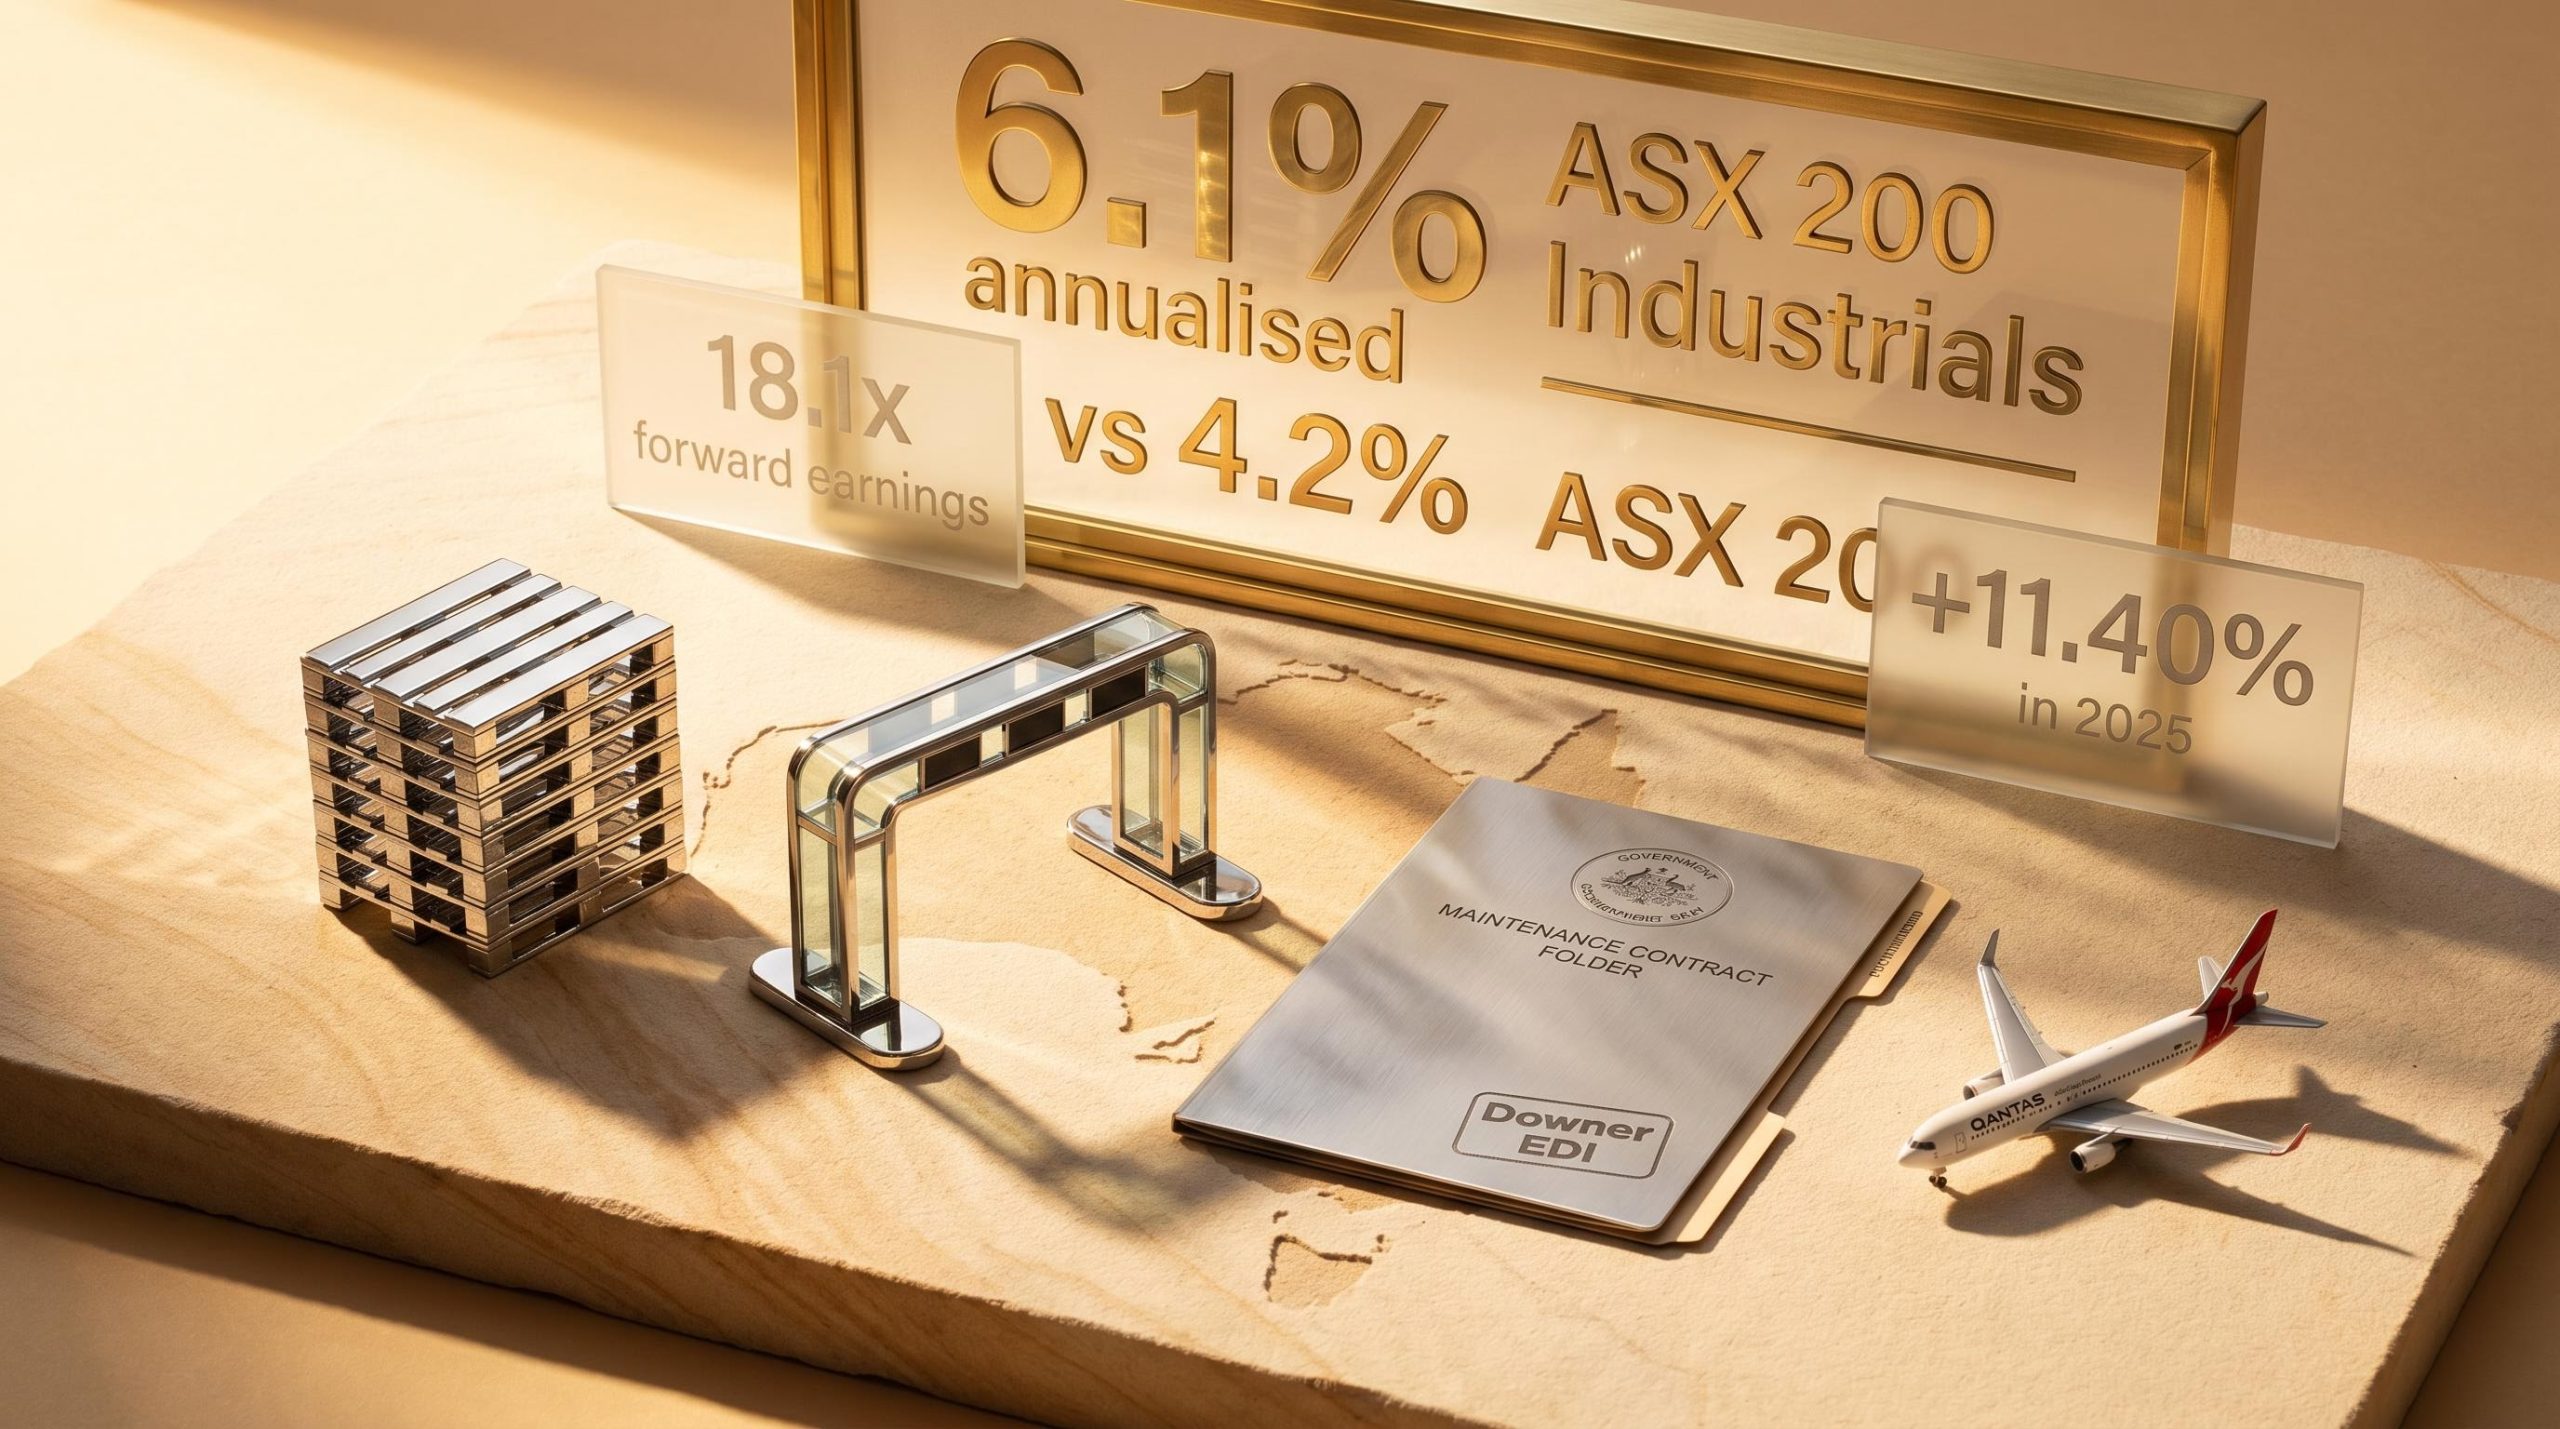
The ASX 200 Industrials Index has returned 6.1% annualised over five years, outpacing the broader ASX 200’s 4.2% over the same period. Yet many Australian investors treat industrials as a residual portfolio category rather than a deliberate allocation decision. That gap between performance and attention is worth closing. The sector’s outperformance reflects structural advantages: government-backed revenue pipelines, inflation-indexed tolls, and services so embedded in daily commerce that demand rarely disappears in a single reporting cycle. In mid-2026, with the broader ASX trading at 18.1x forward earnings against a long-run average of 14.8x, understanding which ASX industrials businesses earn their premium, and which are riding sentiment, has become a practical necessity. What follows is an examination of why the sector has outperformed, what drives revenue reliability across different business models, and how investors can apply a consistent evaluation framework when assessing individual stocks.
The headline numbers establish the empirical foundation:
“The ASX 200 trades at 18.1x forward earnings, versus a long-term average of 14.8x, compressing the margin for error across the sector.”
That five-year gap over the broader index is not negligible. It suggests structural rather than purely cyclical advantage, the kind of persistent edge that survives multiple market conditions rather than depending on one favourable quarter. The 2025 acceleration to +11.40% reinforces the pattern.
ASX structural performance over the long run reflects a sector composition that concentrates index weight in banks and miners rather than the technology-driven reinvestment that powered US returns, a constraint that makes sector-level outperformance within the ASX, such as the industrials gap documented here, more meaningful precisely because it persists despite that structural drag.
The complication sits in the valuation column. A market trading more than 22% above its long-run average multiple does not offer the same forward return potential as one trading at or below it. Morningstar expects earnings of Australian equities to increase in fiscal 2026 after three years of decline, and that recovery could justify some of the premium. But “some” is doing considerable work in that sentence. Outperformance is a starting point for inquiry, not a conclusion. It tells investors where to look; it does not tell them what to pay.
Two distinct mechanisms generate revenue reliability in the ASX industrials sector, and they operate through different structural arrangements.
The first is the long-term government contract. Downer EDI exemplifies this model, securing multi-year maintenance agreements across transport, utilities, and facilities segments. These contracts lock in forward revenue with government or regulated counterparties, providing visibility that stretches years rather than quarters.
The second is the essential, frequently-used service. Transurban collects toll revenue from daily commuter traffic across Sydney, Melbourne, and Brisbane. Volumes are driven by population density and urban commuting patterns rather than discretionary spending decisions. CPI-indexed toll escalation provides an inflation pass-through mechanism, linking revenue growth directly to price-level increases.
IBISWorld forecasts Transport, Postal and Warehousing sector revenue growth of +3.7% in 2026, a baseline that reflects the steady demand underpinning these businesses.
| Attribute | Downer EDI (DOW) | Transurban (TCL) |
|---|---|---|
| Revenue source | Government maintenance contracts | Daily toll collections |
| Contract structure | Multi-year fixed-term agreements | Long-duration concessions |
| Key risk | Tender competition, margin compression | Interest rate sensitivity, regulatory pressure |
| Inflation linkage | Indirect (contract repricing at renewal) | Direct (CPI-indexed toll escalation) |
Contract-backed revenue is not unconditional. Infrastructure investment pipelines shrink during periods of fiscal austerity, creating revenue gaps for services-led businesses even when the underlying maintenance need persists. Federal and state budgets in 2025-26 have maintained a large but more disciplined multi-year pipeline, oriented toward maintenance rather than a sharp expansion of new project starts.
Competitive tendering also compresses margins even when workloads are sustained. Downer’s historical write-downs illustrate this pattern: winning work at tight pricing can sustain revenues while eroding profitability. Investors need to assess not just whether the order book is full, but whether the work it contains is priced to deliver acceptable returns.
Individual company mechanics explain part of the story. The rest sits in the economy-wide forces currently amplifying those mechanics. Three macro themes are reinforcing industrials demand in Australia:
Infrastructure Australia’s 2025 Market Capacity Report places the nation’s Major Public Infrastructure Pipeline at $242 billion across FY2024-25 to FY2028-29, a committed forward workload that underpins multi-year revenue visibility for contracted maintenance and services operators across roads, rail, and utilities.
The resources data is specific. The Australian Government forecasts iron ore production growth of 2.8% per annum across FY26-27. Western Australian production data already reflects this trajectory.
WA iron ore production rose 6% year-on-year in the March 2026 quarter. WA diesel consumption, a proxy for mining activity, rose 7% year-on-year in February 2026.
That production growth implies sustained demand for heavy equipment maintenance, bulk haulage, and remote facilities services, the workloads that flow directly to mining-linked contractors.
IBISWorld data confirms adjacent sectors feeding into industrial demand (transport, warehousing, manufacturing) are expected to grow approximately 3-4% in 2026. Population growth connects directly to Transurban’s traffic volumes and Qantas’s passenger demand, while the data centre theme is structural rather than cyclical. SKS Technologies reports a tender pipeline exceeding $1.2 billion, including more than $1 billion in prospective data centre projects, evidence of the opportunity’s scale for specialist contractors.
ASX electrical infrastructure stocks are capturing a disproportionate share of the data centre buildout opportunity: Genus Plus holds a $2.6 billion tender pipeline and delivered 61% revenue growth in H1 FY26, while Southern Cross Electrical issued FY26 EBITDA guidance of $65-68 million, figures that contextualise SKS Technologies’ $1.2 billion tender pipeline as part of a broader structural wave rather than an isolated contractor story.
Per capita output contraction running alongside headline GDP growth creates an important distinction for industrials investors: government maintenance pipelines and population-driven toll volumes may hold up at an aggregate level even as household spending and private sector capex pull back, a divergence that partially explains why the sector has held its ground in conditions that have hurt consumer-facing businesses.
“Investing in industrials” is not a single decision. The sector contains at least four distinct income-generation models, each carrying different risk and return drivers.
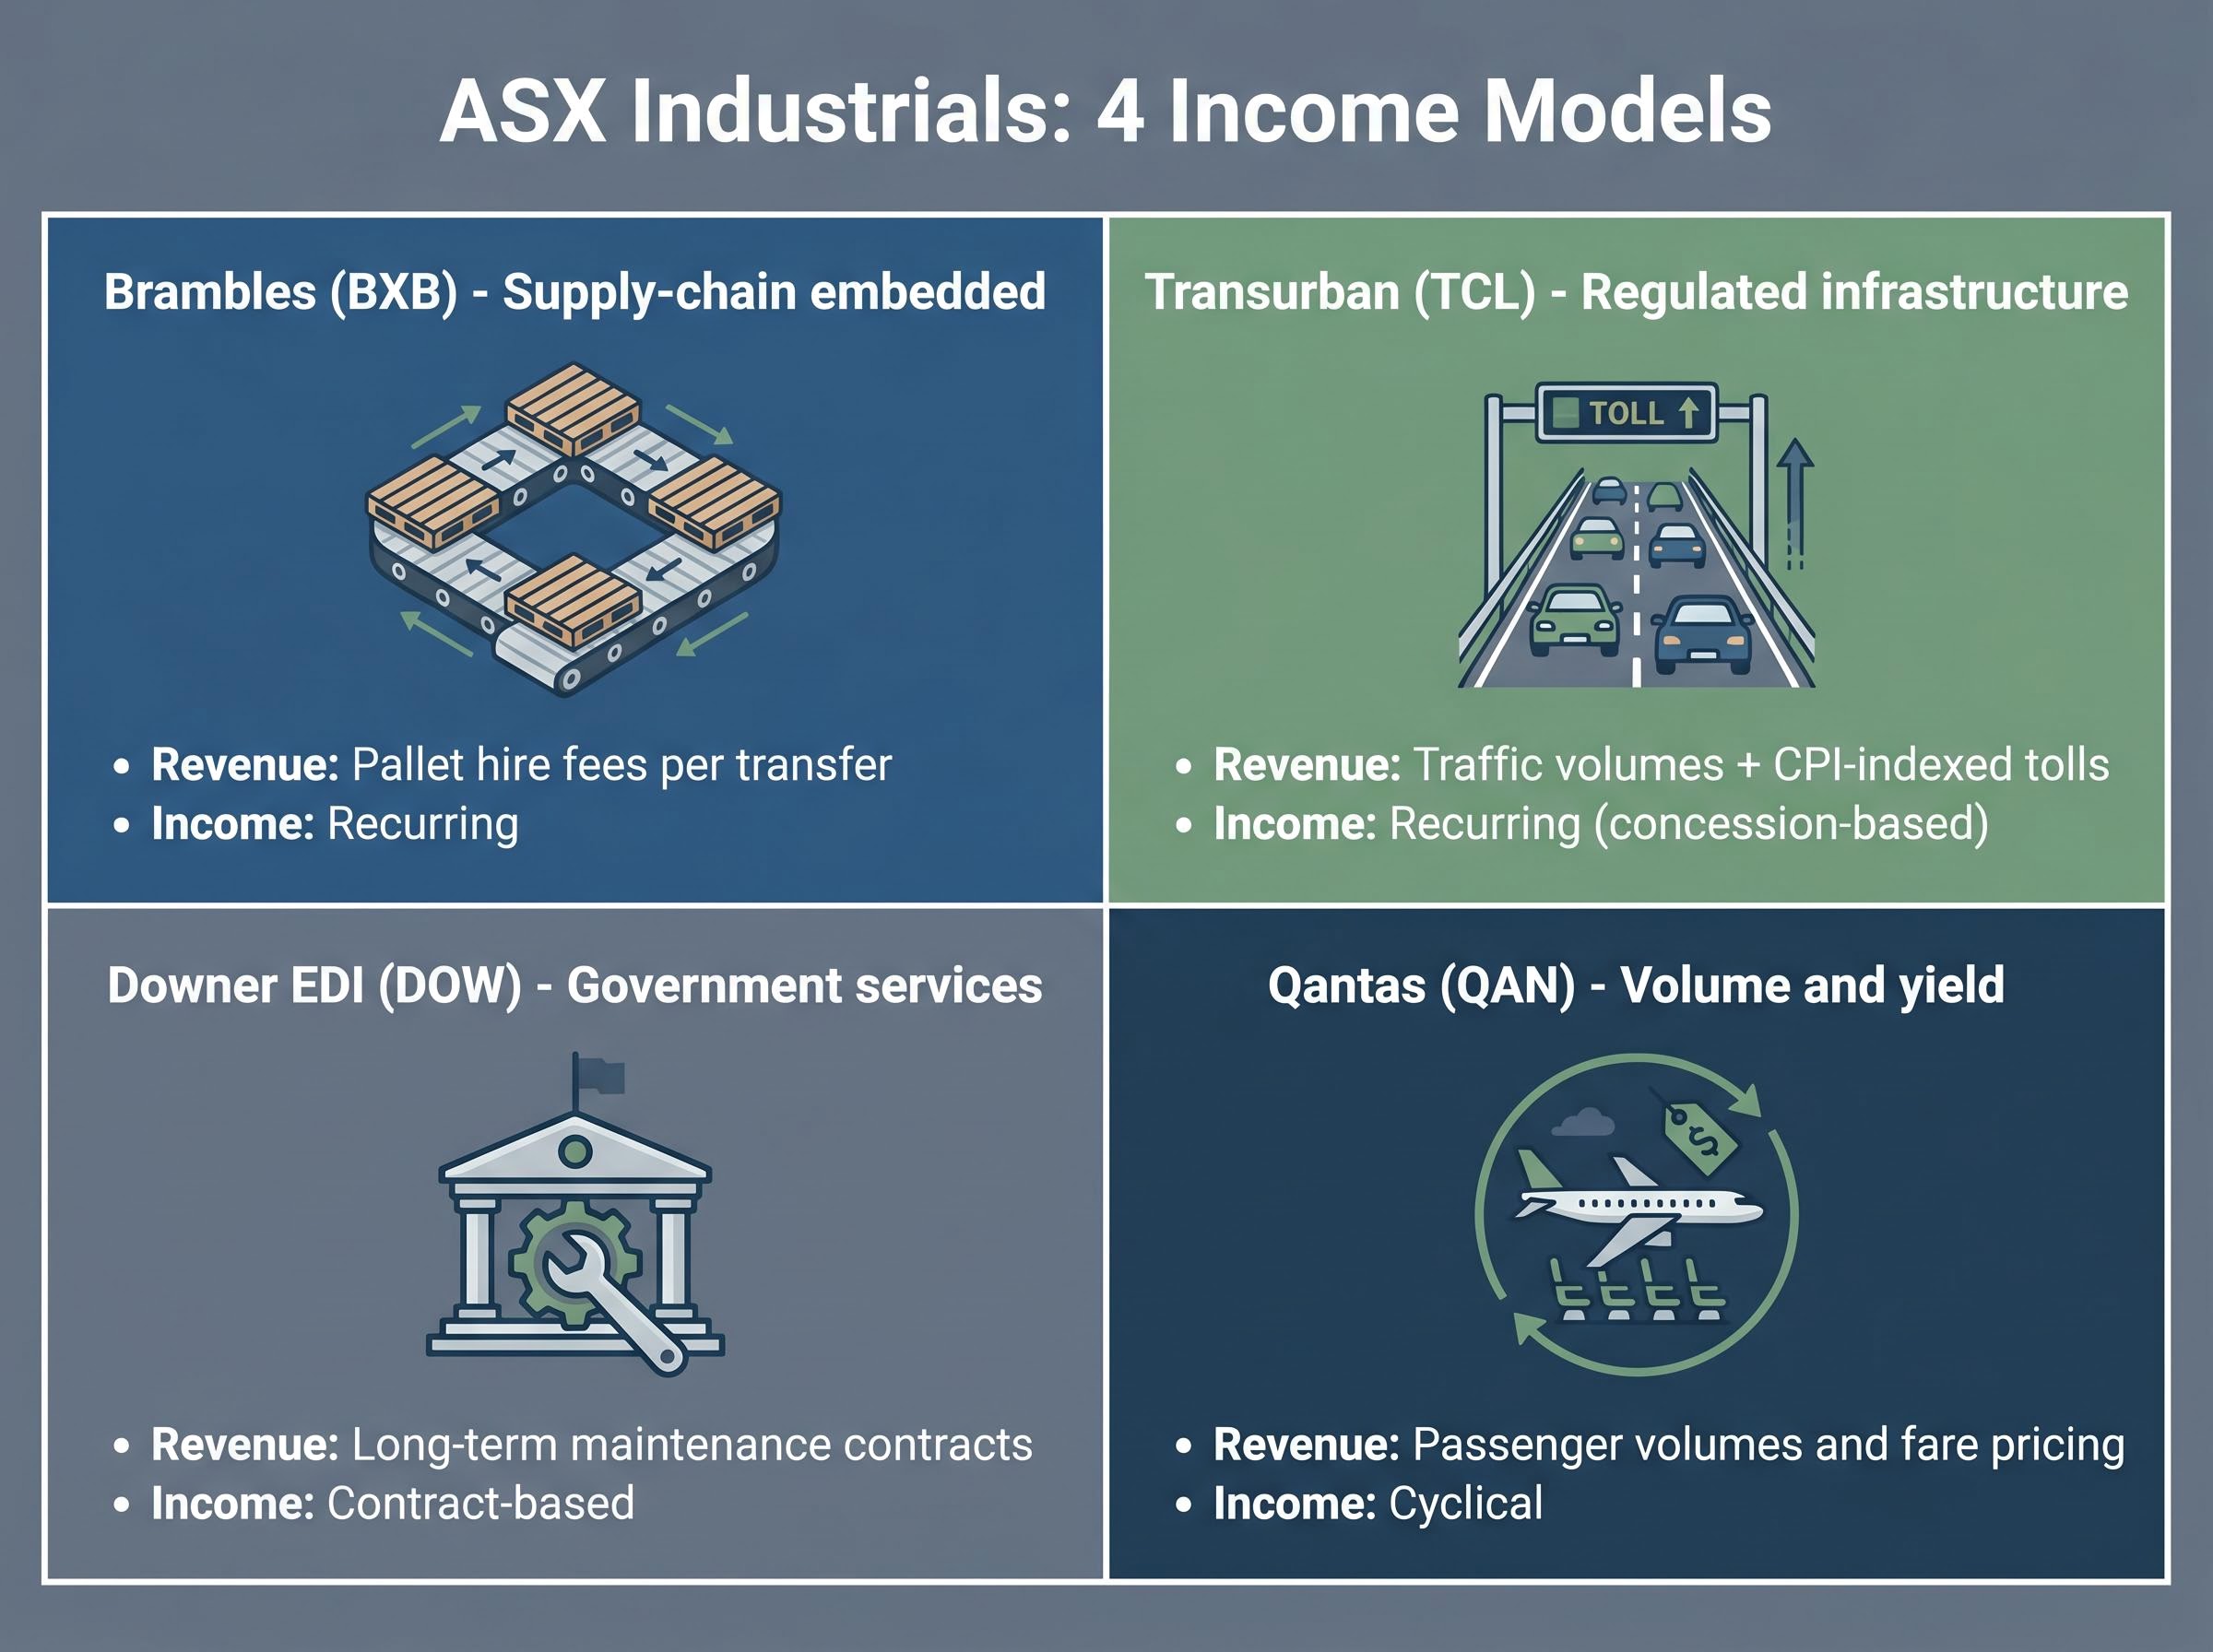
Brambles (BXB) represents the supply-chain-embedded model. Revenue comes from pallet hire fees collected at each transfer point in the global FMCG and grocery supply chain. A three-year revenue compound annual growth rate (CAGR) of 7.6% demonstrates the compounding potential of a deeply embedded recurring service. The share price declined 4.3% from the start of 2025 through mid-May 2026, and the current dividend yield of approximately 2.33% sits below the five-year average of approximately 2.66%, a gap explained by share price appreciation rather than dividend reduction.
Transurban (TCL) is the regulated-infrastructure model. Traffic-volume growth plus CPI-indexed toll escalation drive steady revenue expansion. Valuations remain sensitive to real yield movements, making interest rate direction a first-order consideration for investors.
Downer EDI (DOW) operates the government-services model. Revenue comes from long-term maintenance outsourcing contracts, with the investment case hinging on margin recovery and strategic repositioning away from lower-quality mining exposure toward urban services and public sector work.
Qantas (QAN) is the most cyclically exposed of the four, running the volume-and-yield model. Fuel costs, enterprise bargaining outcomes, and yield normalisation as post-COVID fare premiums fade are the primary variables to monitor.
| Company | Model type | Primary revenue driver | Key risk | Income characteristic |
|---|---|---|---|---|
| Brambles (BXB) | Supply-chain embedded | Pallet hire fees per transfer | Global goods volume slowdown | Recurring |
| Transurban (TCL) | Regulated infrastructure | Traffic volumes + CPI-indexed tolls | Interest rate sensitivity, regulatory pressure | Recurring (concession-based) |
| Downer EDI (DOW) | Government services | Long-term maintenance contracts | Tender competition, margin compression | Contract-based |
| Qantas (QAN) | Volume and yield | Passenger volumes and fare pricing | Fuel costs, yield normalisation, competition | Cyclical |
The contrast between these four models illustrates why sector-level analysis is insufficient. Each company requires a separate analytical lens, calibrated to the specific mechanics driving its earnings.
Four evaluation dimensions translate the analytical work above into a usable decision-making process:
Revenue visibility is the starting screen. A business with three-to-five years of contracted government revenue and a strong pipeline of identified tenders presents a fundamentally different risk profile from one dependent on quarterly order intake.
With the broader market at 18.1x forward earnings, valuation discipline separates opportunity from overpayment. The contrast between two current broker calls illustrates the framework in practice.
Bell Potter rates Mader Group (MAD) as a Buy with a price target of $9.70, implying approximately 25% upside. The stock screens as relatively undervalued versus its historical multiples, with an identified catalyst in a forthcoming five-year growth strategy announcement. SKS Technologies (SKS), by contrast, carries a Morgans Accumulate rating with a price target of $8.95 (approximately 7% upside), despite 12-15% upgrades to profit-before-tax forecasts for FY27-28. The modest implied upside reflects valuation caution after a share price run exceeding 400% over the prior twelve months. SKS maintains work in hand of $355 million, with $270 million allocated to FY27.
The principle is consistent: where multiples remain below historical averages and identifiable earnings catalysts exist, the margin of safety is wider. Where the share price has already re-rated, upside narrows regardless of how strong the operational story remains.
For Brambles, the current yield of 2.33% versus the five-year average of approximately 2.66-2.70% does not signal dividend stress. It reflects share price appreciation compressing the yield ratio. Investors should determine which explanation applies before drawing valuation conclusions. Quick yield-based comparisons are useful for screening, but DCF and DDM approaches provide more rigorous anchoring for final investment decisions.
The structural case for ASX industrials is well-supported. Government outsourcing, population growth, resources recovery, and digital infrastructure investment each provide identifiable, data-backed tailwinds. Morningstar expects an earnings recovery in fiscal 2026, and AMP forecasts the ASX 200 to reach approximately 8,900 points by year-end 2026.
AMP forecasts the ASX 200 at approximately 8,900 points by end-2026, a constructive backdrop, but not a licence for indiscriminate buying in a market already trading above historical multiples.
Constructive does not mean indiscriminate. With the market at 18.1x forward earnings, the industrials stocks that offer the most credible upside are those where multiples remain below historical averages and identifiable earnings catalysts exist. Broad sector enthusiasm is the wrong response to a selective opportunity set.
Return concentration on the ASX is extreme: Morningstar data covering 210 of the largest listed companies shows that a single stock generated approximately 27% of all wealth created across the entire dataset over 15 years, a finding that reinforces why treating any sector as a monolithic allocation, rather than a set of distinct businesses requiring individual assessment, systematically undermines returns.
Three risks warrant ongoing monitoring:
The sector functions as a genuine economic growth proxy for Australian investors. It rewards those who understand the distinct mechanics of each business model and apply valuation discipline accordingly. Treating it as a monolithic category is the surest way to overpay for the names that have already re-rated.
This article is for informational purposes only and should not be considered financial advice. Investors should conduct their own research and consult with financial professionals before making investment decisions. Past performance does not guarantee future results. Financial projections are subject to market conditions and various risk factors.
The ASX industrials sector covers businesses providing infrastructure, maintenance, transport, and commercial services, including companies such as Transurban, Brambles, Downer EDI, and Qantas, each operating under distinct income-generation models ranging from regulated toll roads to government maintenance contracts.
The ASX 200 Industrials Index returned 6.1% annualised over five years versus 4.2% for the broader ASX 200, driven by structural advantages including government-backed revenue pipelines, CPI-indexed toll escalation, and services so embedded in daily commerce that demand rarely disappears across a single reporting cycle.
Companies like Downer EDI secure multi-year maintenance agreements with government or regulated counterparties, locking in forward revenue visibility that stretches years rather than quarters, though investors should note that competitive tendering can compress margins even when workloads are sustained.
Three key tailwinds are reinforcing ASX industrials demand: sustained government infrastructure outsourcing backed by a $242 billion public pipeline through FY2028-29, population growth of 1-2% per annum driving toll road and aviation volumes, and a structural wave of data centre and digital infrastructure investment creating new contract pipelines for specialist contractors.
With the ASX 200 trading at 18.1x forward earnings against a long-run average of 14.8x, investors should compare a company's current multiple to its own historical average, use dividend yield as a screening reference (recognising that yield compression can reflect share price appreciation rather than dividend stress), and rely on DCF or DDM approaches for final valuation decisions.


