Why 30% Recession Odds Are Harder to Trade Than 60%
14 mins ago

Australia’s four major banks shed billions in combined market capitalisation on 13 May 2026, the single trading session after the Federal Budget confirmed the end of negative gearing on existing investment properties. Commonwealth Bank of Australia (CBA) alone fell approximately 10% in that session. The sell-off was not a reaction to failing balance sheets. It was a market-wide reassessment of what the housing credit engine is worth when the tax architecture that powered investor demand for decades is being dismantled. The Budget measures, taking effect from 1 July 2027, strip negative gearing entitlements from new purchases of existing dwellings and replace the 50% capital gains tax (CGT) discount with cost-base indexation plus a 30% minimum tax on net capital gains. What follows traces the transmission mechanism from policy change through to bank earnings, stock valuations, and relative exposure across CBA, NAB, Westpac, and ANZ, providing a framework for what actually moves from here.
Early coverage condensed the reforms into a simple headline: negative gearing is gone. The detail is more specific than that, and the specifics determine where the pressure actually falls.
Three policy parameters define the scope:
The table below summarises the structural shift:
| Setting | Pre-Budget | Post-Budget (from 1 July 2027) |
|---|---|---|
| Negative gearing | Available on all investment properties | Limited to new builds only; existing dwellings excluded |
| CGT discount | 50% discount on gains held 12+ months | Cost-base indexation plus 30% minimum tax on net capital gains |
| Grandfathering | N/A | Properties held before 12 May 2026 retain full existing entitlements |
The Parliamentary Budget Office’s June 2025 costing (ECR-2025-3414), which informed the policy design, estimated the combined effect of both measures would reduce overall investor returns by 15-30%. The explicit policy intent is to redirect investor demand toward new construction, which remains untouched by either change.
The negative gearing ring-fence operates with a narrower scope than many investors initially assumed: it applies only to existing dwellings purchased after 12 May 2026, leaves new builds entirely untouched, and introduces a separate 30% minimum tax on trust distributions that family structures holding investment properties will need to review before 1 July 2027.
The PBO costing ECR-2025-3414 sets out the specific policy parameters underpinning these changes, including the treatment of grandfathered properties and the projected reduction in investor returns across the combined negative gearing and CGT modifications.
The policy does not appear on any bank’s income statement directly. It arrives through three distinct transmission channels, each affecting a different part of the earnings picture.
The three-reform package carries a combined decade-long revenue impact of $77 billion, a scale that clarifies why bank analysts are treating this as a structural shift rather than a cyclical headwind: the CGT discount replacement, the negative gearing ring-fence, and the discretionary trust minimum tax each address a different layer of the investor tax advantage that has supported housing credit demand for decades.
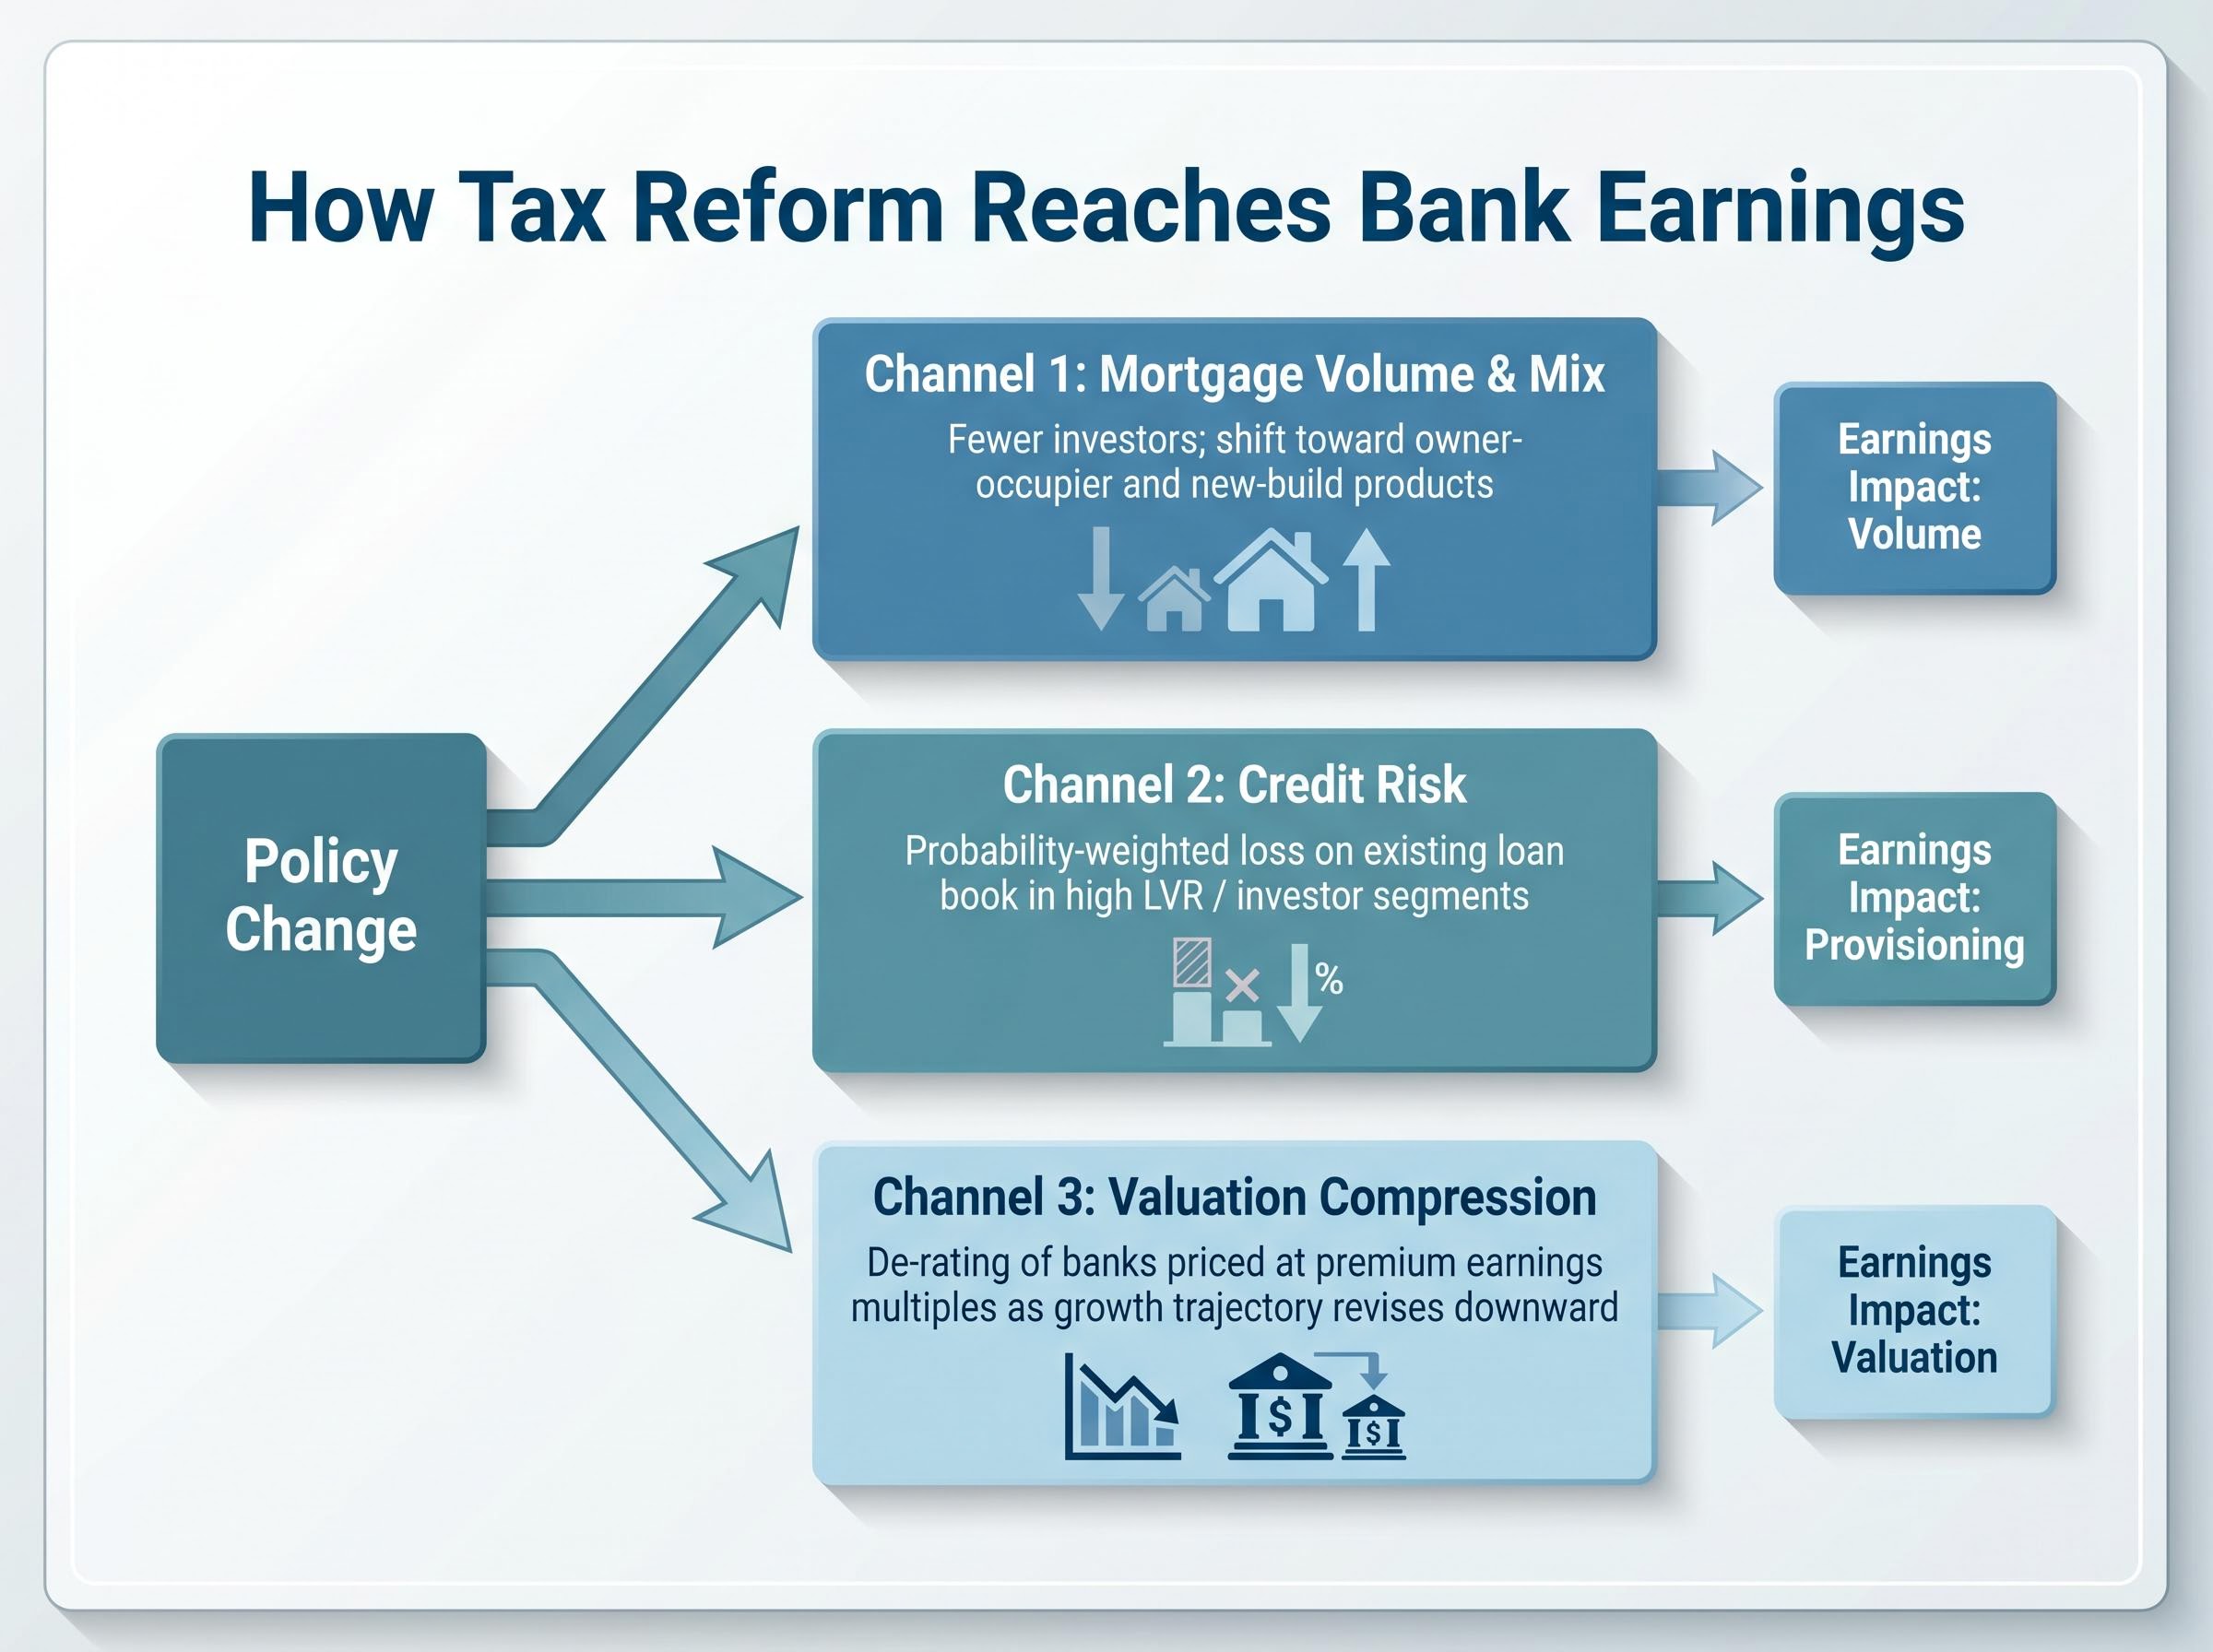
The volume channel was already showing strain before the Budget arrived. ABS Lending Indicators recorded a 5.3% fall in investor loan commitments during the March Quarter 2026. Investors had accounted for approximately 40% of new housing loan commitments in late 2025, and that share was declining. RBA credit aggregates showed housing credit growing at an annualised pace of approximately 7.4% in March 2026, a rate that now looks like a high-water mark.
The Parliamentary Budget Office’s costing (ECR-2025-3414) estimated the combined negative gearing and CGT changes would reduce overall investor returns by 15-30%, drawing on academic work including Cho, Li & Uren (2022) and Grattan Institute research.
The PBO and academic consensus places the national property price impact at 1-4%. That range does not signal systemic stress, but it does map to small, real increases in probability-weighted credit losses in investor-concentrated postcodes, particularly inner-city unit markets in Sydney and Melbourne where investor representation is highest.
The valuation channel amplifies the damage where expectations were highest. A bank trading at a forward price-to-earnings (P/E) ratio of 25x absorbs a 1% earnings downgrade as a larger absolute share-price move than one trading at 20x. CBA’s forward P/E of 25.00x made it the most exposed name in the sector to any downward revision in housing credit growth assumptions.
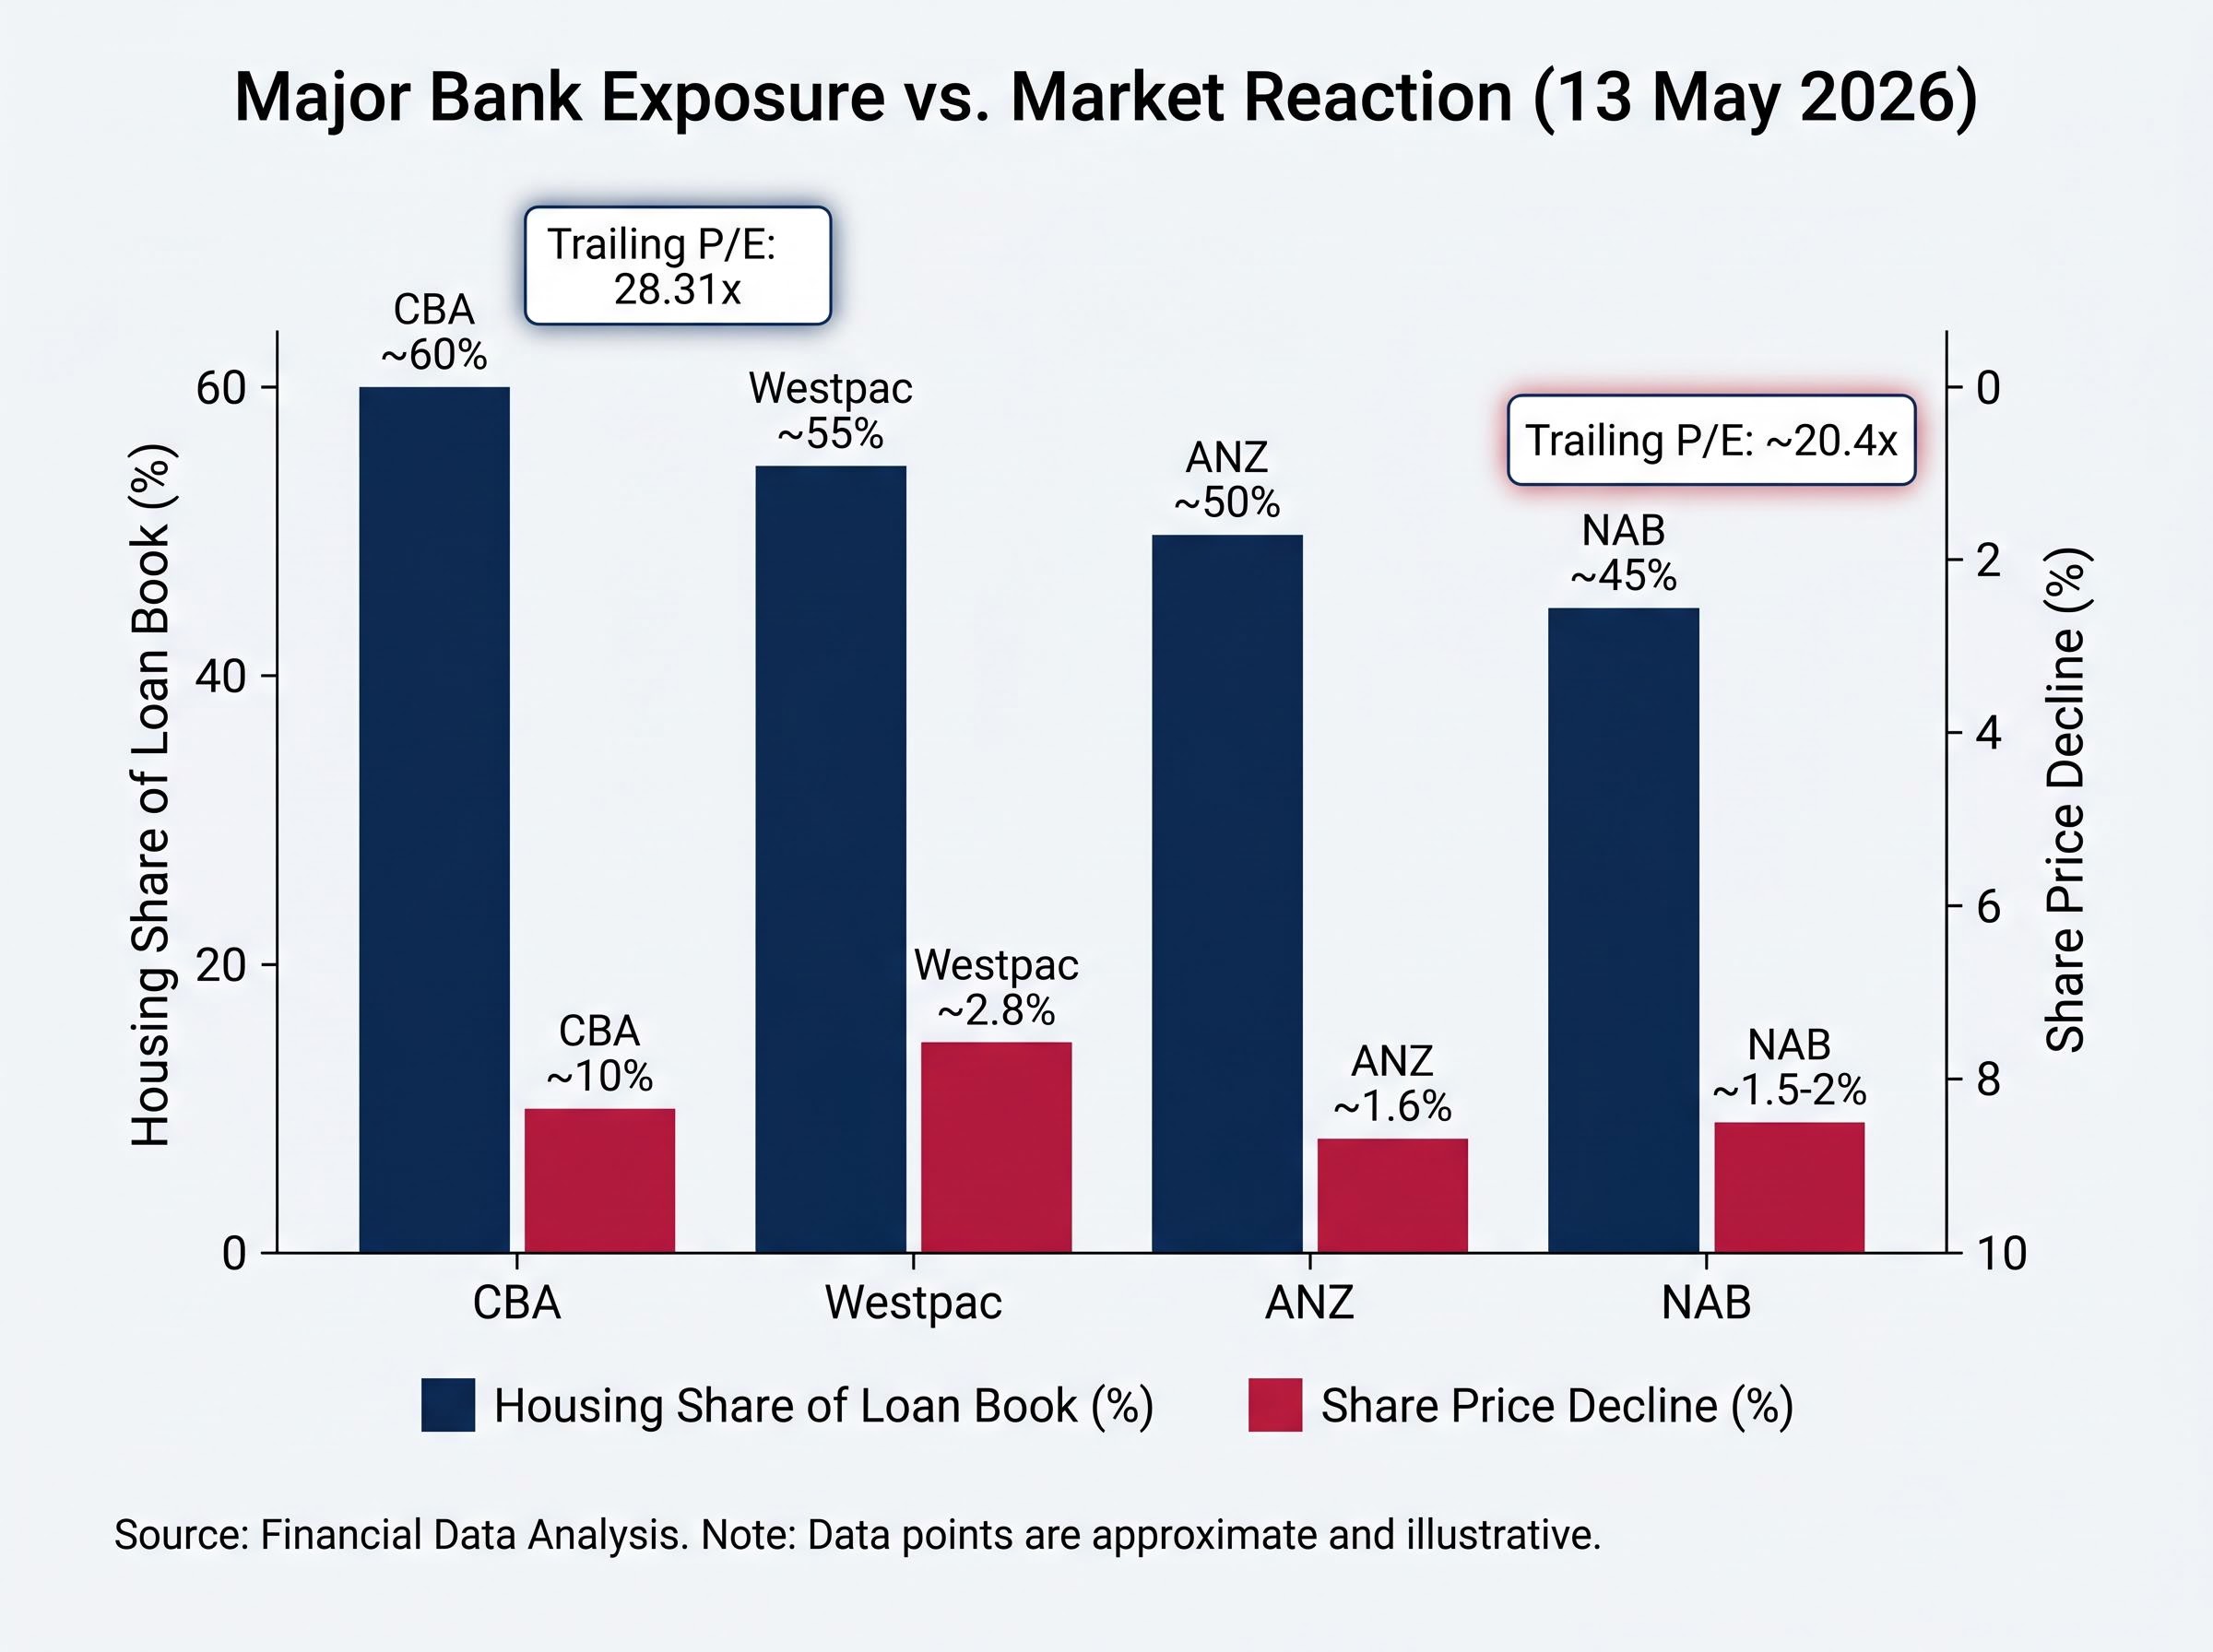
The sell-off on 13 May 2026 hit all four majors, but not equally.
| Bank | Share price move (13 May 2026) | Approx. housing share of loan book | Trailing P/E | Key diversification offset |
|---|---|---|---|---|
| CBA | ~10% decline | ~60% | 28.31x | Limited; highest domestic housing concentration |
| Westpac | ~2.8% decline | ~55% | — | Moderate business lending weighting |
| ANZ | ~1.6% decline | ~50% | — | New Zealand operations; markets business |
| NAB | ~1.5-2% decline | ~45% | ~20.4x | ~25% business/institutional lending |
The ASX financials index fell approximately 4% to a five-month low in the same session.
CBA’s severity was not random. Two structural factors compounded. First, approximately 60% of its loan book sits in domestic housing, the highest concentration among the majors. Second, its trailing P/E of 28.31x and forward P/E of 25.00x meant any growth downgrade translated into a disproportionate share-price hit. The timing made it worse: CBA’s March Quarter 2026 trading update, released the same day, reported $316 million in loan impairment expense including a $200 million collective provision top-up reflecting a more cautious macro outlook.
Morgans holds a sell rating on CBA with a price target of $119.40, implying approximately 23% further downside from mid-May 2026 levels.
NAB, by contrast, absorbed the same sector headwind from a trailing P/E of approximately 20.4x and a loan book where business and institutional lending accounts for roughly 25% of exposures. The buffer against de-rating is structurally wider.
Westpac’s mortgage concentration runs deeper than the 55% housing-share figure in the sector comparison table suggests: its H1 FY26 earnings revealed a 69% residential mortgage weighting across the loan book, a net interest margin of 1.89% (down 6 basis points), and a share price trading roughly 20% above the median analyst target of A$30.80 even before the Budget sell-off added a new valuation pressure.
The 2016-2019 period, when Labor proposed substantially identical reforms that never passed Parliament, produced a body of modelling that the PBO explicitly recycled in its 2025 costing. That work offers a direct stress test for the current measures.
The conclusions from that era’s analysis converged on four points:
CBA’s Common Equity Tier 1 (CET1) ratio stands at 11.6% as of the March Quarter 2026, well above regulatory minimums and consistent with a sector that is well-capitalised even under a structural growth headwind.
The Grattan Institute’s “Hot Property” report (Daley and Wood, 2016) estimated property prices 1-2% lower under similar reforms, representing the lower bound of the 1-4% range now cited in post-Budget analysis. The difference in 2026 is that the measures have actually passed, removing the policy uncertainty discount that persisted through the 2016-2019 debate but also confirming the negative.
As of mid-May 2026, no official ABS or RBA data captures the post-Budget shift in investor behaviour. The gap between the policy announcement and the first hard data creates a window where sentiment, broker anecdotes, and auction reports are doing the work that official statistics will eventually take over.
Three data releases will begin to fill that gap:
Qualitative signals are already available. Capital Brief and The Aussie Corporate reported on 13-14 May 2026 that mortgage brokers were seeing sharp drops in investor enquiries, particularly for second and third investment properties and existing apartments in inner Sydney and Melbourne. Early deal repricing behaviour, with investors seeking higher yields or lower prices to offset lost tax shields, was also noted. Auction clearance rates held roughly steady overall, but registered bidder counts for inner-city units dropped, consistent with an investor pullback rather than a broad-based market correction.
The tension between the government’s intent, to redirect demand toward owner-occupiers and new construction, and the short-term risk of reduced rental supply could become the policy’s most consequential side effect. If investors exit the existing rental stock faster than new construction absorbs demand, rents in already tight markets could rise further. Some academic scenarios cited estimates of up to 30% higher rents in the tightest markets. The Australian Banking Association has publicly flagged this risk as a potential unintended consequence.
Whether that rental pressure materialises could itself become a political variable, either moderating or accelerating further policy intervention.
The Budget crystallised a valuation tension at CBA that predated 12 May 2026. With approximately 60% of its loan book in domestic housing and a forward P/E of 25.00x even after the correction, the stock’s premium rests on a housing credit growth trajectory that the tax reforms directly challenge.
CBA management described the Budget changes as likely to “modestly dampen housing credit growth” over the medium term, according to commentary accompanying the March Quarter 2026 trading update.
NAB, Westpac, and ANZ absorb the same sector headwind from lower starting multiples and more diversified earnings bases. NAB’s trailing P/E of approximately 20.4x and 45% housing exposure leave more room before the de-rating math becomes punitive. The relative value argument for the other three majors does not require the Budget to be benign; it requires only that the damage is less severe at lower multiples.
Three open variables will determine the ultimate earnings impact across the sector:
Among the residential developer beneficiaries flagged by major bank economists, ASX-listed names including Stockland, Mirvac, and Lendlease sit in a structurally different position from the banks: their earnings would benefit if investor demand successfully redirects toward new construction, the precise outcome the policy intends to engineer.
The resolution of each remains months away at minimum. The data does not yet exist to answer them.
The Budget creates a confirmed, multi-year headwind for housing credit growth and amplifies de-rating risk at premium-multiple banks. It does not signal a capital or solvency event. CBA’s CET1 ratio of 11.6% and the sector’s existing macroprudential buffers make that distinction clear.
The three-channel framework, volume and mix, credit risk, and valuation compression, provides the lens for monitoring how the impact unfolds. The first definitive data checkpoints arrive in July 2026 with the ABS Lending Indicators for May/June and the RBA Credit Aggregates for April/May. Until those figures land, the market is pricing probability, not evidence.
For investors holding or evaluating ASX banking positions, the question is not whether the Budget was negative. It was. The question is whether the premium embedded in CBA’s multiple was ever fully justified by the growth story underneath it, and whether the other three majors offer a more resilient entry point into the same sector at a lower price of admission.
This article is for informational purposes only and should not be considered financial advice. Investors should conduct their own research and consult with financial professionals before making investment decisions. Past performance does not guarantee future results. Financial projections are subject to market conditions and various risk factors.
Negative gearing allows property investors to deduct rental losses against other income. From 1 July 2027, the 2026 Federal Budget restricts this entitlement to newly constructed properties only, removing it from new purchases of existing dwellings, while properties held before 12 May 2026 remain fully grandfathered.
CBA's sharp 10% fall on 13 May 2026 reflected two compounding factors: approximately 60% of its loan book is in domestic housing (the highest concentration among the major banks), and its forward price-to-earnings ratio of 25x meant any downward revision to housing credit growth assumptions translated into a disproportionately large share-price decline.
CBA fell roughly 10% given its 60% housing loan concentration and premium valuation, while NAB declined just 1.5-2% due to its lower trailing P/E of around 20.4x and a more diversified loan book with approximately 25% in business and institutional lending. Westpac fell about 2.8% and ANZ about 1.6%, reflecting their intermediate housing exposures and partial offsets from business lending and offshore operations.
The first hard evidence will come from the ABS Lending Indicators for May/June 2026 (expected July 2026) and the RBA Credit Aggregates for April/May 2026, which will provide the first official read on investor loan commitment volumes and system housing credit growth following the Budget announcement.
No. Analysts and historical precedent from the 2016-2019 reform debate characterise the impact as a growth and valuation compression issue rather than a capital or solvency event. CBA's Common Equity Tier 1 ratio stood at 11.6% as of the March Quarter 2026, well above regulatory minimums, and the Parliamentary Budget Office expects only a 1-4% national property price impact.