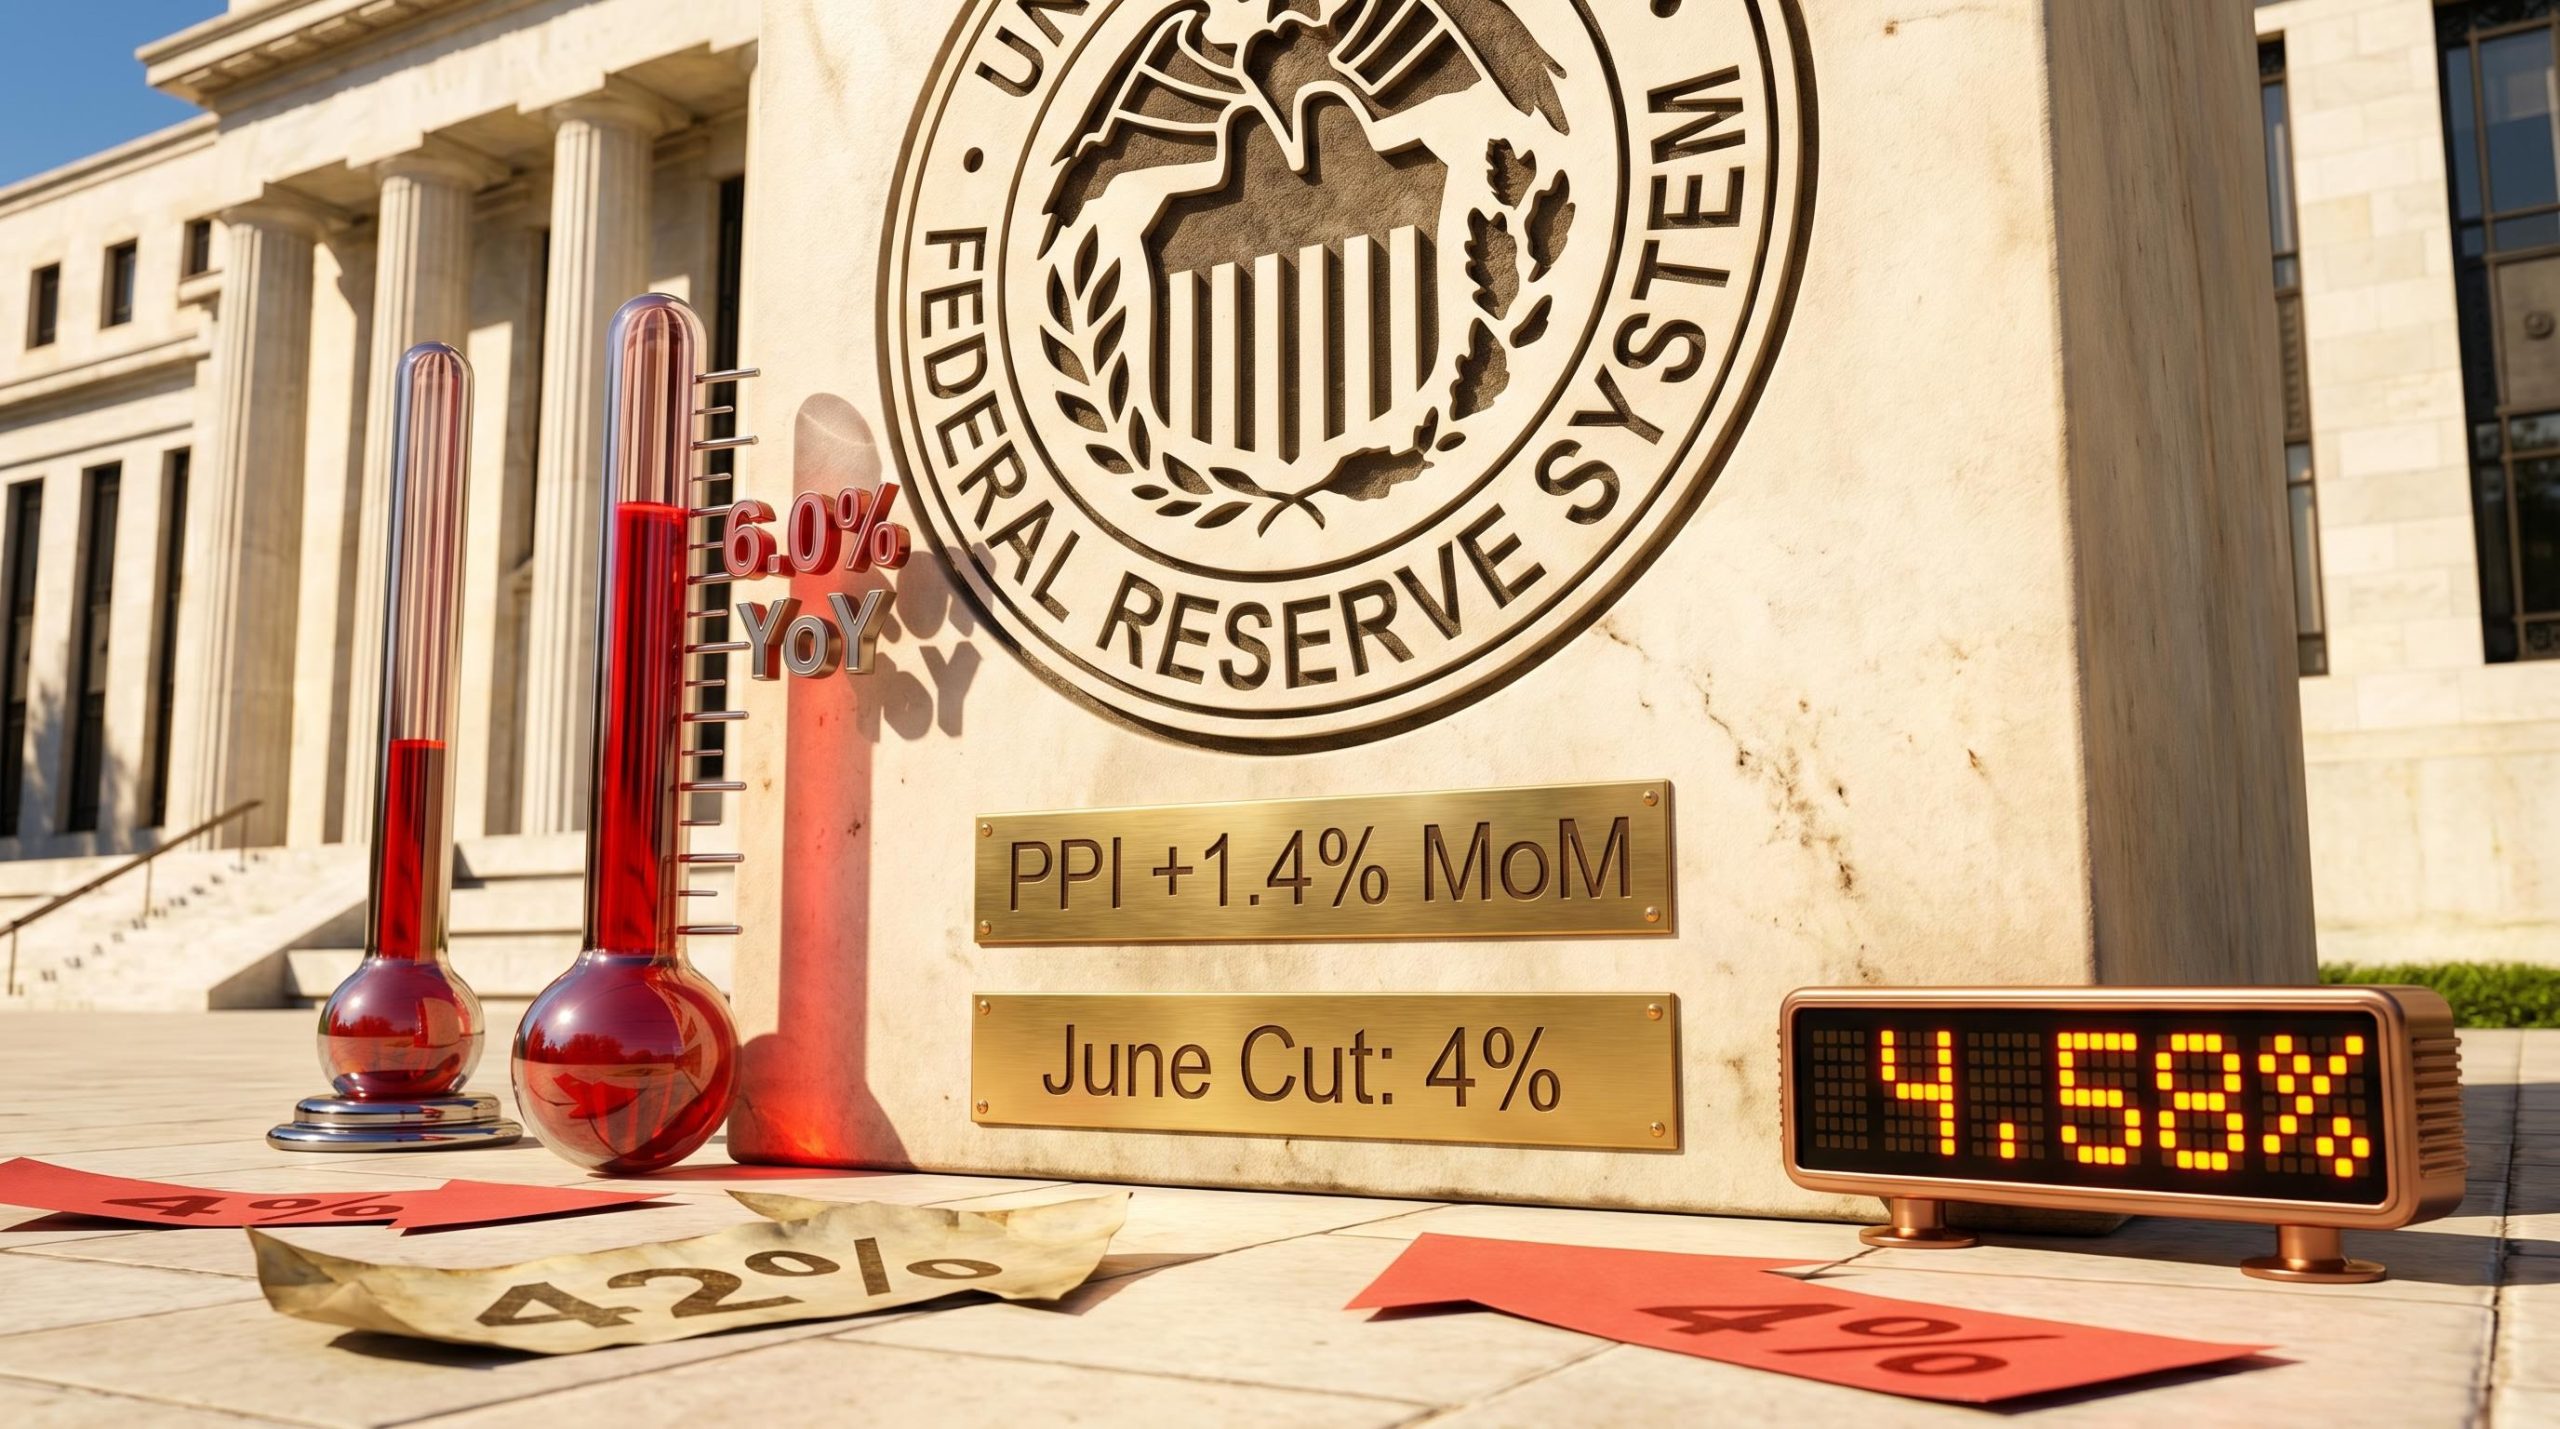
The probability of a Federal Reserve rate cut at the June FOMC meeting collapsed from 42% to 4% in a single session on 13 May 2026, and one data release did all the work. The April Producer Price Index landed with a 1.4% month-over-month headline gain and a 6.0% annual surge, figures that immediately rewrote Wall Street’s rate cut calendar and sent shockwaves through equities, Treasuries, and the dollar. Coming one day after a hotter-than-expected CPI print (+0.4% MoM, +3.5% YoY on 12 May), the PPI report completed a two-day inflation shock that has effectively closed the Fed’s easing window. What follows breaks down exactly what the PPI numbers showed, why they matter for the Federal Reserve’s upcoming 16-17 June decision, how Wall Street and markets have already repriced, and what retail investors need to understand about what comes next.
The April CPI shock that landed on 12 May printed at +0.6% month-over-month, double the +0.3% consensus forecast, and pushed the annual rate to +3.8%, its highest since May 2023; the PPI report the following day effectively completed a two-session inflation verdict that the market had no room to dismiss as noise.
The April PPI numbers that changed everything
The headline figures were bad. The details were worse.
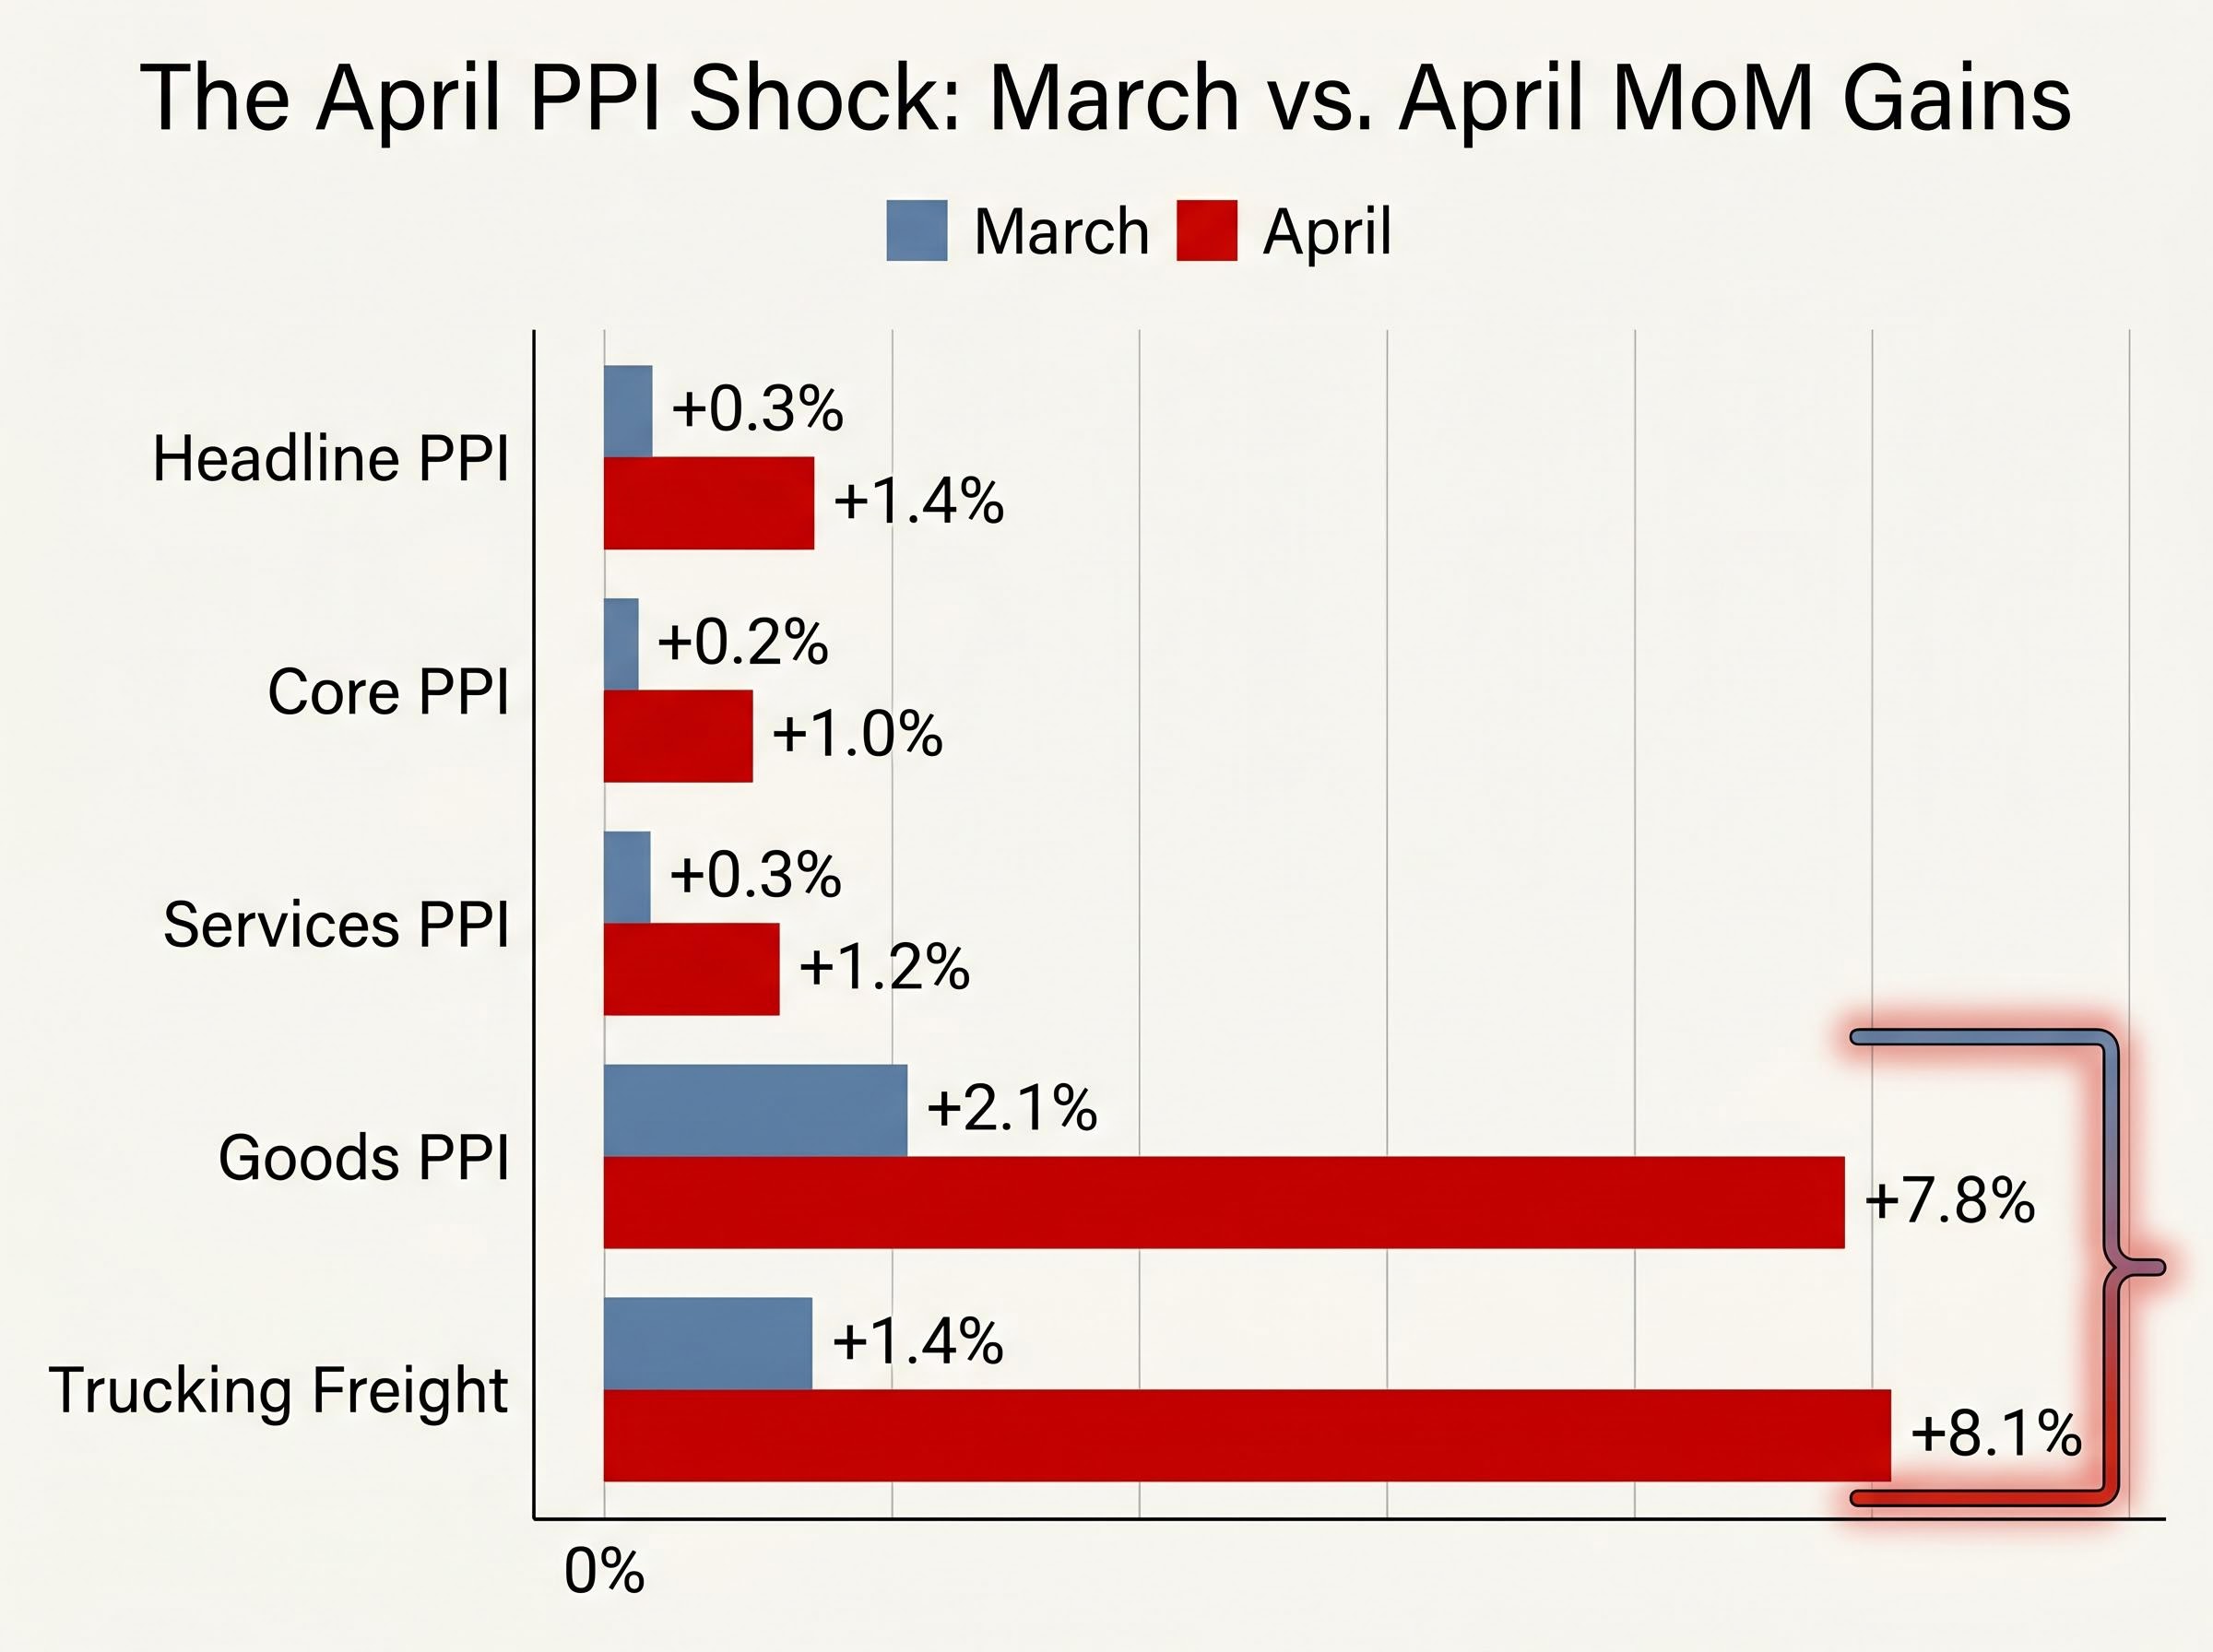
- Headline PPI: +1.4% MoM, +6.0% YoY (fastest annual pace since December 2022)
- Core PPI (ex-food/energy): +1.0% MoM (beating estimates by 70 basis points), +5.2% YoY
- Services PPI: +1.2% MoM, the steepest monthly gain in four years
Three sub-components stood out for the scale of the surprise. Trucking freight surged +8.1% month-over-month, the largest single-month jump since 2009, signalling that logistics costs are feeding into the price of nearly everything that moves by road. Services inflation at +1.2% confirmed that price pressure has spread well beyond energy. And the goods component rose +7.8%, led by gasoline, completing a picture of broad-based acceleration.
| PPI Component | April Reading | Prior Period | Context |
|---|---|---|---|
| Headline PPI (MoM) | +1.4% | +0.3% (March) | Largest MoM gain since early 2023 |
| Core PPI (MoM) | +1.0% | +0.2% (March) | Beat consensus by 70bps |
| Services PPI (MoM) | +1.2% | +0.3% (March) | Steepest in four years |
| Trucking Freight (MoM) | +8.1% | +1.4% (March) | Largest since 2009 |
| Goods PPI | +7.8% | +2.1% (March) | Gasoline-led |
The breadth of price pressure across goods, services, and logistics is what separates a one-off spike from a systemic problem. That breadth is why analyst reactions arrived so forcefully.
When big ASX news breaks, our subscribers know first
What PPI is and why it moves the Fed
The Producer Price Index measures prices at the wholesale level, before goods and services reach consumers. It tracks what factories, logistics firms, and service providers charge their business customers, not what shoppers pay at the register. That distinction makes PPI a leading indicator of future consumer inflation: when producers pay more for inputs, those costs typically flow through to retail prices within one to three months.
From factory gate to Fed meeting room
Several PPI services components feed directly into the calculation of the Personal Consumption Expenditures (PCE) price index, the Federal Reserve’s preferred inflation measure. When the PPI services reading surges, as it did at +1.2% in April, forecasters revise their PCE estimates upward almost immediately. The April PCE release, the next major data point, is now expected to arrive hot.
Corroborating indicators reinforce the upstream pressure:
- ISM Manufacturing Prices Paid: 62.4 in April (up from 59.1 in March), highest since October 2025
- ISM Services Prices Paid: 61.8 in April (up from 58.2 in March)
- March PCE core: +2.7% YoY (final), with April PCE now facing upward pressure from PPI pipeline effects
Retail investors who only track CPI miss this early warning system. PPI is where inflation is born; understanding the sequence from wholesale prices to PCE to Fed decisions equips readers to interpret future data releases before markets react.
How the Street reacted: analysts reprice the entire rate path
JPMorgan moved first. Michael Feroli characterised the 1.4% MoM PPI as “a hawkish shock” and shifted the firm’s forecast to zero probability of a June rate cut, pushing the expected first easing to September 2026. Within hours, the rest of the Street converged on the same conclusion.
Goldman Sachs analyst Lindsay Rosner raised the firm’s 2026 inflation forecast from 3.4% to 3.8%, citing the PPI services surge and trucking component as evidence of “persistent pipeline pressures.” Goldman now assigns a 95% probability to a June hold and sees no cuts until Q4 2026.
Citigroup’s Andrew Basket warned of a “reflation trade revival,” noting that core PPI at 5.2% YoY “smashes through” the Fed’s 2% target. Citigroup projects the 10-year yield reaching 4.70%.
Deutsche Bank stood alone in dissent. Strategist Henry Allen characterised the spike as an “energy/transitory spike,” attributing the 7.8% goods jump primarily to gasoline. The firm retained a 25% June cut probability, conditional on CPI softening.
Ed Yardeni of Yardeni Research offered the bluntest summary:
The compounding shocks reshaping the rate outlook extend beyond a single data release: the Middle East oil disruption, the 6.0% PPI print, and Kevin Warsh’s Fed Chair confirmation have together placed a 39% implied probability of a December 2026 rate hike on the options board, a scenario that would have been dismissed as fringe just weeks before.
“No cuts in 2026; PPI kills dovish hopes.”
Revised rate cut timelines across major firms:
- JPMorgan: First easing pushed to September 2026
- Goldman Sachs: No cuts until Q4 2026
- Citigroup: Higher-for-longer posture; 10-year yield target of 4.70%
- Deutsche Bank (minority): 25% June cut probability retained
- Yardeni Research: No cuts in 2026
What Fed officials said within 24 hours
New York Fed President John Williams called the data “concerning” for core inflation trends on 13 May, stating it “reinforces need for caution at June meeting.” He made no commitment to any easing path.
Dallas Fed President Lorie Logan delivered a sharper assessment on the morning of 14 May: “PPI validates inflation reacceleration; cuts off table for 2026 H1.”
Neither official left room for a dovish interpretation.
How markets repriced across every asset class
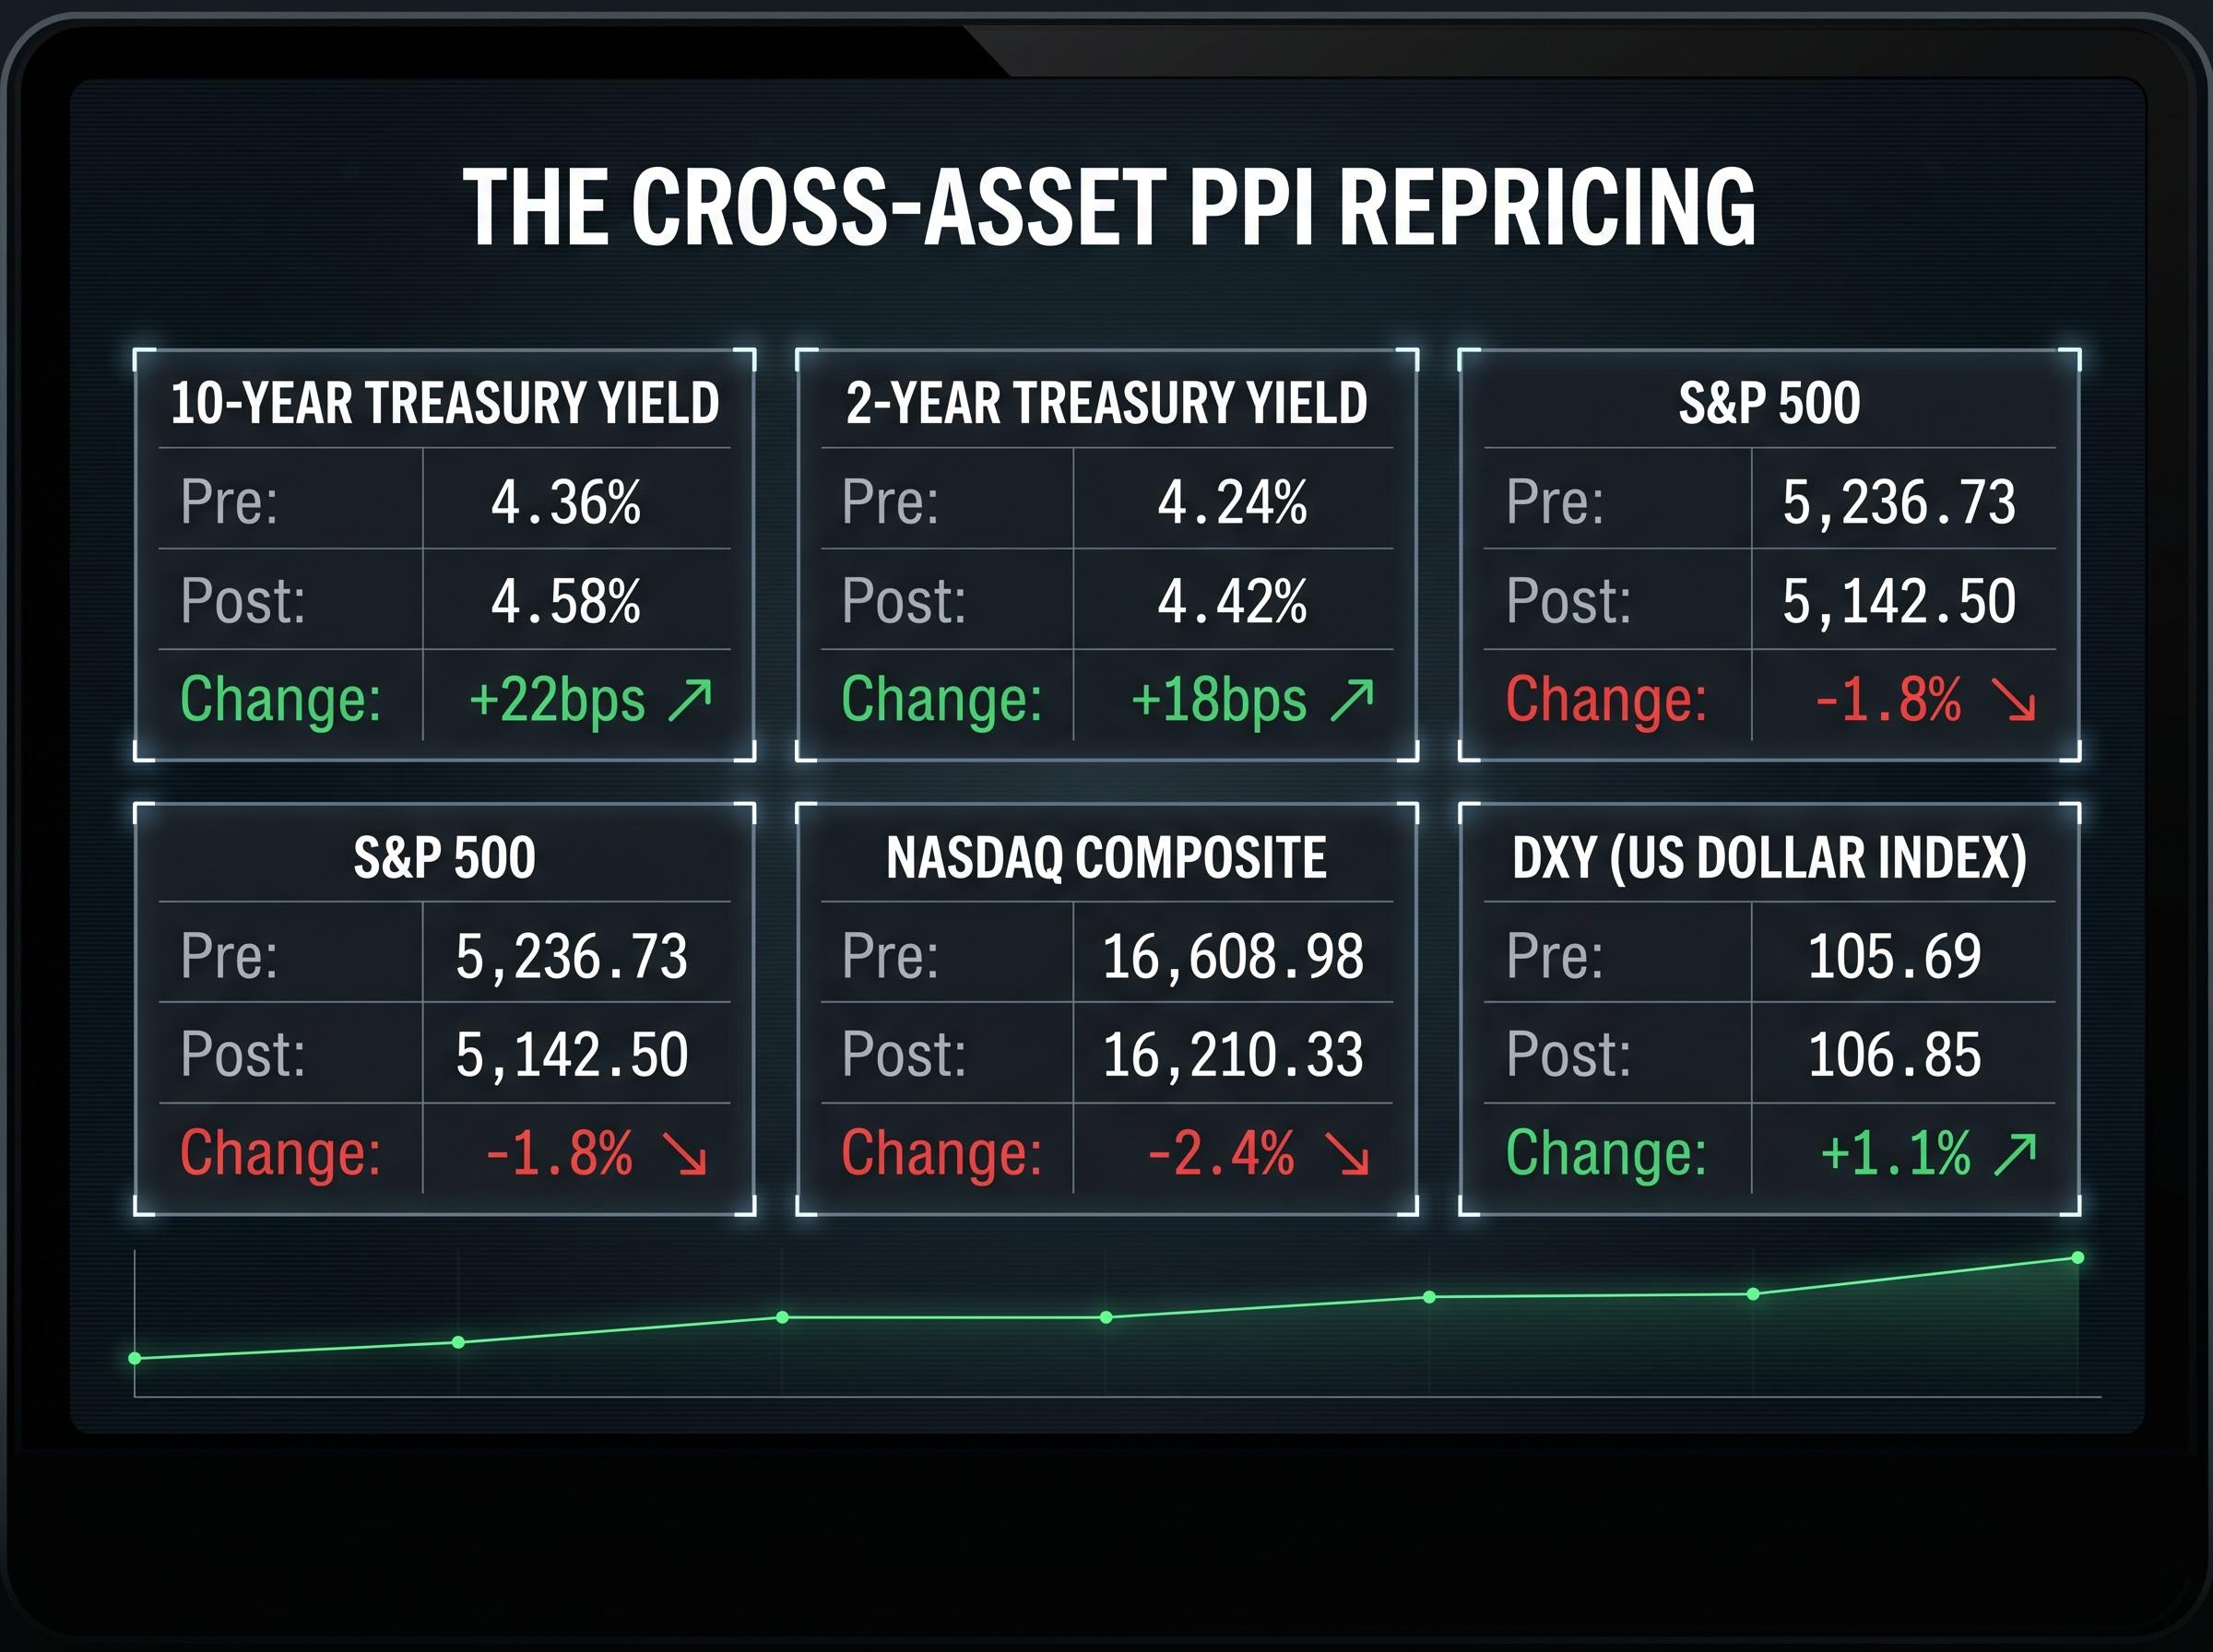
The Treasury market moved first, and everything else followed. The 10-year yield jumped 22 basis points to 4.58% from 4.36% pre-PPI, the single-session equivalent of the market declaring “higher for longer” in real time. Yardeni Research projects a near-term advance toward 4.60%.
Rising yields compressed equity valuations through a straightforward mechanism: higher discount rates reduce the present value of future earnings, hitting growth and technology stocks hardest. The S&P 500 fell 1.8% to 5,142.50. The Nasdaq Composite dropped 2.4% to 16,210.33. The Philadelphia Semiconductor Index led the selloff at -3.2%.
The dollar strengthened as receding cut expectations attracted capital inflows. The DXY rose 1.1% to 106.85, its highest level since March 2026.
June rate cut probability collapsed from 42% to 4% in a single session, per CME FedWatch.
| Asset | Pre-PPI Level | Post-PPI Level | Change |
|---|---|---|---|
| 10-Year Treasury Yield | 4.36% | 4.58% | +22bps |
| 2-Year Treasury Yield | 4.24% | 4.42% | +18bps |
| S&P 500 | 5,236.73 | 5,142.50 | -1.8% |
| Nasdaq Composite | 16,608.98 | 16,210.33 | -2.4% |
| DXY (US Dollar Index) | 105.69 | 106.85 | +1.1% |
The cross-asset selloff reflects a rational repricing of the rate path, not panic. Investors who understand why yields rise and equities fall on inflation data are better positioned to distinguish durable repricing from short-term noise.
The Treasury yield ceiling implied by a potential peace deal is lower than many investors expect: Wolfe Research’s sign-restriction model attributes only 19 of the 40 basis points in the yield surge to the Iran geopolitical shock, with the remaining 21 basis points driven by growth repricing and structural factors that would not unwind even if the Hormuz conflict resolved tomorrow.
What the Fed is likely to do at the 16-17 June FOMC meeting
The June meeting is now a communication event more than a rate decision. The hold itself is priced at 96% probability. What matters is the statement language.
JPMorgan expects the Fed to drop its “easing bias” from the FOMC statement entirely. In plain terms, that means the Fed would no longer signal that its next move is likely a cut, a shift that resets market expectations for the remainder of 2026.
| FOMC Meeting | Hold Probability | 25bps Cut Probability | First Cut Probability |
|---|---|---|---|
| 16-17 June | 96% | 4% | 4% |
| 29-30 July | 78% | 20% | 22% |
| 15-16 September | 52% | 38% | 48% |
The 2-year Treasury yield at 4.42% now trades above the upper bound of the effective federal funds rate (3.50-3.75%), a market signal that, per Yardeni Research, suggests policy may still be insufficiently restrictive.
The data that could still change the picture
The April PCE release is the single most important upcoming data point. If it confirms the pipeline pressure embedded in April’s PPI, even September cut odds may erode further. Deutsche Bank’s Henry Allen holds the minority view that if PCE surprises to the downside, the transitory narrative could partially revive. That remains a low-probability scenario given the breadth of the April inflation data.
The inflation reacceleration story is bigger than one report
April’s PPI did not arrive in isolation. It landed on top of weeks of corroborating data, all pointing in the same direction:
- April CPI: +0.4% MoM, +3.5% YoY (shelter at +0.4% MoM, persistently sticky)
- ISM Manufacturing Prices Paid: 62.4, highest since October 2025
- ISM Services Prices Paid: 61.8, up sharply from 58.2 in March
- Inflation above target: The Fed’s 2% target has been exceeded for five consecutive years, according to Yardeni Research
Structural forces underpin the stickiness. The ongoing AI infrastructure buildout continues to generate inflationary pressure in energy and industrial inputs. Shelter costs remain resistant to the rate increases already delivered. Services inflation has proven difficult to dislodge.
Counterarguments exist but carry less weight in the current data environment:
- Moderating wage growth offers partial relief on labour cost pass-through
- Productivity gains from technology adoption are containing unit labour costs
- Long-run inflation expectations remain anchored, limiting self-fulfilling spiral risk
The hashtag #NoRateCuts2026 was trending on X with approximately 45,000 posts as of 14 May, reflecting retail sentiment that has converged with Wall Street’s analytical consensus.
A genuine pivot back toward cuts would require multiple months of decelerating inflation across PPI, CPI, and PCE simultaneously. That has not materialised.
The rate cut window has narrowed to a question of when, not if, the Fed acknowledges it
The accumulated weight of April’s inflation data points toward a single conclusion: the 16-17 June FOMC meeting will almost certainly confirm a policy shift away from easing bias, and the rate path now depends on whether inflation softens through summer.
Rather than betting on a specific date for the first cut, investors can monitor three signposts in sequence:
- April PCE release: The next confirmation or contradiction of April’s PPI pipeline pressure
- June FOMC statement language: Whether the Fed formally drops its easing bias, signalling a sustained higher-for-longer posture
- July meeting probabilities: Whether September cut odds hold at 48% or erode further as data arrives
The most actionable framework is not a rate prediction. It is the inflation data sequence itself: PPI leads PCE, PCE leads Fed language, and Fed language leads rate decisions. The June meeting will tell investors whether this is temporary recalibration or the opening chapter of a prolonged higher-for-longer environment.
For investors who want to move from the data picture to portfolio action, our dedicated guide to bond investor repositioning covers how PIMCO, BlackRock, and other major fixed income managers are targeting 3-5 year duration, overweighting TIPS and investment-grade credit, and why 62% of bond investors surveyed by Bank of America have already shortened duration in response to the no-cut consensus.
This article is for informational purposes only and should not be considered financial advice. Investors should conduct their own research and consult with financial professionals before making investment decisions. Past performance does not guarantee future results. Financial projections are subject to market conditions and various risk factors.