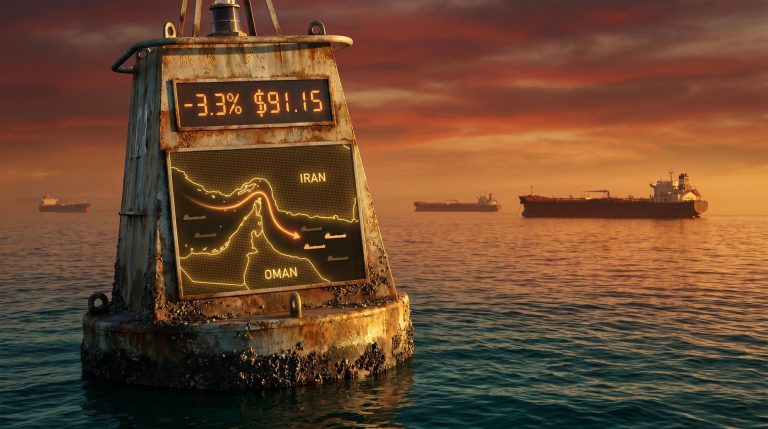
Brent Falls 3.3% as Trump Signals Imminent Iran Peace Deal
2 hrs ago

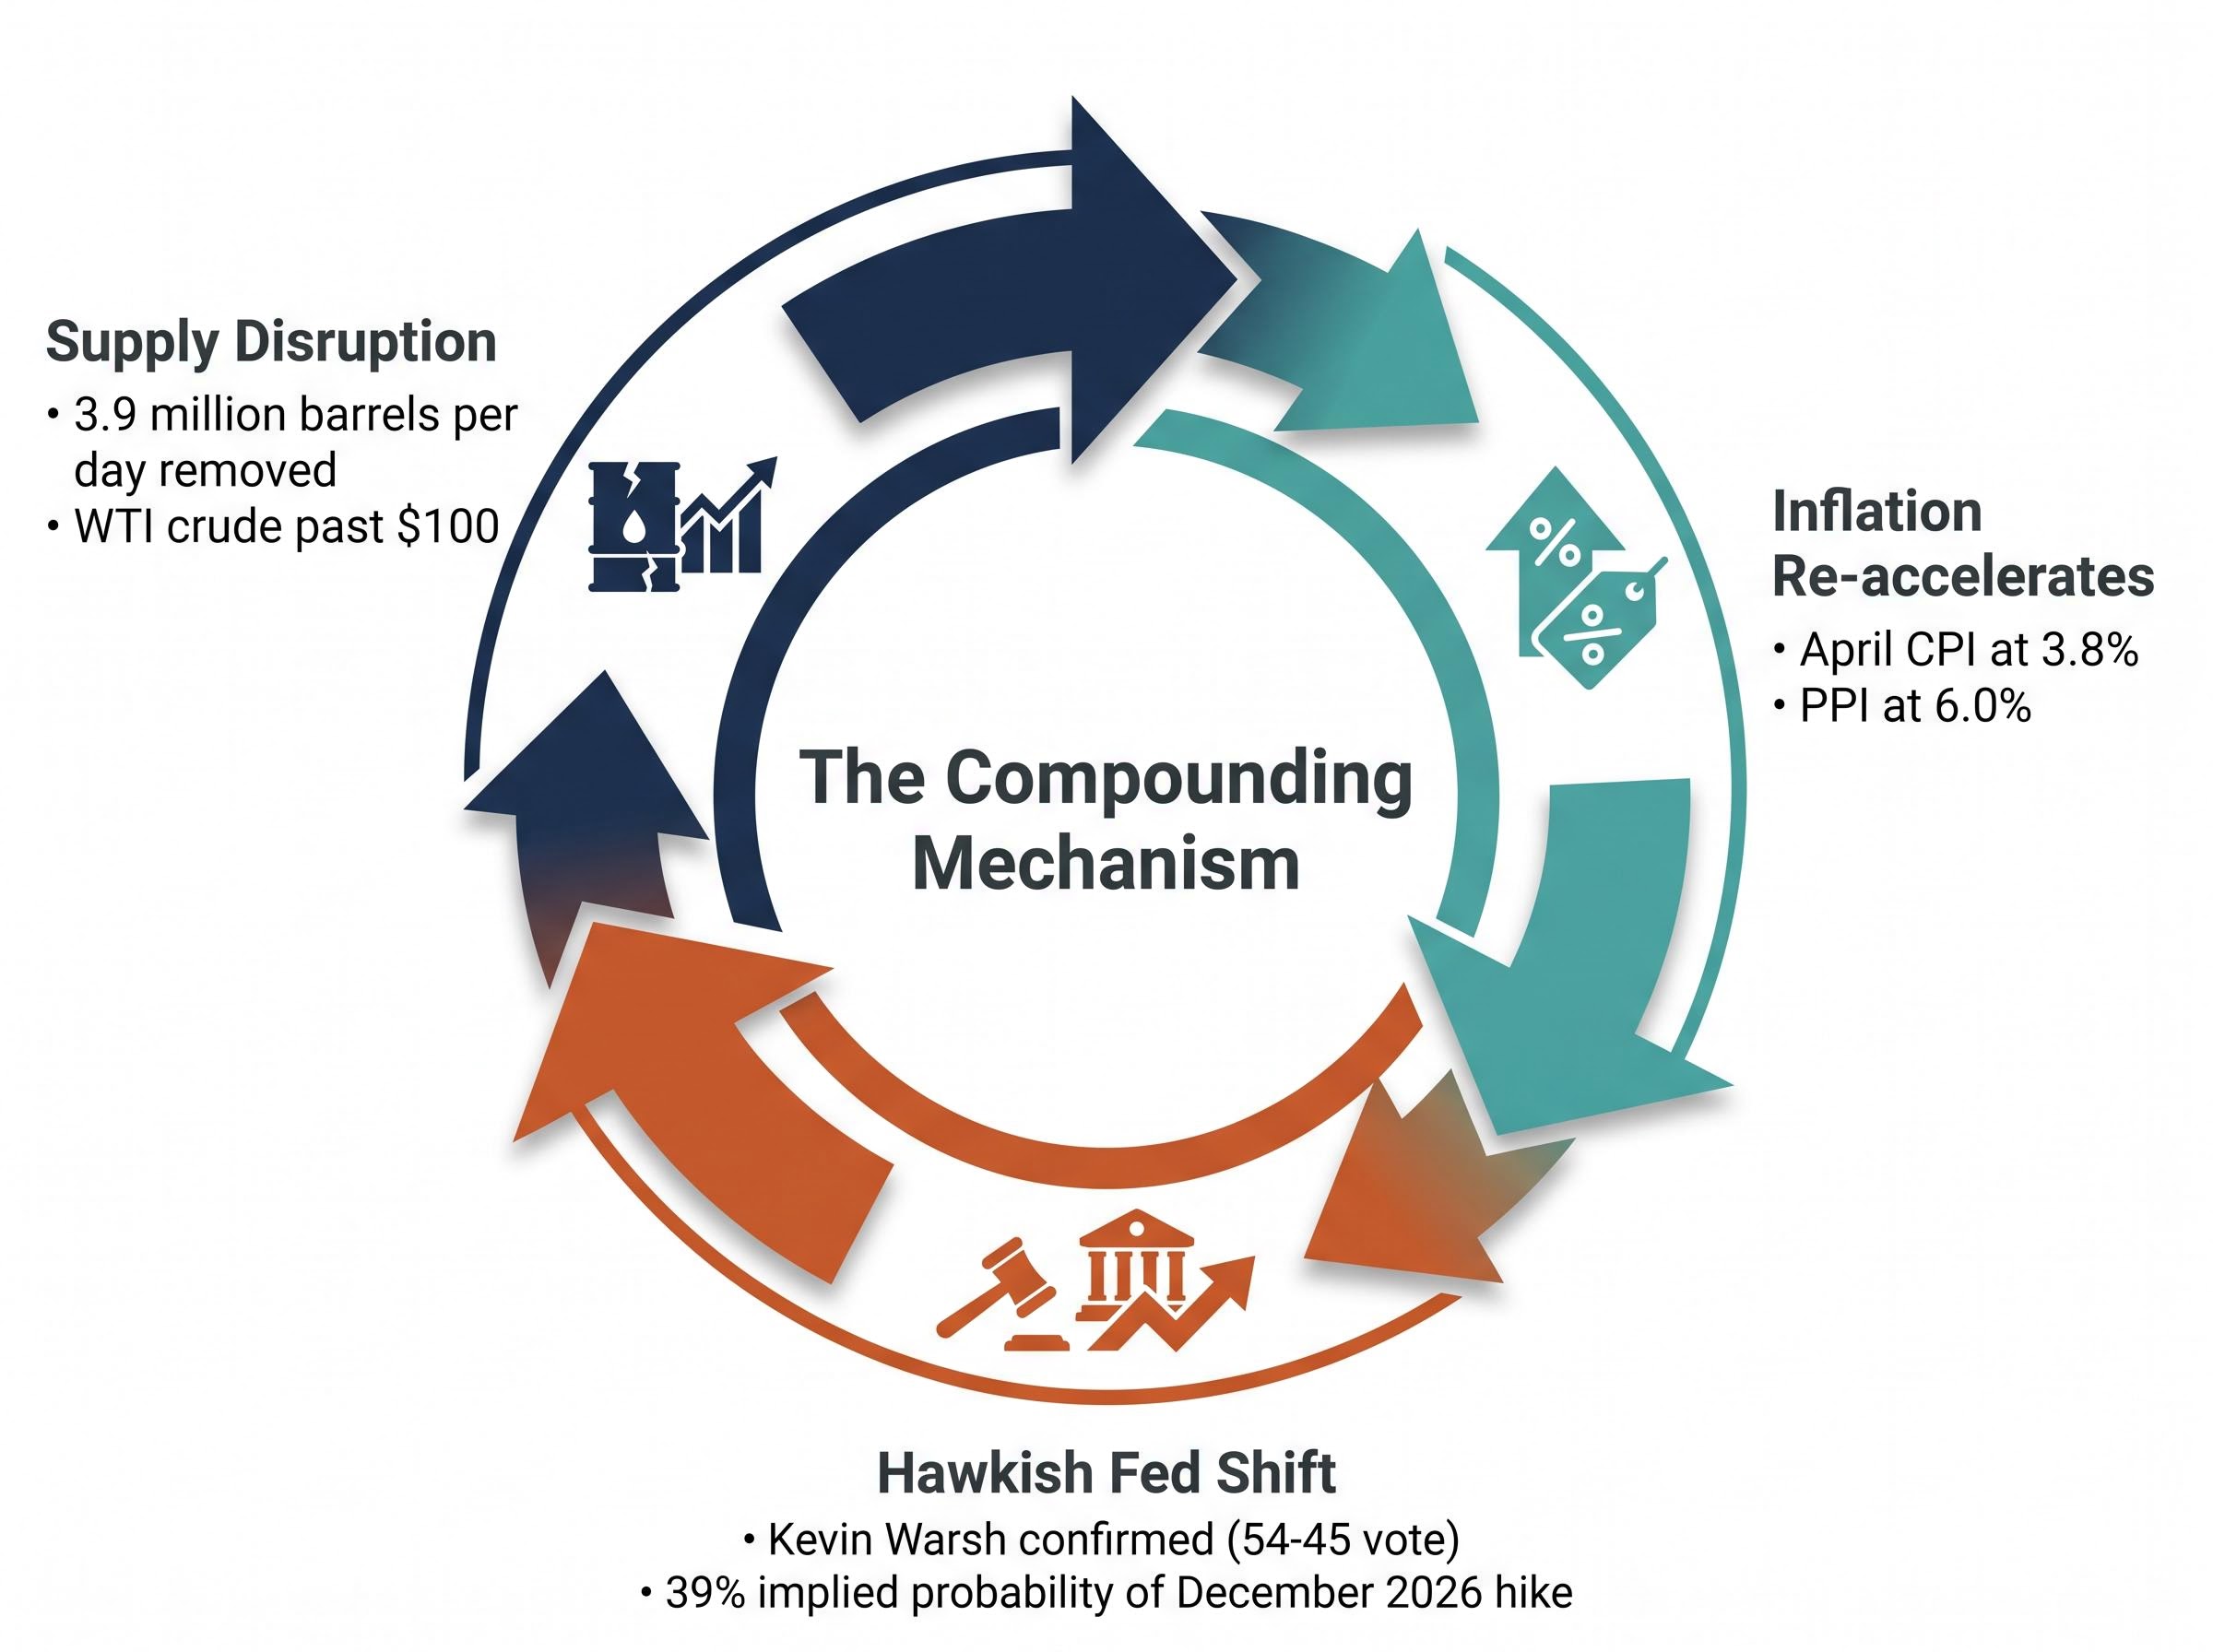
Three events landed within days of each other in mid-May 2026, and together they have reshaped the US interest rate outlook for the remainder of the year. A war in the Middle East pushed crude oil past $100 a barrel. Wholesale prices surged to their highest level since late 2022. And the Senate confirmed Kevin Warsh as the next Federal Reserve Chair by a vote of 54-45. Each shock, taken alone, might have been absorbed as a transient signal. Together, they form a feedback loop that has functionally closed the door on rate cuts in 2026, pushed 20- and 30-year Treasury yields above 5%, and placed a 39% implied probability of a rate hike on the December 2026 options board. What follows traces how each shock connects to the next, what the combined repricing means for bond and equity investors, and why the stakes are higher than any single data point suggests.
The mechanics are concrete. The halt of exports from Iran’s Kharg Island terminal, combined with persistent constraints on transit through the Strait of Hormuz, removed approximately 3.9 million barrels per day from global supply. The International Energy Agency characterised the disruption as the largest single loss to global oil supply in decades.
The Iran conflict’s oil price trajectory from a $72-$74 pre-conflict baseline to a peak of $126 per barrel compressed months of supply disruption mechanics into weeks, with the Strait of Hormuz closure simultaneously removing roughly 20% of global seaborne oil flows and triggering a Minneapolis Fed estimate of six months for supply chains to fully normalise even under a best-case reopening scenario.
The IEA described the Kharg Island export halt, combined with Strait of Hormuz constraints, as the largest single disruption to global oil supply in decades, with tight market conditions projected to persist for at least one to two years.
WTI crude sat at approximately $101.56-$102.93 as of 13 May 2026. The futures curve showed moderate backwardation, a structure that signals traders expect tightness to persist rather than resolve quickly. But the oil price itself is only the first link in the chain. The transmission runs through:
April 2026 CPI confirmed the pass-through: 3.8% year-on-year, up from 3.3% in March, with a 0.6% monthly gain. PPI final demand energy rose 7.8% over the period. The Pentagon’s cost estimate for the Iran conflict was revised upward to $29 billion from $25 billion, and New York Times reporting from 12 May 2026 noted Iran retains approximately 70% of its missile stockpile and access to 30 of its 33 missile sites along the Strait. Investors pricing in a quick energy retreat are working against the IEA’s baseline, not with it.
For most of early 2026, the prevailing narrative was disinflation. That narrative ended on the day the April PPI landed.
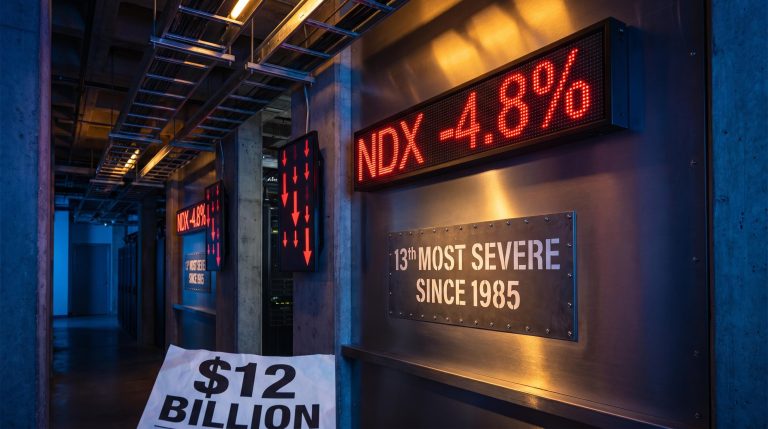
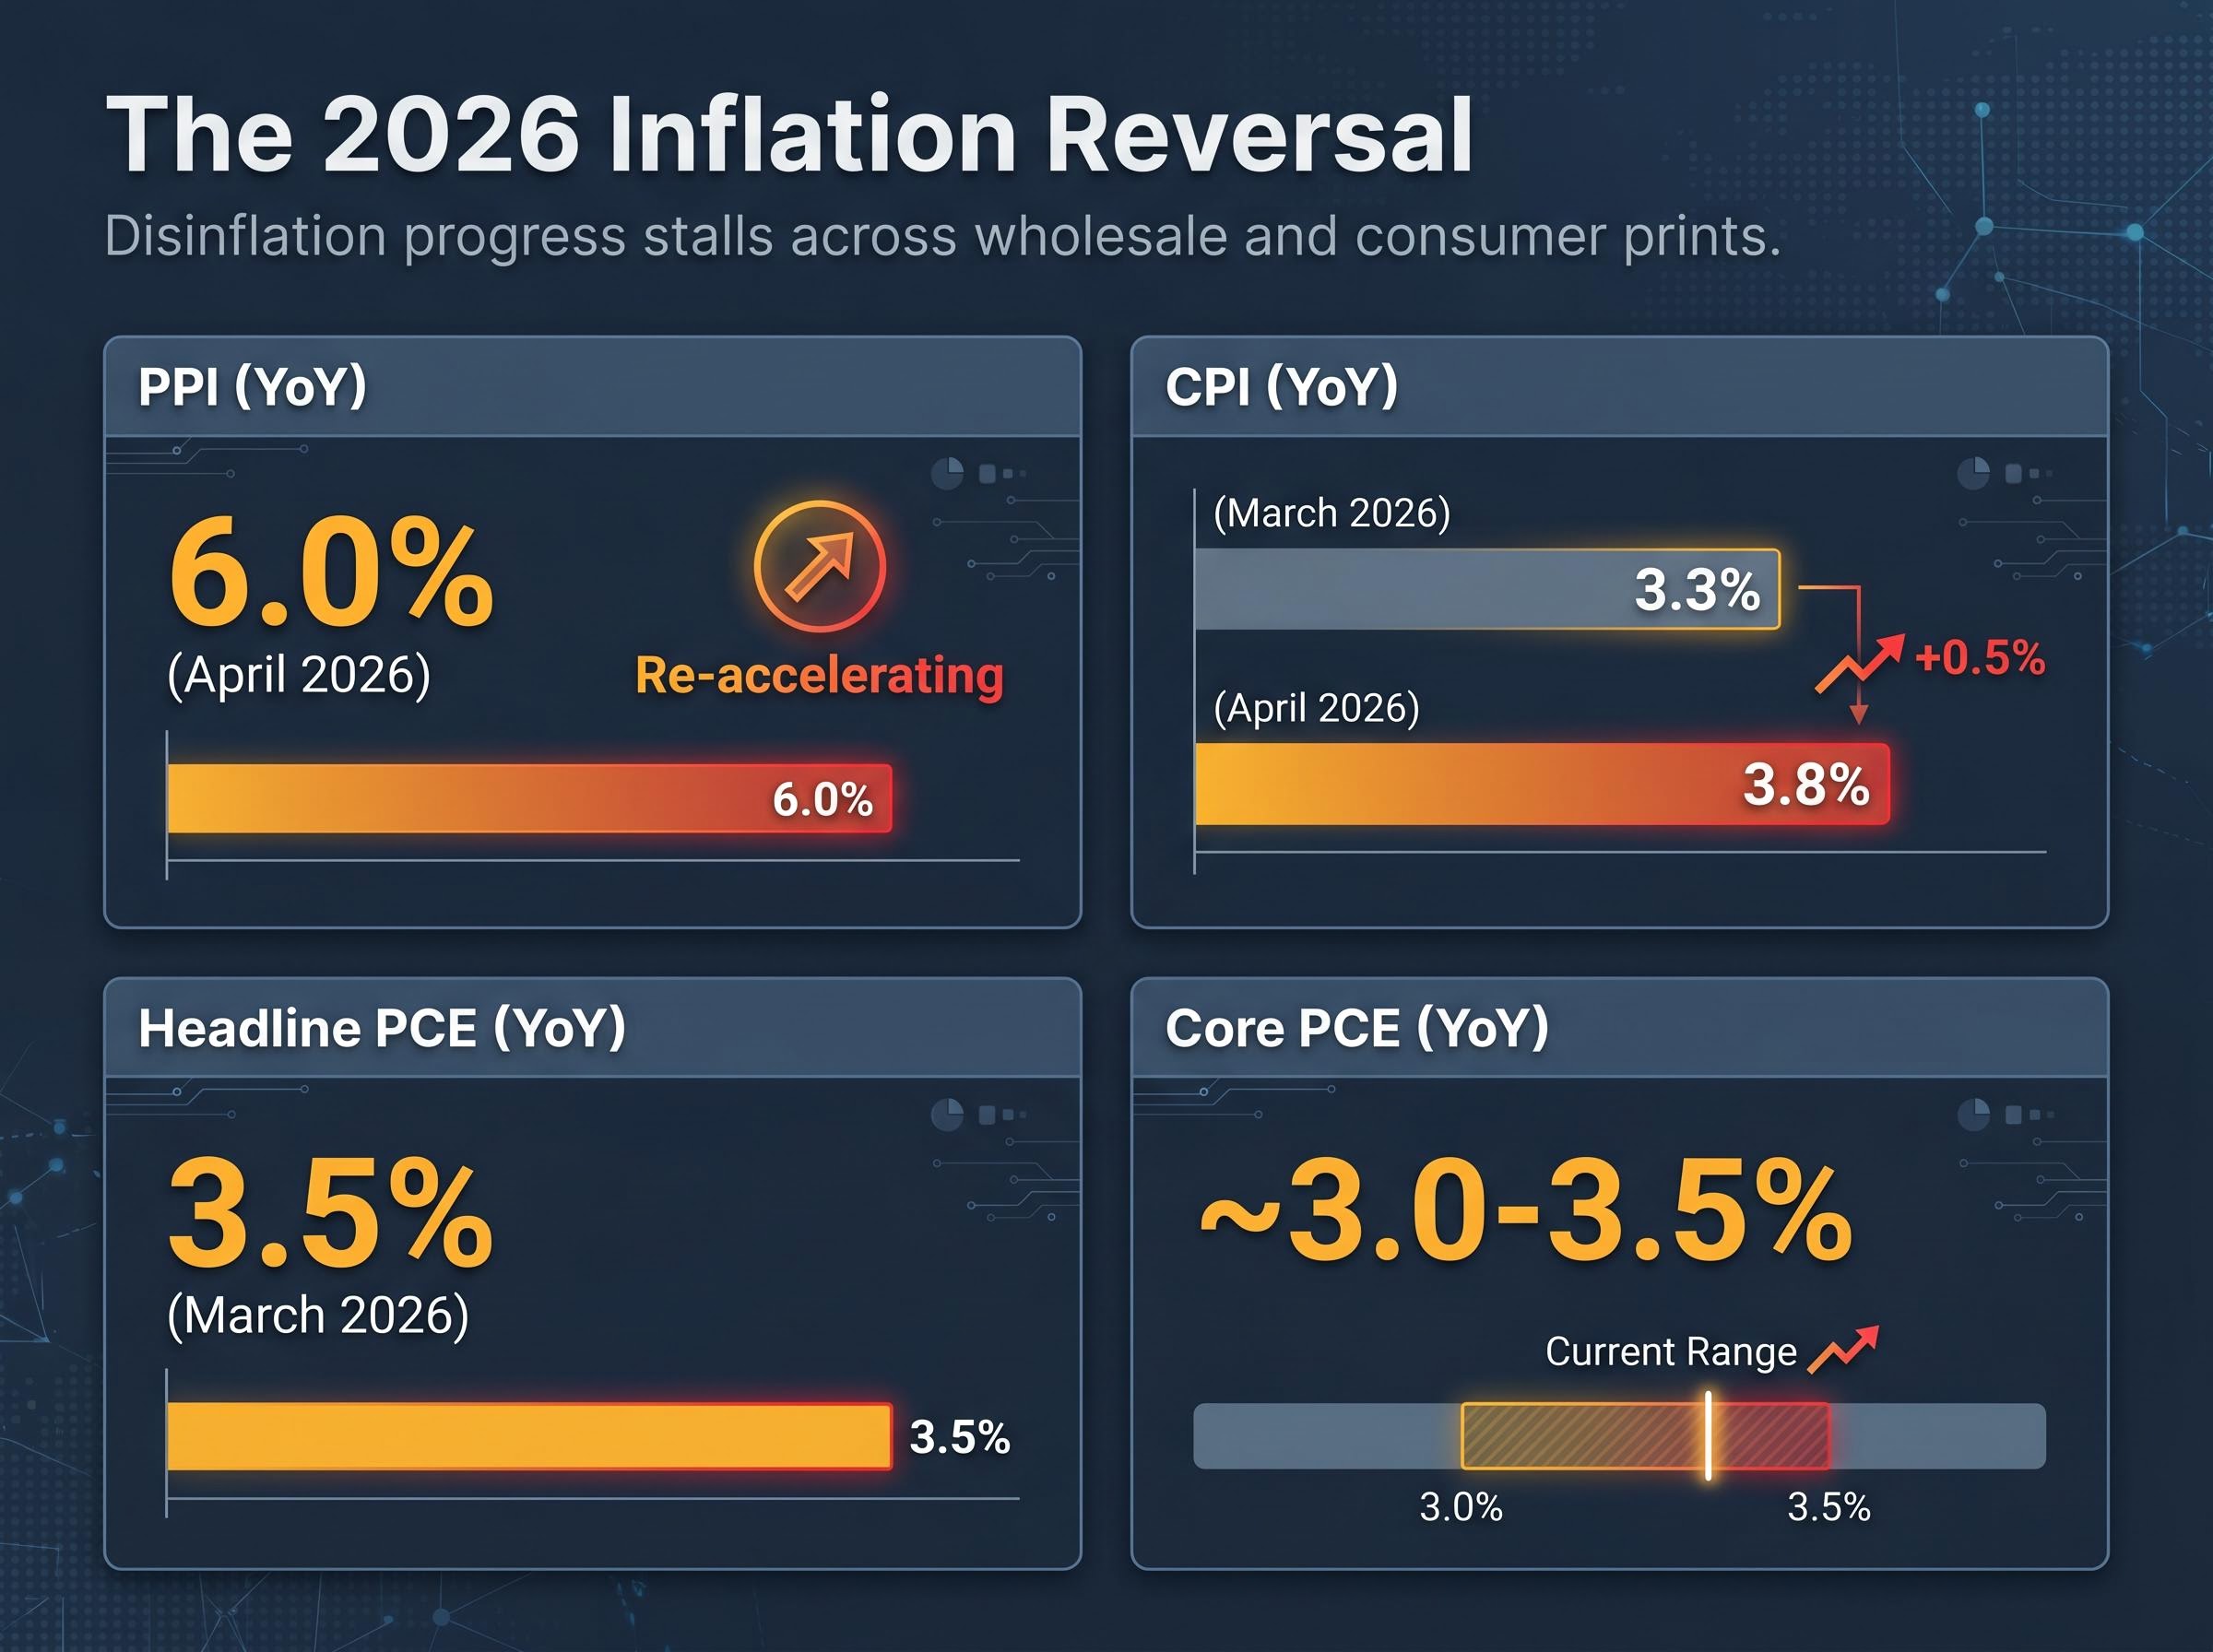
The reading came in at 6.0% year-on-year, the highest since December 2022, with a 1.4% month-on-month gain. Energy drove the headline, but the breadth of the print matters more than the composition. Producer prices function as a leading signal for consumer prices; wholesale cost pressures take weeks to months to pass through to the goods and services households pay for. A 1.4% monthly gain in a single reading is the kind of print that alters central bank calculus.
Corporate margin absorption is functioning as a partial firewall between upstream energy costs and consumer prices: major consumer goods companies including Procter and Gamble, Nike, and Hasbro are compressing gross margins by an estimated 150 basis points rather than raising shelf prices at 2022 rates, a dynamic that has so far limited the retail pass-through of the roughly 11% aggregate petrochemical cost increase to approximately 20%.
The BLS Producer Price Index methodology tracks price changes received by domestic producers for their output, capturing cost pressures at the wholesale level before they migrate into the consumer-facing data the Fed formally targets, which is why a 1.4% monthly gain carries forward-looking significance beyond the headline number itself.
The PPI did not arrive in isolation. March 2026 headline PCE had already risen to 3.5% year-on-year, the highest since May 2023. Core PCE was running at approximately 3.0-3.5%, with progress toward the Fed’s 2% target effectively stalled. The disinflation story was not just pausing; it was reversing.
| Indicator | Prior Reading | Current Reading | Direction |
|---|---|---|---|
| PPI (YoY) | Lower (pre-April 2026) | 6.0% (April 2026) | Re-accelerating |
| CPI (YoY) | 3.3% (March 2026) | 3.8% (April 2026) | Rising |
| Headline PCE (YoY) | Lower (prior months) | 3.5% (March 2026) | Rising |
| Core PCE (YoY) | ~3.0% | ~3.0-3.5% | Stalled |
The bond market read it the same way. Rate-cut pricing for the remainder of 2026 collapsed to near zero. The implied probability of a December 2026 rate hike rose to approximately 39% after the release. For fixed-income investors, this was the data point that moved the market, not the geopolitical headline.
The Senate confirmed Kevin Warsh as Federal Reserve Chair on 13 May 2026, with Jerome Powell’s chairmanship expiring approximately 23 May 2026. The vote was 54-45. What matters for markets is not the politics of the confirmation but the policy archetype it installs.
Warsh’s record is the evidence base. During 2010-11, he advocated earlier monetary tightening during the post-financial-crisis recovery, publicly criticising the Fed for maintaining excessively accommodative policy. Strategists at JPMorgan, Bank of America, and Citi have consistently framed the distinction in specific terms.
The prevailing market view: Powell was prepared to tolerate 2.5-3% inflation for longer in order to preserve the expansion; Warsh is perceived as more of a pre-emptive hawk, willing to tighten even into a slowing economy if inflation expectations show signs of drifting.
Several sell-side desks have begun projecting a higher effective neutral rate, with strategy notes referencing language around “re-anchoring around 3% nominal.” The shift is not speculative. It is already embedded in pricing.
The current implied probability distribution tells the story: a 71.5% probability of the Fed holding rates through end-2026, approximately 39% implied probability of a December hike, and near-zero cuts priced for the remainder of the year. JPMorgan, BofA, and Citi are now treating December 2026 as a live meeting for a potential hike.
This repricing preceded the PPI data and accelerated after it. The Warsh confirmation and the inflation readings are compounding rather than operating as separate signals. Under Powell, the market assumption was that the Fed would ease at the first sign of labour market softness. Under Warsh, the assumption is that the Fed will hike if inflation expectations drift, even into a slowing economy. That asymmetry shift is the single most consequential change in the rate outlook.
The analytical centre of this analysis is that the three forces are not merely coincident. They are structurally reinforcing, and the compounding runs in one direction.
The oil supply normalisation timeline extends well beyond the current conflict because the IEA’s 400 million barrel emergency release covers only approximately four weeks of the 100 million barrel weekly supply deficit, a gap that government policy alone cannot bridge and that Saudi Aramco’s CEO has characterised as a problem potentially extending into 2027.
The 5% crossing in 20- and 30-year Treasuries is not simply a rate level. It is a term-premium re-rating, reflecting uncertainty about the inflation regime under the incoming Chair.
The 10-year Treasury yield reached approximately 4.42-4.49%, briefly touching 4.50% intraday on 14 May 2026, the highest since July 2025. The 20-year yield sat at approximately 5.02-5.04% and the 30-year at approximately 5.04-5.05%. Dallas Fed and regional Fed presidents have been particularly vocal about the energy-to-inflation transmission channel, framing energy shocks as events that “cannot be fully accommodated without risking expectations drift.”
Investors modelling each of these shocks as separate, mean-reverting events may significantly underestimate how long this repricing lasts.
NBER research on oil price shocks and monetary policy provides empirical evidence that the transmission from crude prices to consumer inflation is amplified when monetary policy is simultaneously loose, a dynamic that makes the current combination of supply disruption and policy leadership transition materially different from isolated energy shocks in prior cycles.
The response is not a consensus trade. It is a genuine tactical divide, and where an investor sits depends on time horizon and liability profile.
| Asset Class | Tactical Stance | Strategic Stance | Rationale |
|---|---|---|---|
| Long bonds (20-30yr) | Reducing duration | Selectively adding at 5% | Tactical: further yield upside risk. Strategic: real yields meaningfully positive, attractive for liabilities |
| Equities (energy) | Overweight | Overweight | Direct beneficiary of $100+ crude; sector up ~15-20% YTD vs broader market |
| Short-duration fixed income | Overweight | Overweight | Treasury bills, short IG corporates, floating-rate notes offer carry with limited price risk |
| TIPS / inflation linkers | Adding | Adding | Direct hedge against sustained energy-led inflation |
| Commodities | Overweight (10-15%) | Overweight (10-15%) | Supply constraints and geopolitical risk support allocation as inflation hedge |
On the bond side, PIMCO, BlackRock, and Vanguard active funds have reportedly reduced long-end duration in 20s and 30s, adopting a barbell strategy favouring short and intermediate maturities. Several fixed-income chief investment officers, quoted across CNBC, the Financial Times, and the Wall Street Journal, are calling 5% long yields a “once in a cycle” entry point for long-horizon investors, contingent on inflation eventually converging closer to 2-2.5%.
In equities, long-duration speculative growth and rate-sensitive REITs face the sharpest headwinds. Investment-grade credit is preferred over high yield, given the combination of tighter policy and slower-growth risk.
The repricing is now definitive. No cuts are priced for 2026. A meaningful hike probability sits on the December board. Long yields embed persistent inflation risk and term-premium uncertainty under a hawkish incoming Chair. The question is no longer whether the rate-cut story has ended, but what determines whether 2027 brings relief or further tightening.
Three variables will decide:
Fed officials have framed the energy disruption as a “relative price shock” that cannot be fully accommodated without risking expectations drift, language that signals limited room for policy forbearance regardless of who holds the Chair.
The period between now and Warsh’s first policy decision is a live experiment. The answer will define the investment environment for the next 18 months. Investors positioning for binary outcomes, either a swift return to cuts or an inevitable hike cycle, may find that the uncertainty itself is the condition they need to hold in portfolios.
Investors tracking the reliability of the current implied probability distribution will find our full explainer on Fed dissents and the rate outlook covers the April 29 FOMC vote in detail, including how four-way dissent across both hawkish and dovish directions reduces the committee’s ability to anchor market expectations through forward guidance, a dynamic that adds an additional source of uncertainty to the 71.5% hold probability and the 39% December hike probability currently priced.
This article is for informational purposes only and should not be considered financial advice. Investors should conduct their own research and consult with financial professionals before making investment decisions. Past performance does not guarantee future results. Financial projections are subject to market conditions and various risk factors.
As of mid-May 2026, rate cuts are effectively off the table for the remainder of the year, with near-zero cut probability priced in and approximately a 39% implied probability of a December 2026 rate hike, driven by resurging inflation and Kevin Warsh's confirmation as Fed Chair.
The halt of roughly 3.9 million barrels per day from Iran's Kharg Island terminal pushed WTI crude above $100 per barrel, feeding directly into energy, transportation, food, and fertiliser costs, which contributed to April 2026 CPI reaching 3.8% year-on-year and PPI hitting 6.0%, both signals that complicate any Fed pivot toward rate cuts.
Kevin Warsh was confirmed as Federal Reserve Chair by a 54-45 Senate vote on 13 May 2026, replacing Jerome Powell; markets perceive Warsh as a pre-emptive hawk willing to raise rates even into a slowing economy if inflation expectations show signs of drifting, shifting the Fed's reaction function materially from the Powell era.
Long-end Treasury yields crossed the 5% threshold because bond markets are pricing in persistent inflation risk and term-premium uncertainty under an incoming hawkish Fed Chair, with the 20-year yield at approximately 5.02-5.04% and the 30-year at approximately 5.04-5.05% as of mid-May 2026.
Major asset managers including PIMCO, BlackRock, and Vanguard have reduced long-end duration in favour of short and intermediate maturities, while equity allocators are overweighting energy stocks (up roughly 15-20% year-to-date), adding TIPS, and maintaining a 10-15% commodities allocation as an inflation hedge.