Why AI Makes Markets Safer Daily but Riskier in a Crisis
42 mins ago

WiseTech Global has shed nearly half its market value since 1 January 2026, pushing its price-to-sales ratio to 11.79x. For a stock that has historically traded at more than 31x sales, that compression raises an obvious question: is this a rare entry point or a warning signal?
The selloff is not a single event. It is the product of overlapping forces: an ASIC and AFP investigation into the company’s founder, a major acquisition that replaced organic growth with integration complexity, slowing earnings, and a sector-wide de-rating of high-multiple ASX tech names. Each of these forces is pulling the stock lower independently. Together, they have created a valuation level not seen in five years.
What follows is a walk through WiseTech’s financial metrics, the structural reasons for the selloff, and the specific questions an investor needs to answer before treating the current price as an opportunity rather than a trap.
The decline did not arrive in one blow. It compounded across three distinct forces, each making the next one land harder.
The mechanism driving this sector-level repricing is multiple compression, where falling investor willingness to pay for future earnings reduces share prices even when underlying earnings forecasts hold steady or improve, which is precisely why WiseTech’s forward EPS estimates rising does not automatically translate into a recovering share price.
“From peak to trough, WiseTech shares fell roughly 70%, with multi-year lows recorded as recently as May 2026.”
As of 14 May 2026, the year-to-date decline stood at approximately 46.70%. Understanding that these causes resolve on different timescales matters: an investor who treats this as a single-event overshoot may be caught off-guard by how many independent headwinds remain active.
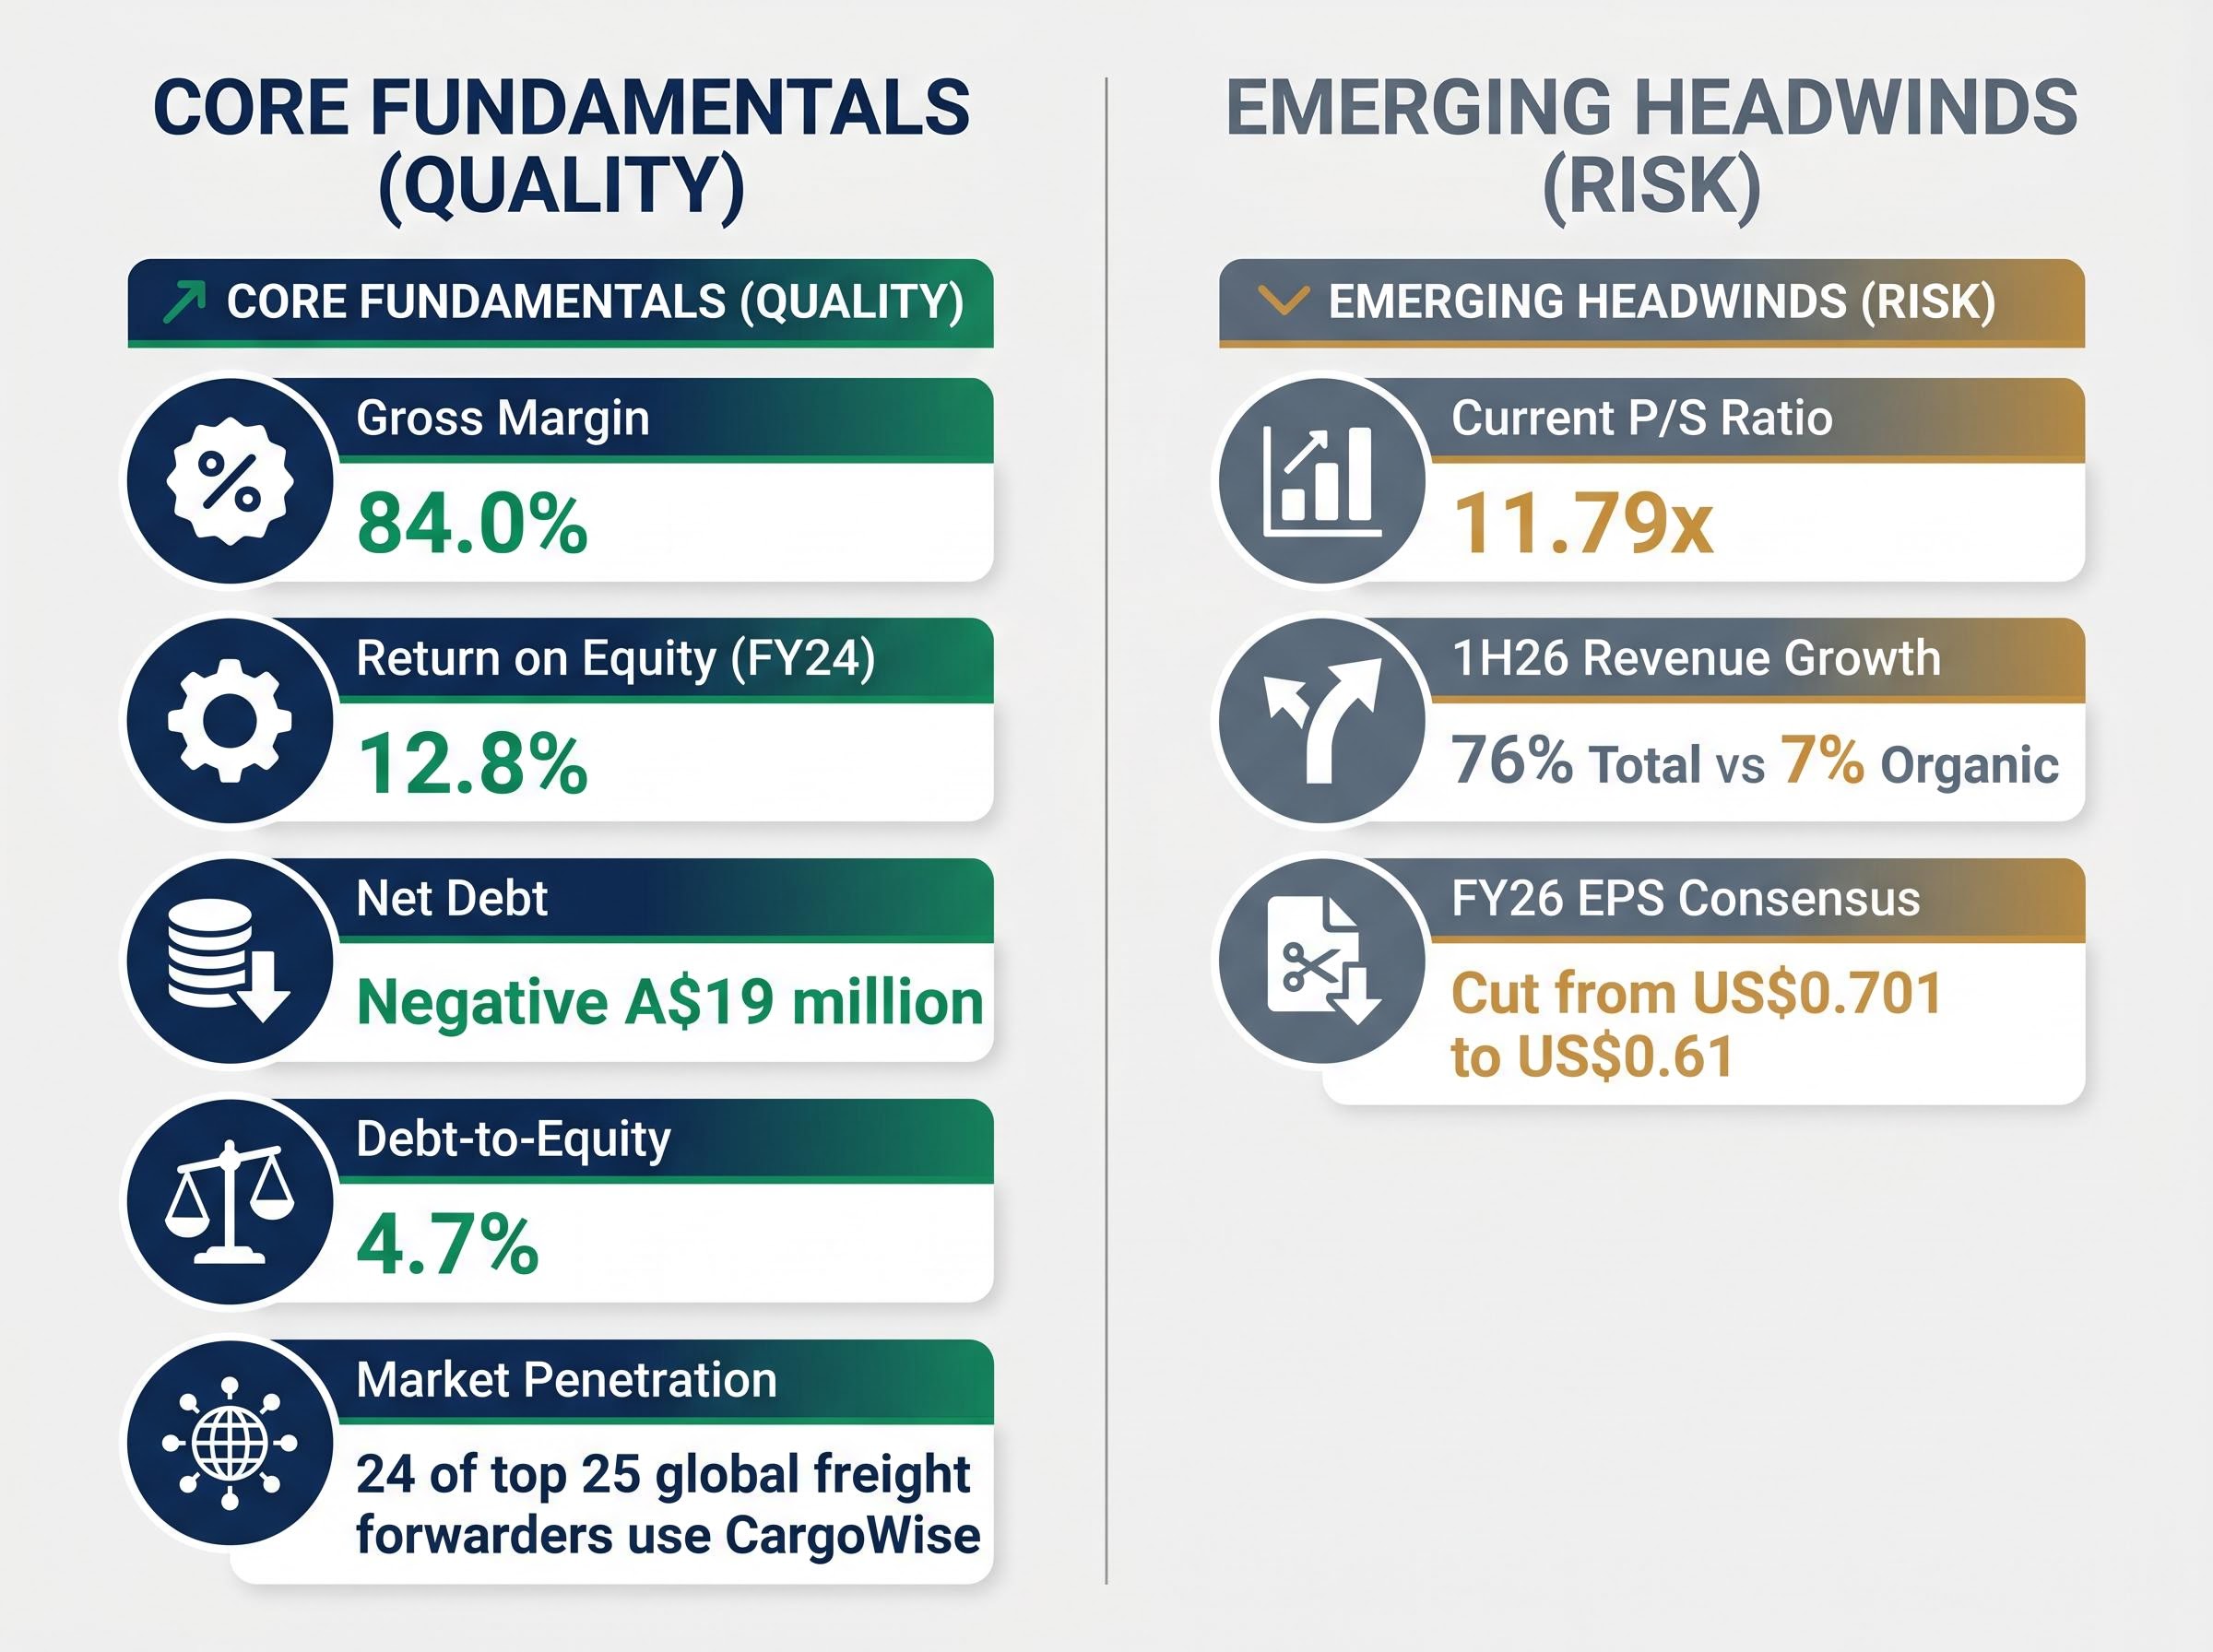
The most quoted figure in the WiseTech debate is its price-to-sales ratio. At 11.79x, it sits more than 60% below a five-year average of 31.86x. That sounds dramatic, and it is. But no single number tells the full story for a business like this.
The price-to-sales (P/S) ratio divides a company’s market capitalisation by its annual revenue. It is commonly used for software businesses that are still scaling toward peak profitability, because earnings-based ratios can understate the value of fast-growing companies reinvesting heavily. The limitation is that P/S ignores costs entirely; a company with thin margins and one with 84% gross margins can carry the same P/S but represent fundamentally different propositions.
That 84% gross margin figure is where WiseTech’s core product quality shows. Gross margin measures the percentage of revenue remaining after subtracting the direct costs of delivering the product. At 84%, the vast majority of every dollar earned from CargoWise licensing flows through to cover operating expenses and generate profit, before overhead and investment spending are applied.
| Metric | WiseTech Figure | What It Measures | Why It Matters |
|---|---|---|---|
| P/S ratio | 11.79x (vs 31.86x five-year avg) | Market cap relative to annual revenue | Gauges how much investors pay per dollar of sales; ignores profitability |
| Gross margin | 84.0% | Revenue remaining after direct product costs | Signals core product efficiency before overhead |
| Return on equity (ROE) | 12.8% (FY24) | Net profit generated per dollar of shareholder equity | Measures capital conversion efficiency |
| Net debt | Negative A$19 million | Total debt minus cash holdings | Negative figure means cash exceeds debt; provides buffer |
| Debt-to-equity | 4.7% | Total debt as a proportion of shareholder equity | Confirms minimal leverage risk |
A negative net debt figure means cash holdings exceed total debt. For WiseTech, that negative A$19 million position provides a financial buffer during uncertainty, though it also invites questions about whether capital is being deployed aggressively enough to support the growth narrative.
The 4.7% debt-to-equity ratio confirms the business is not leveraged in a way that creates solvency risk, even under a prolonged integration period with e2open. These balance sheet metrics do not solve the growth question, but they do remove one category of risk from the equation entirely.
Behind the governance fog sits a product with genuine competitive depth. CargoWise, WiseTech’s core logistics execution platform, is embedded in the operations of the world’s largest freight forwarders:
That level of market penetration creates durable switching costs. Replacing a logistics execution platform is not a software purchase decision; it is an operational upheaval that freight companies are reluctant to undertake.
Morningstar’s wide moat rating on CargoWise reflects precisely this dynamic: the cost and operational disruption of switching platforms are high enough that freight forwarders treat the software as infrastructure rather than a discretionary tool, and that stickiness persists independently of the governance and integration questions weighing on the share price today.
The growth engine backing that penetration has been real. Over three years, revenue compounded at 27.1% annually, reaching A$1,042 million in the most recently reported full year. Net profit grew from A$108 million to A$263 million over the same period, a 34.5% compound annual growth rate.
“Net profit grew from A$108 million to A$263 million over three years, a 34.5% compound annual growth rate, before the current integration and governance headwinds took hold.”
The e2open acquisition adds a strategic layer: combining logistics execution (CargoWise) with planning capability (e2open) to build a more complete supply chain platform. The strategic logic is sound. The complication is what it has done to the growth profile in the interim. In 1H26, total revenue rose 76% year-on-year, but organic growth was only 7%, with the headline figure driven almost entirely by e2open consolidation. That gap between 76% and 7% is the single most important number for investors to interrogate, because it determines whether they are buying a genuine growth business or an acquisition-driven revenue roll-up.
The WiseTech FY25 results investor presentation sets out the company’s official FY26 revenue guidance of A$1.39-$1.44 billion alongside the organic versus acquisition-driven revenue breakdown, making it the primary reference for investors assessing the gap between reported and underlying growth rates.
Each of WiseTech’s active risks carries a different weight, and none of them has a clean resolution date.
The workforce reduction component of the AI transformation programme, which targets up to 2,000 roles across key teams, is expected to produce a structural reset of the cost base with material margin benefits flowing through from FY27, adding a potential earnings tailwind that consensus models are only beginning to price.
Consensus FY26 EPS estimates have been cut approximately 13%, from US$0.701 to US$0.61 per share. Simply Wall St’s aggregated fair value has been revised down from approximately A$107.32 to A$91.59.
On the session WiseTech fell 15%, high-multiple ASX SaaS peers including Xero and Megaport fell approximately 4%. WiseTech is carrying meaningfully more downside than the sector average, but the sector itself is under pressure. The ASX 200 Information Technology Index (XIJ) fell 1.56% on the day WTC hit A$39.00 and was near its own 52-week low.
Rising discount rate assumptions and investor rotation away from growth stocks represent a structural headwind that is unlikely to reverse until rate expectations shift materially.
At 11.79x trailing sales, WiseTech is at its cheapest level in five years relative to its own history. The five-year average P/S of 31.86x makes the current figure look like a 60%-plus discount.
That comparison is seductive but requires calibration. The historical average included periods of extreme market optimism for SaaS names, multiples that may not return in the current rate and sentiment environment.
The ASX SaaS de-rating has not been selective: Xero shares have fallen approximately 35% since January 2025, compressing its price-to-sales ratio to roughly 8.70x against a five-year average of 18.65x, a structural parallel that confirms the discount embedded in WiseTech’s current multiple is partly a sector phenomenon rather than a company-specific verdict.
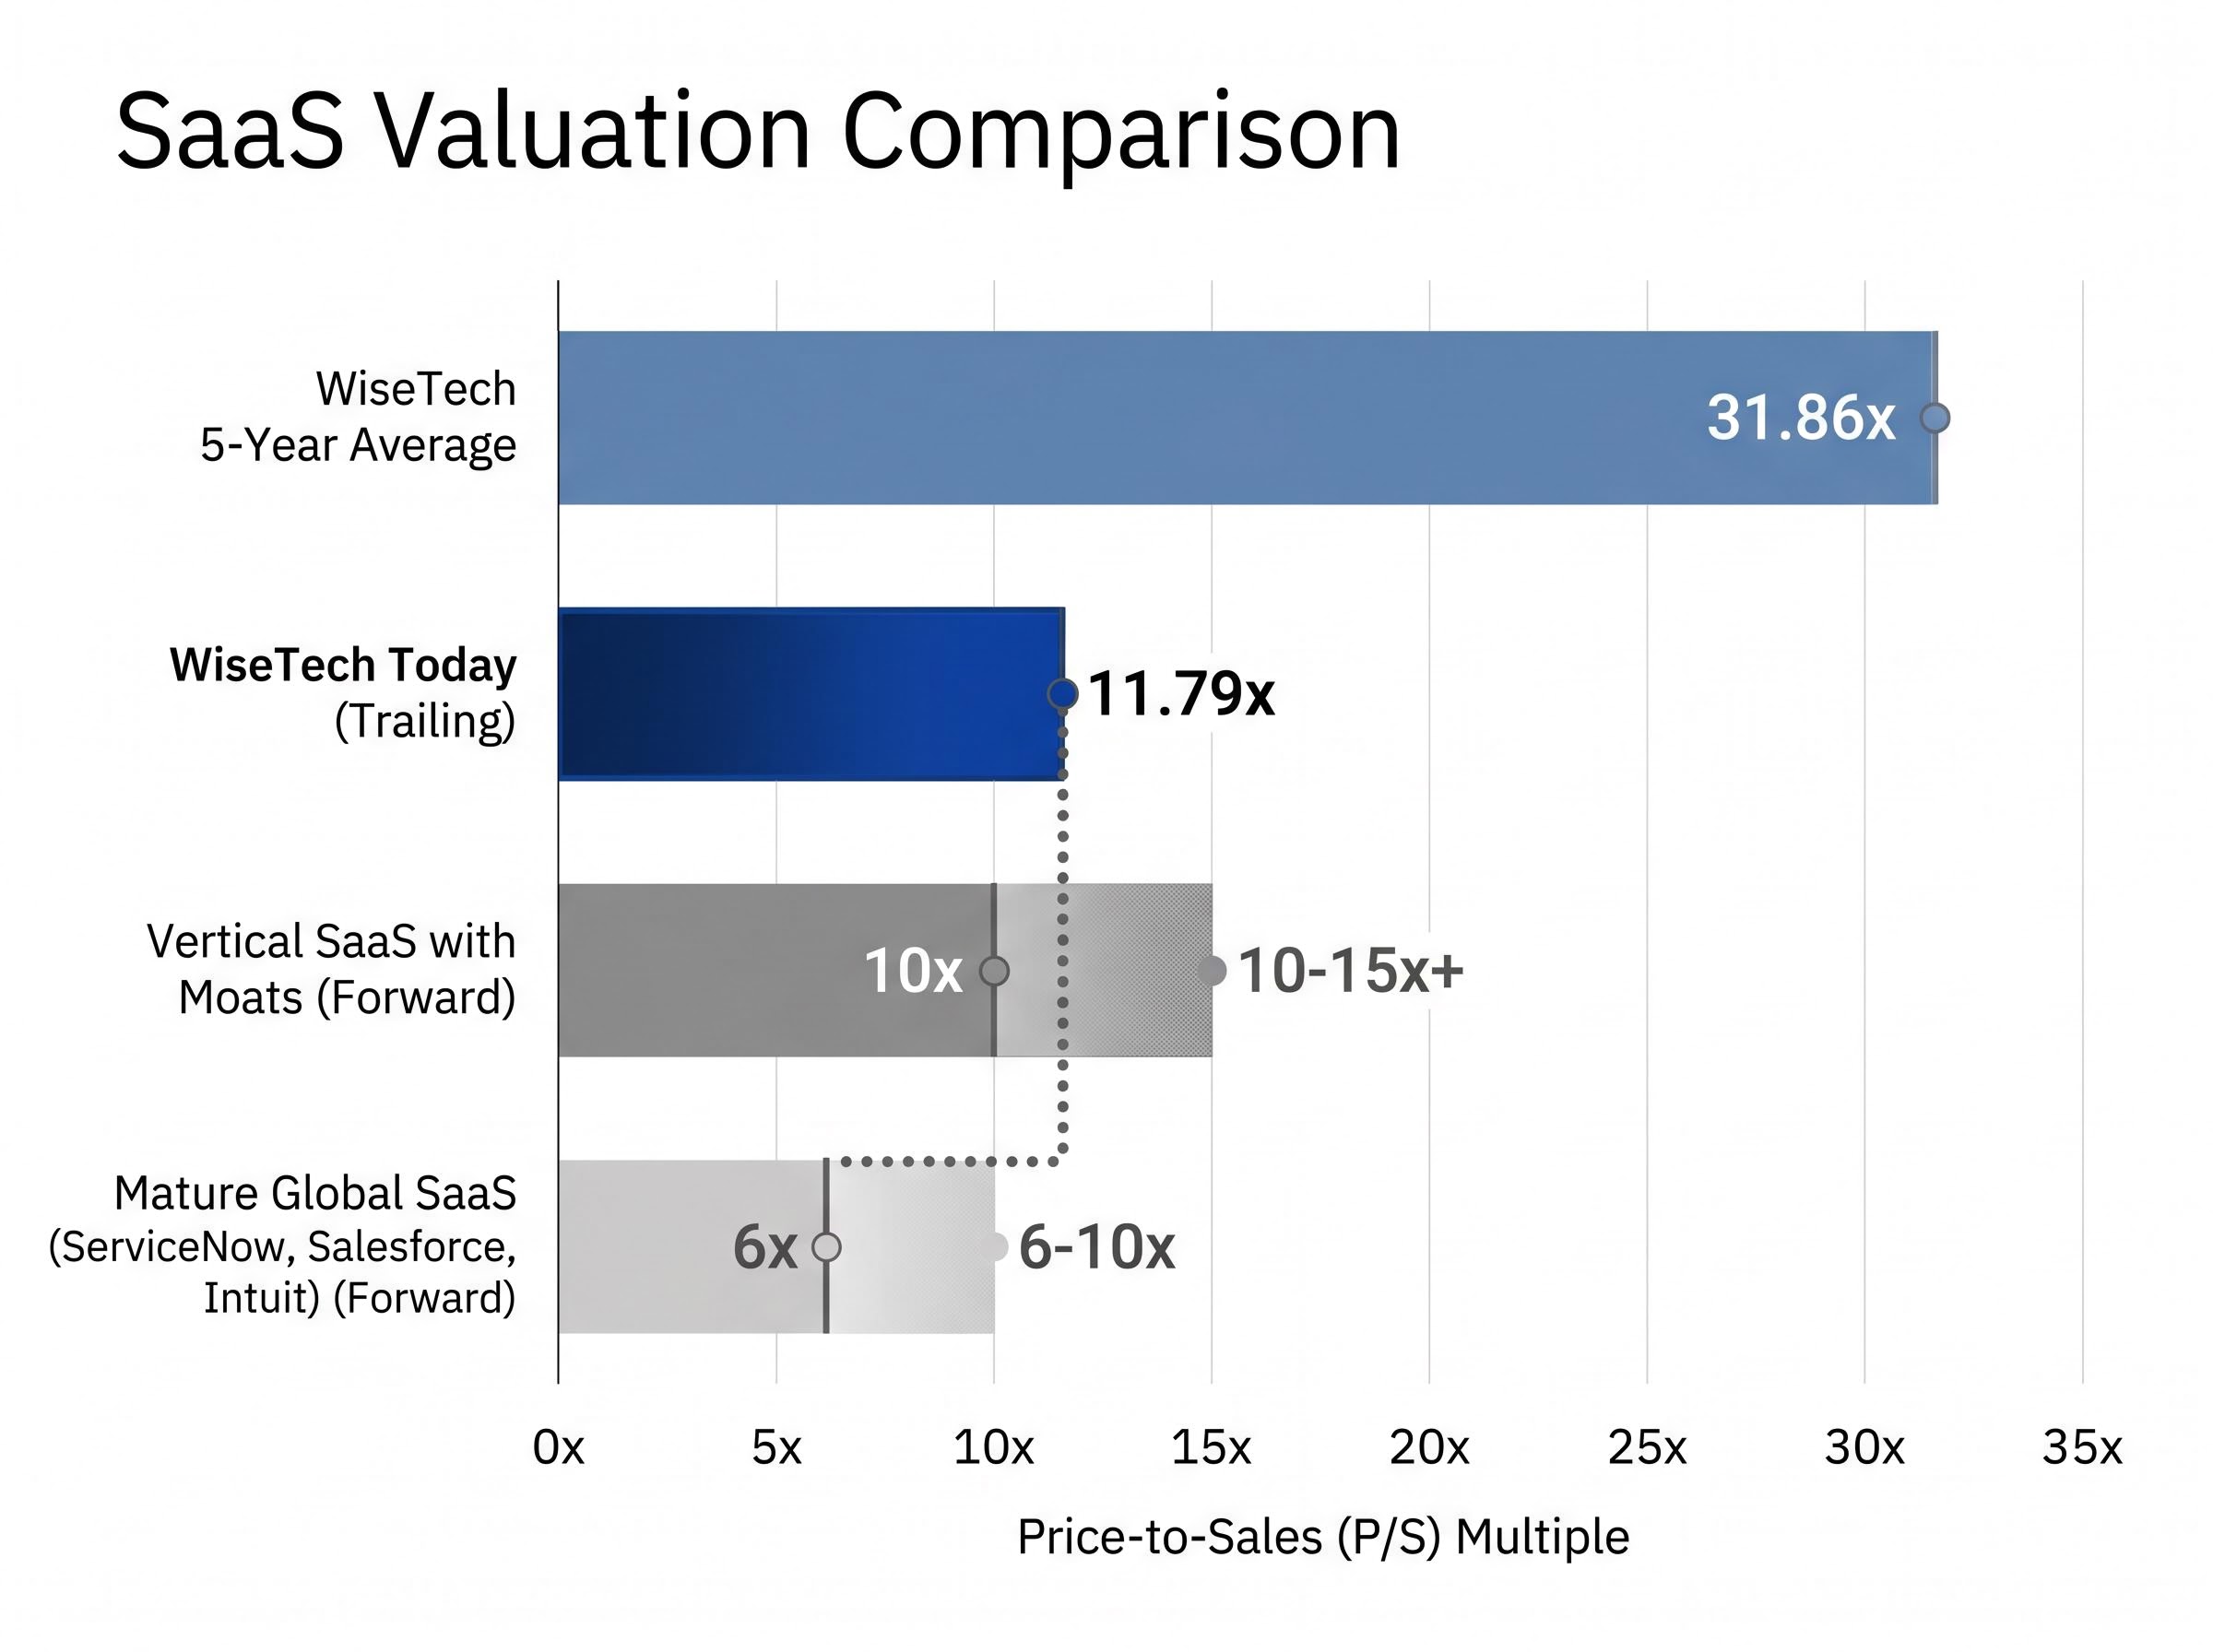
| Benchmark | P/S Range | Notes |
|---|---|---|
| WiseTech today | 11.79x trailing | Multi-year low; cheapest in five years |
| WiseTech five-year average | 31.86x | Includes peak SaaS optimism periods |
| Mature global SaaS peers (ServiceNow, Salesforce, Intuit) | 6-10x forward | Profitable, scaled businesses |
| Vertical SaaS with structural moats | 10-15x+ forward | In constructive market conditions |
Against global SaaS peers, the picture changes. Mature, high-quality SaaS businesses typically trade at 6-10x forward revenue. Best-in-class vertical SaaS companies with structural moats can reach 10-15x or higher in constructive markets. WiseTech at 11.79x trailing sales with 84% gross margins sits broadly in line with, or at a slight premium to, quality global SaaS peers on revenue multiples, but it carries meaningfully higher governance and integration risk than most of those comparables.
“At 11.79x sales, WiseTech is at its cheapest level in five years relative to its own history. Relative to global SaaS peers, it is around fair value, but carrying risks most comparable companies are not.”
Since the approximate 70% peak-to-trough decline from July 2025 to March 2026, shares have bounced roughly 20% but remain down approximately 40% over the prior 12 months as of late April 2026. The stock is not obviously cheap by global standards; it is approximately fairly valued on fundamentals alone, with the investment decision hinging almost entirely on how an investor prices the non-fundamental risks.
The WiseTech decision is less about whether the business is good (it is) and more about whether an individual investor can tolerate the specific risks attached to the current price. Before taking a position, an investor should be able to answer four questions clearly:
Simply Wall St’s aggregated DCF fair value range has walked down progressively, from approximately A$122.56 to A$91.59, reflecting updated growth and discount rate assumptions. Management has guided FY26 revenue of A$1.39-$1.44 billion. Analyst consensus remains broadly tilted toward Buy or Outperform ratings, but with materially reduced conviction and trimmed price targets.
Organic revenue growth in the 2H26 results will be the most important data point for resolving the integration narrative. Any ASIC or AFP announcements regarding the Richard White investigation could act as a catalyst in either direction. Broker price target revisions, particularly any upgrades following 2H26 results, would signal improving institutional confidence.
The bull case is real:
The bear case is equally real:
WiseTech has moved from a momentum stock to what analysts describe as a “show-me” stock. Most brokers still hold broadly positive long-term ratings, signalling the fundamental thesis is not considered broken. The investment proposition is not that the stock is cheap by global standards. It is that the upside is funded by tolerating governance and integration risk that most institutional investors are not currently willing to accept.
This article is for informational purposes only and should not be considered financial advice. Investors should conduct their own research and consult with financial professionals before making investment decisions. Past performance does not guarantee future results. Financial projections are subject to market conditions and various risk factors.
A price-to-sales ratio divides a company's market capitalisation by its annual revenue, giving investors a sense of how much they are paying per dollar of sales. For WiseTech, a current P/S of 11.79x compares to a five-year average of 31.86x, reflecting significant multiple compression driven by governance concerns, slowing organic growth, and a sector-wide de-rating of ASX SaaS names.
WiseTech shares have fallen approximately 47% year-to-date in 2026 due to three overlapping forces: an ongoing ASIC and AFP investigation into founder Richard White over alleged insider trading, a significant step-down in organic revenue growth to 7% following the e2open acquisition, and a broad repricing of high-multiple ASX technology stocks driven by rising discount rate assumptions.
In the first half of FY26, WiseTech reported total revenue growth of 76% year-on-year, but organic growth was only 7%, with the headline figure almost entirely driven by the consolidation of e2open. This gap between reported and underlying growth is the key figure investors need to monitor to determine whether the business is genuinely accelerating or relying on acquisition-driven revenue.
The investigation relates to alleged insider trading by founder Richard White and other staff, not the company itself, and no charges have been filed against WiseTech as an entity. However, the unresolved nature of the probe is sufficient for many institutional investors running governance filters to de-weight or exit the position, creating ongoing selling pressure regardless of underlying business quality.
WiseTech management has guided FY26 revenue of A$1.39 billion to A$1.44 billion, as set out in the company's official FY25 results investor presentation. Consensus analyst FY26 EPS estimates have been cut approximately 13% to reflect integration complexity and the ongoing revenue model transition to transaction-only pricing.