
Bendigo and Adelaide Bank reported a 1H FY26 net profit of $256 million, down 3% year on year. The headline figure, taken alone, tells investors almost nothing about whether the stock deserves a place in a long-term portfolio at around $10.24. With the BEN share price trading near the lower end of broker target ranges and APRA having imposed a $50 million operational risk capital charge effective 1 January 2026, investors are reassessing the bank’s risk-reward profile relative to ASX banking peers. A single earnings print cannot answer that question. Three complementary lenses, covering capital resilience, capital efficiency, and workforce quality, together provide a more complete picture of where Bendigo and Adelaide Bank sits in the competitive hierarchy. This analysis benchmarks BEN across return on equity, CET1 capital adequacy, and employee culture scores against major bank peers, and shows how to use each metric as part of a structured quality assessment framework for long-term bank investing.
Why a single earnings number is not enough to assess a bank’s quality
ASX bank investors who rely solely on net profit after tax or earnings per share miss structural differences in how efficiently and safely banks generate those earnings. BEN’s 1H FY26 NPAT of $256 million illustrates the point: a 3% year-on-year decline could signal margin compression, rising costs, or prudent capital provisioning, and the headline figure alone cannot distinguish between them. Lending income accounts for approximately 87% of BEN’s total revenue, making margin and capital efficiency metrics especially consequential.
A more durable assessment layers three metrics, each capturing a dimension the others cannot:
- CET1 ratio (capital resilience): Measures the proportion of risk-weighted assets backed by the highest-quality equity capital, indicating how well a bank can absorb losses in a stress scenario.
- Return on equity (capital efficiency): Measures profit generated per dollar of shareholder equity, revealing whether management is deploying capital productively within regulatory constraints.
- Employee culture scores (operational resilience): Capture talent risk, execution risk, and cultural health that financial ratios cannot, functioning as a leading indicator of a bank’s ability to deliver on strategic programmes.
Non-financial signals like staff culture ratings have gained credibility among long-term investors as forward-looking indicators of operational quality. Used together, these three lenses help distinguish between a structurally sound business trading at a discount and one whose discount is warranted.
When big ASX news breaks, our subscribers know first
Capital adequacy: how BEN’s CET1 buffer compares after APRA’s latest intervention
APRA’s $50 million operational risk capital charge, effective 1 January 2026, reduced BEN’s Level 2 CET1 by approximately 17 basis points. That brought the pro-forma CET1 to approximately 11.0%, the latest data point in a ratio that has been actively moving: 11.32% at June 2024, 11.00% at June 2025, 10.93% at September 2025, and 11.19% at November 2025 before the APRA charge took effect.
Placed against the four major banks, the gap is visible but structurally explained.
APRA’s quarterly ADI performance statistics for December 2025 confirm the capital adequacy, asset quality, and liquidity positions across Australian authorised deposit-taking institutions, providing the sector-wide CET1 benchmarks against which BEN’s pro-forma ratio of approximately 11.0% is measured.
| Bank | CET1 Ratio (Approx.) | D-SIB Buffer Applies | Internal Target Range | Analyst Note |
|---|---|---|---|---|
| BEN | ~11.0% (pro-forma) | No | 10.0-10.5% | Fitch expects ~11.0% for two years; negative sensitivity below 10% |
| CBA | ~12.3-12.5% | Yes | N/A | Consistently highest CET1 among majors |
| WBC | ~12.3-12.5% | Yes | N/A | Slightly above 12% at latest reporting |
| NAB | ~11.8-12.2% | Yes | N/A | Mid-range among majors |
| ANZ | ~11.5-12.5% | Yes | N/A | Historically slightly lower than CBA/WBC |
The 1-2 percentage point gap between BEN and the majors reflects structural differences: domestically systemically important bank (D-SIB) buffers and internal ratings-based (IRB) capital modelling that do not apply to BEN, rather than reckless balance sheet management. BEN’s internal target of 10.0-10.5% means the current ~11.0% provides roughly 50-100 basis points of management headroom, though the APRA overlay limits near-term scope for aggressive capital returns. One complementary strength: BEN’s loan-to-customer deposit ratio of 113% at FYE25, the strongest among peers according to Fitch, signals a stable funding base.
BEN confirmed as at 30 November 2025 that its CET1 “remains well above the Board’s target and APRA’s definition of ‘unquestionably strong’.”
Return on equity: the profitability gap that explains BEN’s valuation discount
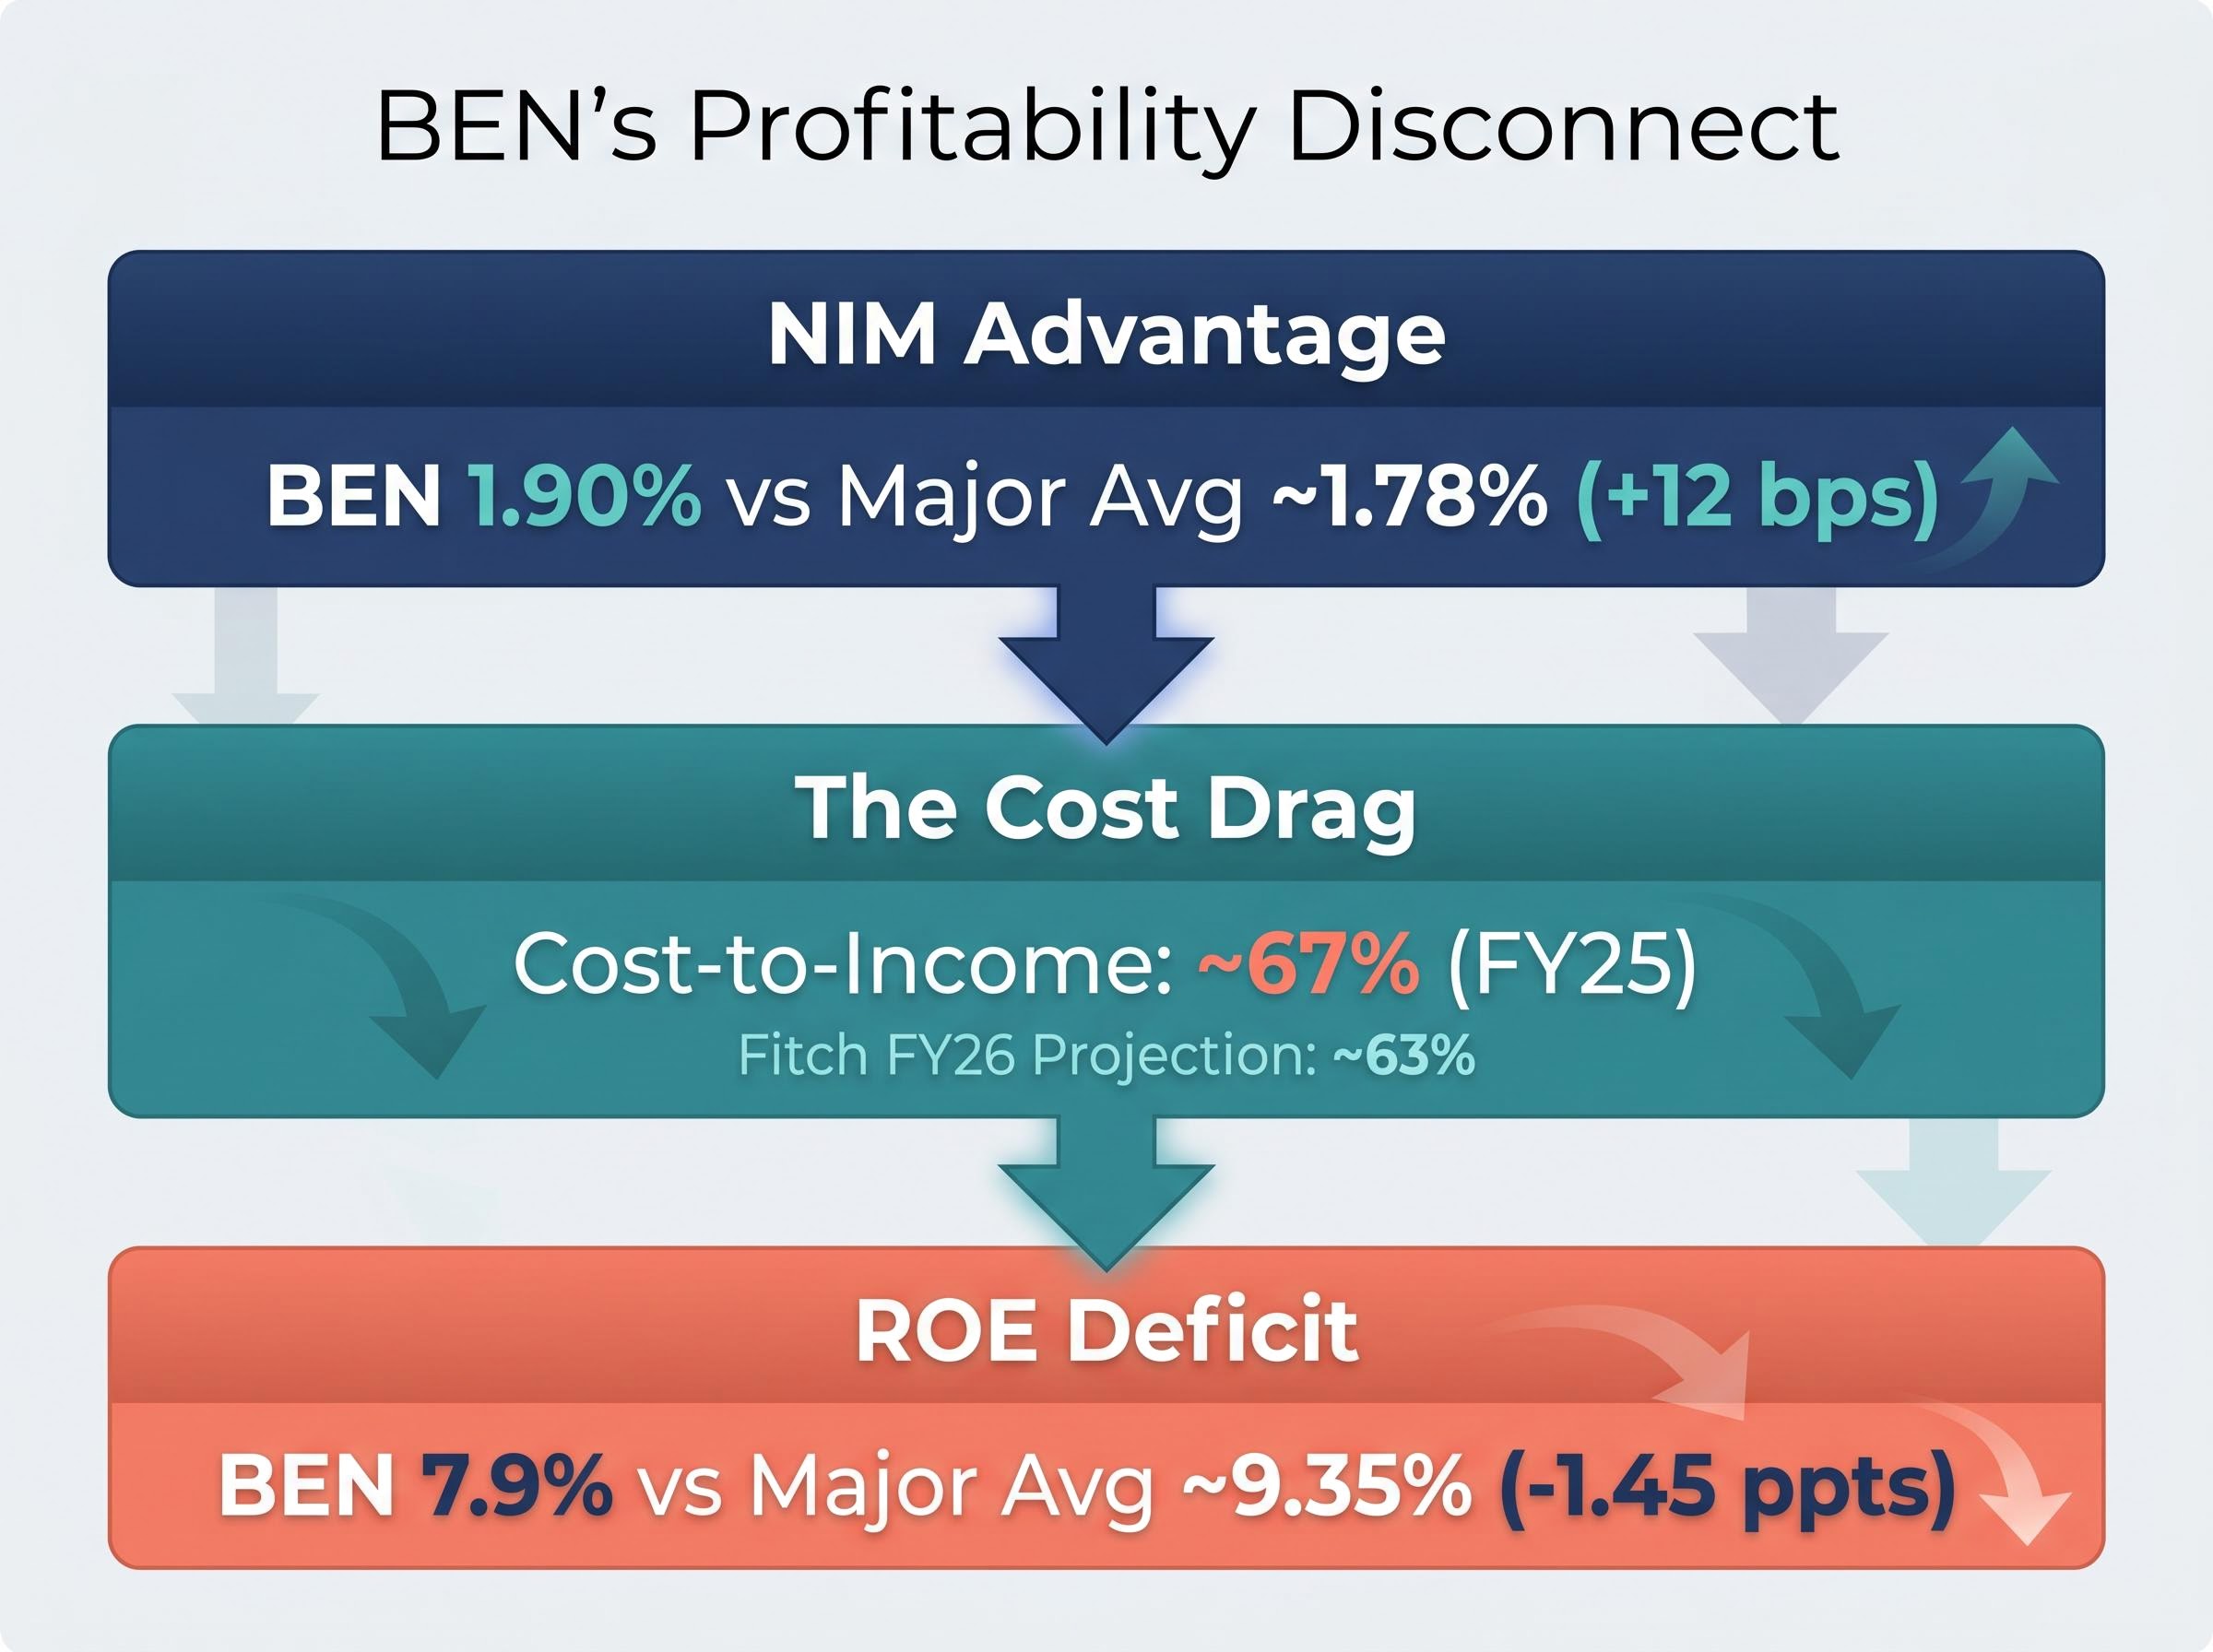
BEN’s ROE of 7.9% sits 1.45 percentage points below the sector average of approximately 9.35%. In plain terms, BEN generates roughly $1.45 less profit per $100 of shareholder equity than the average major bank. That gap is the single largest structural reason the stock trades at a persistent discount to peers.
The source of the gap is not margin. BEN’s net interest margin (NIM) of 1.90% comfortably exceeds the 1.78% major bank average, reflecting the bank’s regional and SME lending niches. The problem sits further down the income statement.
| Metric | BEN | Major Bank Average | BEN Advantage / Disadvantage |
|---|---|---|---|
| ROE | 7.9% | ~9.35% | Disadvantage: -1.45 ppts |
| NIM | 1.90% | ~1.78% | Advantage: +12 bps |
| Cost-to-Income | ~67% (FY25) | Generally lower | Disadvantage |
Where BEN’s NIM advantage meets its cost ceiling
The cost-to-income ratio of approximately 67% in FY25 is the primary drag. Expense growth of approximately 6% in 1H FY26 outpaced both loan growth and NIM improvement, absorbing the margin benefit before it could flow to equity holders. Fitch projects cost-to-income improving to approximately 63% by FY26, with operating profit per risk-weighted asset lifting to approximately 1.9%, supporting an ‘a-‘ earnings and profitability score.
The tension is specific: BEN extracts above-peer margin from each dollar lent but cannot convert that advantage into ROE because of a cost base inflated by scale disadvantage and an ongoing technology transformation programme. That programme simultaneously inflates costs in the near term and is expected to compress them over the medium term, making the cost-to-income trajectory the key variable for ROE recovery.
The BEN outsourcing partnerships with Infosys and Genpact, targeting $65-75 million in annualised savings by FY2028, carry upfront transition costs of $85-95 million concentrated in FY2027, meaning the cost-to-income ratio is likely to worsen before Fitch’s projected ~63% improvement materialises.
What employee culture scores reveal about BEN’s operational outlook
BEN’s Glassdoor and Seek rating of approximately 2.9 out of 5 sits marginally below the sector average of approximately 3.1 out of 5, based on the most recent data available at May 2026. The gap is modest, but its direction is consistent with the operational pressures visible in the financial data.
BEN’s employee culture score of 2.9/5 compares with a 3.1/5 sector average, a marginal but directionally consistent gap.
Recurring themes from employee reviews fall into identifiable clusters:
Positive themes:
- Strong community focus and regional engagement
- Flexible working options and supportive work-life balance
- Collegial branch and corporate team culture
Negative themes:
- Change fatigue from ongoing technology transformation programmes
- Slow decision-making relative to major banks and fintechs
- Career progression and pay competitiveness concerns in technology and analytics roles
The negative themes connect directly to BEN’s stated strategic priorities. A bank investing heavily in digital modernisation and cost reduction needs to attract and retain technology talent; pay competitiveness concerns in those roles are not abstract HR issues but a quantifiable constraint on execution speed. Change fatigue among staff often correlates with higher turnover in programme delivery roles, rising recruitment costs, and slower milestone delivery, all of which feed back into the cost-to-income trajectory that governs ROE improvement.
The broader banking industry is also experiencing culture pressure from restructures, automation, and heavier compliance loads linked to AUSTRAC and operational risk controls. BEN’s marginal underperformance on this metric warrants monitoring rather than alarm, but it reinforces rather than contradicts the financial picture.
Governance culture signals have emerged as a genuine informational edge for patient investors in the ASX banking sector, with the same NAB valuation model producing a $19.00 to $85.50 per share range depending entirely on macro assumptions about growth and discount rates, a spread that underscores why qualitative inputs, including culture scores of the kind applied to BEN in this analysis, carry as much weight as the arithmetic.
Understanding CET1, ROE, and culture scores: a framework for assessing any ASX bank
The three metrics used in this analysis each serve a distinct function. Understanding their mechanics allows investors to apply the same framework to any ASX-listed bank.
- Assess capital resilience via CET1. The Common Equity Tier 1 ratio measures the proportion of a bank’s risk-weighted assets backed by the highest-quality equity capital, primarily ordinary shares and retained earnings. In Australia, APRA’s “unquestionably strong” framework requires banks to hold capital well above global Basel minimums. The capital structure includes Pillar 1 minimums, a capital conservation buffer, a D-SIB buffer (for major banks only), and any Pillar 2 add-ons. BEN’s $50 million operational risk charge is a live example of a Pillar 2 overlay.
APRA’s unquestionably strong framework for bank capital sets out the CET1 benchmarks, D-SIB buffers, and Pillar 2 overlay mechanism that govern capital requirements across all Australian authorised deposit-taking institutions, including the operational risk charge applied to BEN from 1 January 2026.
- Assess capital efficiency via ROE. Return on equity is calculated by dividing net profit after tax by average shareholders’ equity, expressed as a percentage. For banks, where leverage is embedded in the business model, ROE is the most direct measure of management’s ability to generate returns within the constraints imposed by regulators and capital markets.
Why these three metrics are stronger together than in isolation
- Assess operational resilience via culture scores. Platforms such as Glassdoor and Seek aggregate employee sentiment data that is increasingly referenced in equity research. Culture scores capture talent risk, execution risk, and organisational resilience that balance sheet ratios cannot.
A high CET1 paired with low ROE may indicate over-capitalisation or poor capital deployment. A high ROE with a thin CET1 may indicate excessive leverage. A strong culture score without improving financial metrics may indicate strategic misalignment. Only when all three are assessed together does a coherent quality picture emerge, making this a reusable framework rather than a one-off checklist.
For investors wanting to apply the same three-lens framework to other ASX-listed banks with full worked examples, our dedicated guide to valuing ASX bank stocks using NIM, ROE and CET1 walks through a complete Dividend Discount Model using Bank of Queensland’s verified FY2025 figures, including a franking-adjusted fair value calculation that illustrates how the framework produces actionable valuation ranges rather than abstract ratios.
The BEN scorecard verdict and what it means for investors watching the share price
The three-lens assessment produces a clear and quantified picture. BEN is a bank with identifiable strengths and specific weaknesses, and the current share price of approximately $10.24 (as at 14 May 2026) reflects that mix.
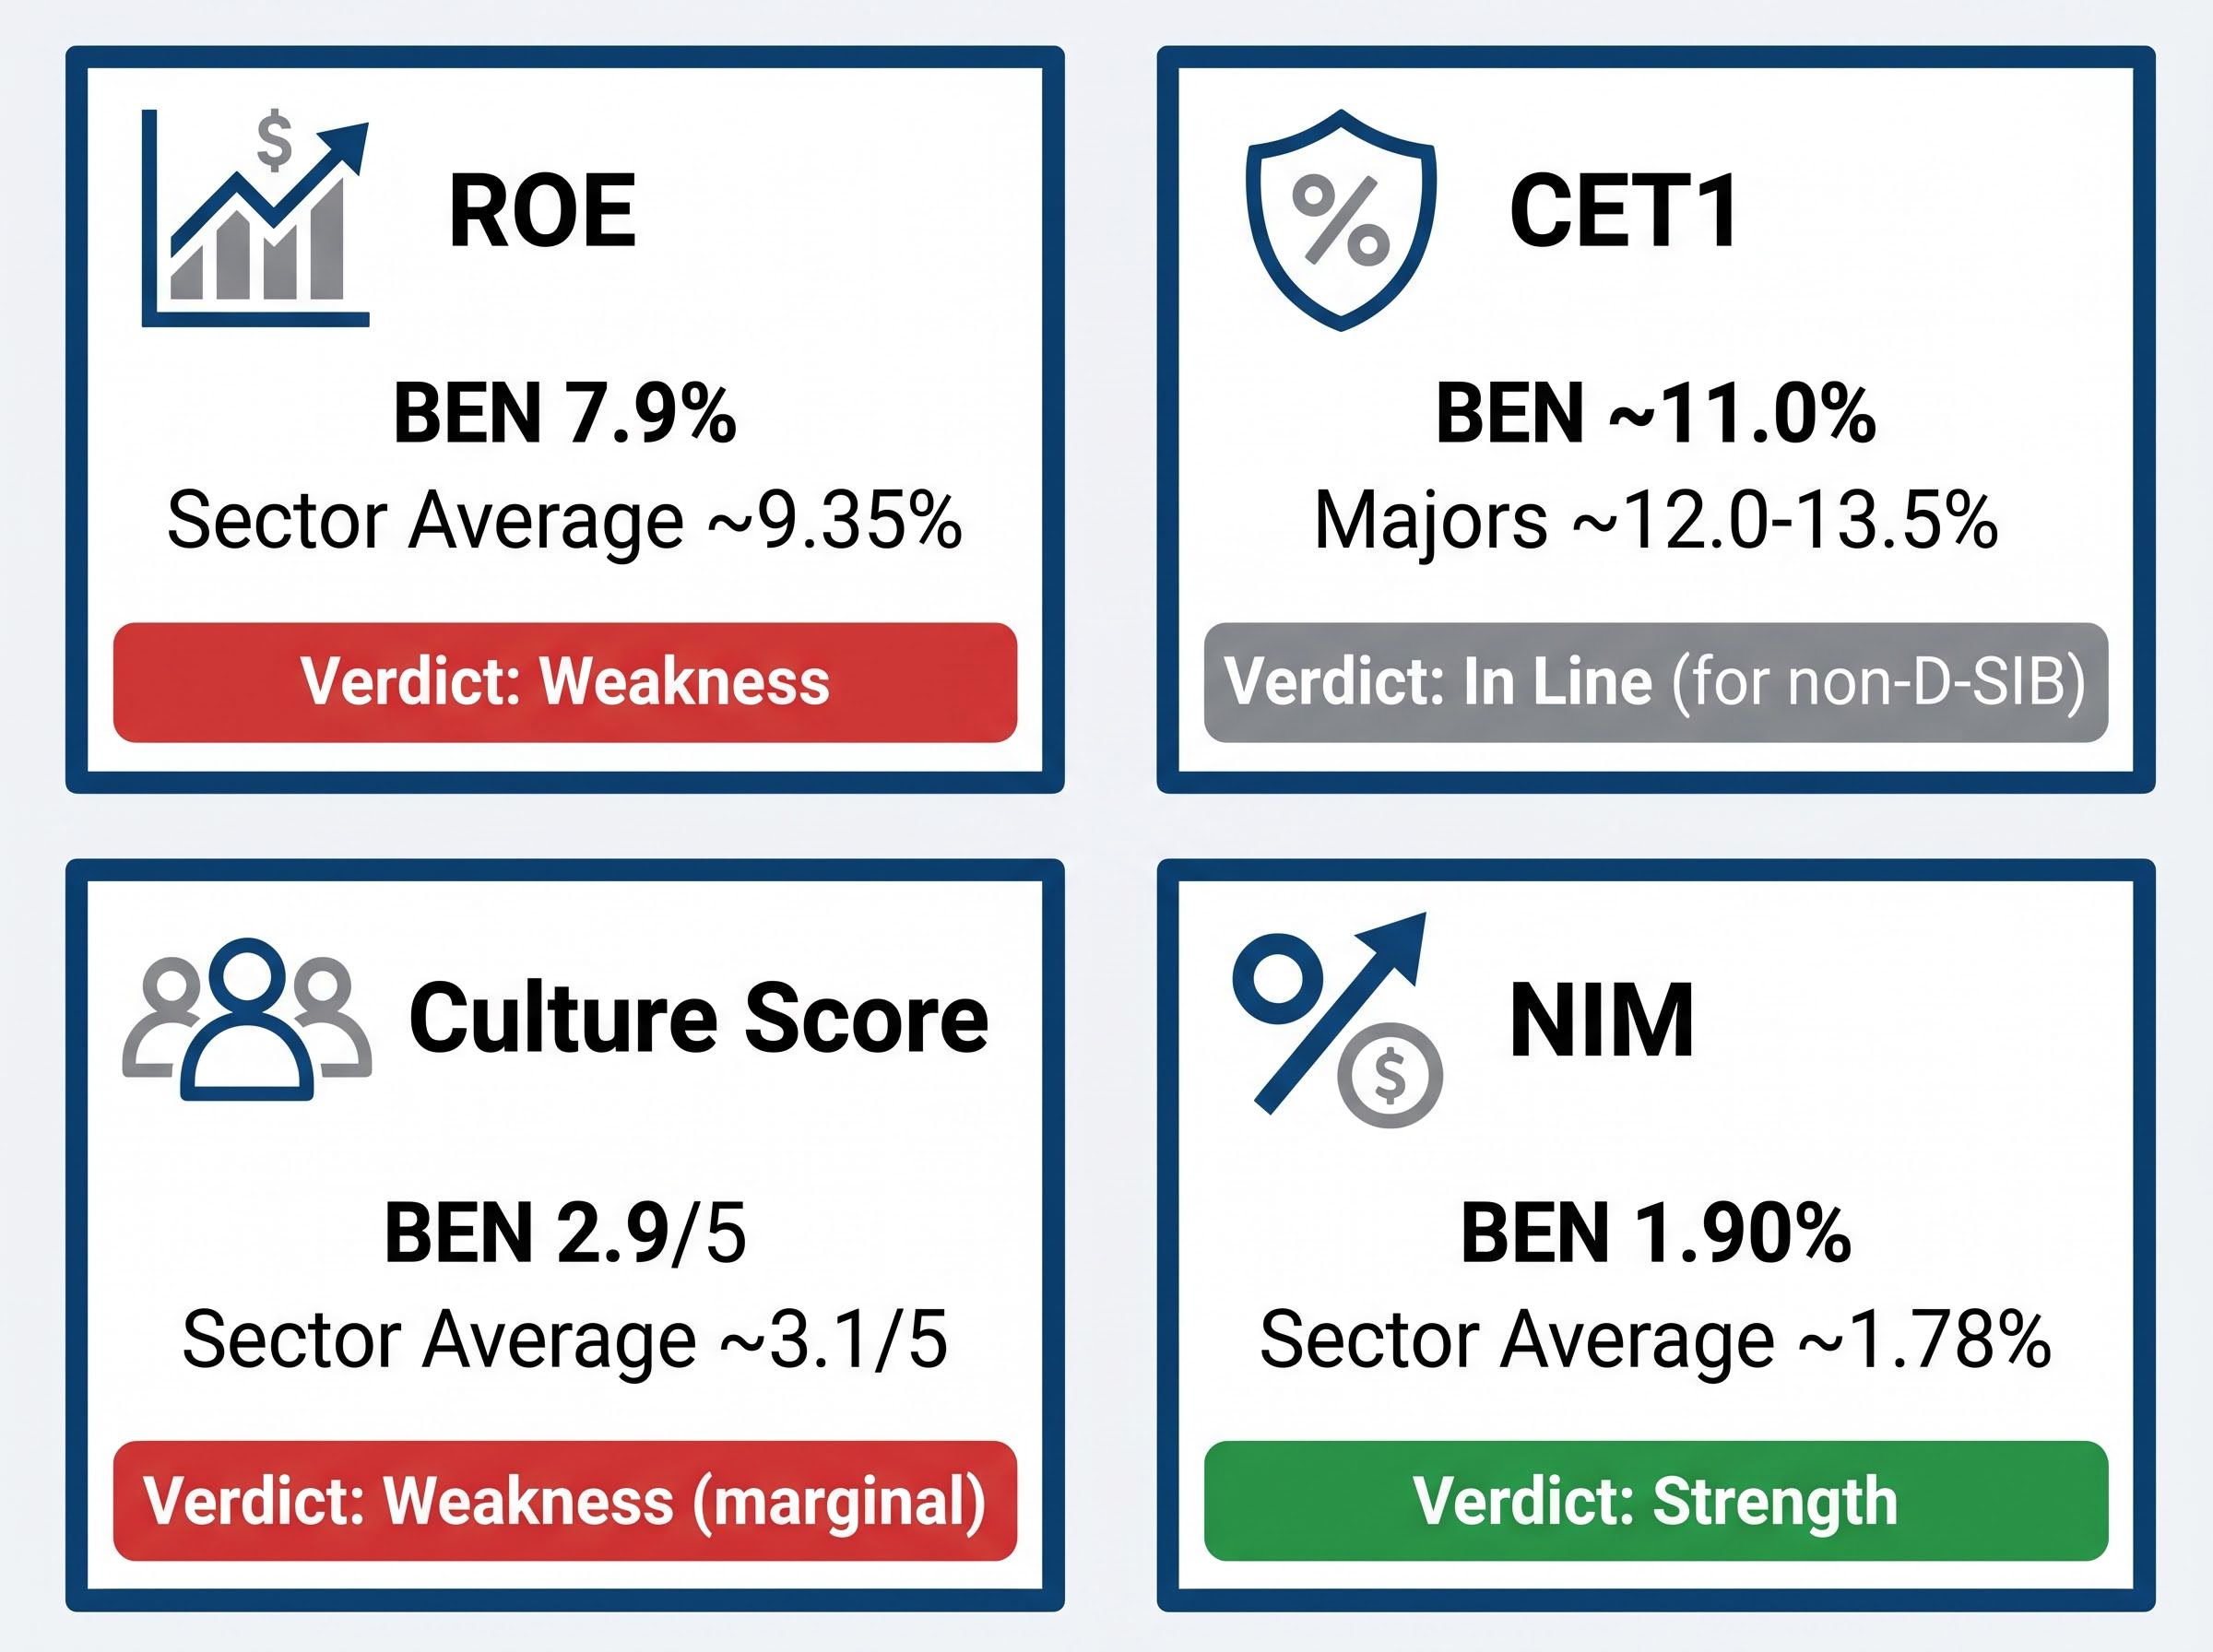
| Metric | BEN Result | Sector Average / Peer Range | Verdict |
|---|---|---|---|
| ROE | 7.9% | ~9.35% | Weakness |
| CET1 | ~11.0% | ~12.0-13.5% (majors) | In Line (for non-D-SIB) |
| Culture Score | 2.9/5 | ~3.1/5 | Weakness (marginal) |
| NIM | 1.90% | ~1.78% | Strength |
Broker consensus sits at Neutral/Hold, with a 12-month target range of approximately $10.00-$11.50. Dividend discount model scenarios range from approximately $7.22 (bear case) to $32.50 (bull case), with an average of approximately $13.32 and a franking-adjusted figure of approximately $19.64. The fully franked dividend stands at $0.63 per share for the most recent full year, with $0.65 forecast. The spread between mechanical valuation and the current market price reflects the quality gaps identified in this analysis.
Franking-adjusted DDM scenarios are highly sensitive to discount rate assumptions: shifting from 6% to 9% at a 2% growth rate moves ANZ’s modelled value from $42.25 to $24.14, which contextualises the wide spread between BEN’s bear-case DDM of approximately $7.22 and its franking-adjusted average of approximately $19.64, both of which reflect different views on the bank’s earnings recovery rather than arithmetic errors.
Three forward catalysts warrant monitoring:
- Cost-to-income trajectory toward Fitch’s projected ~63% for FY26, which is the most direct lever for ROE improvement.
- APRA overlay review, including any reduction or removal of the $50 million operational risk charge following remediation progress.
- Management capital guidance at upcoming results, particularly around dividend payout ratios, DRP settings, and buyback commentary.
BEN’s quality gap is real, measurable, and not permanent
BEN trades at a discount to peers because its ROE, CET1, and culture scores are all marginally or meaningfully below the sector standard. The discount is structurally explained rather than a market mispricing waiting to be corrected.
The strengths are genuine. An above-peer NIM of 1.90%, the best-in-class loan-to-deposit ratio among peers, a strong community deposit franchise, and a clear (if uncertain) cost reduction trajectory that could compress the ROE gap over the FY26-FY27 period all provide substance to a constructive longer-term case. The three-lens framework is most useful not as a buy or sell signal but as a monitoring checklist. BEN’s scorecard warrants watching, not dismissing or endorsing at this stage.
This article is for informational purposes only and should not be considered financial advice. Investors should conduct their own research and consult with financial professionals before making investment decisions. Past performance does not guarantee future results. Financial projections are subject to market conditions and various risk factors.