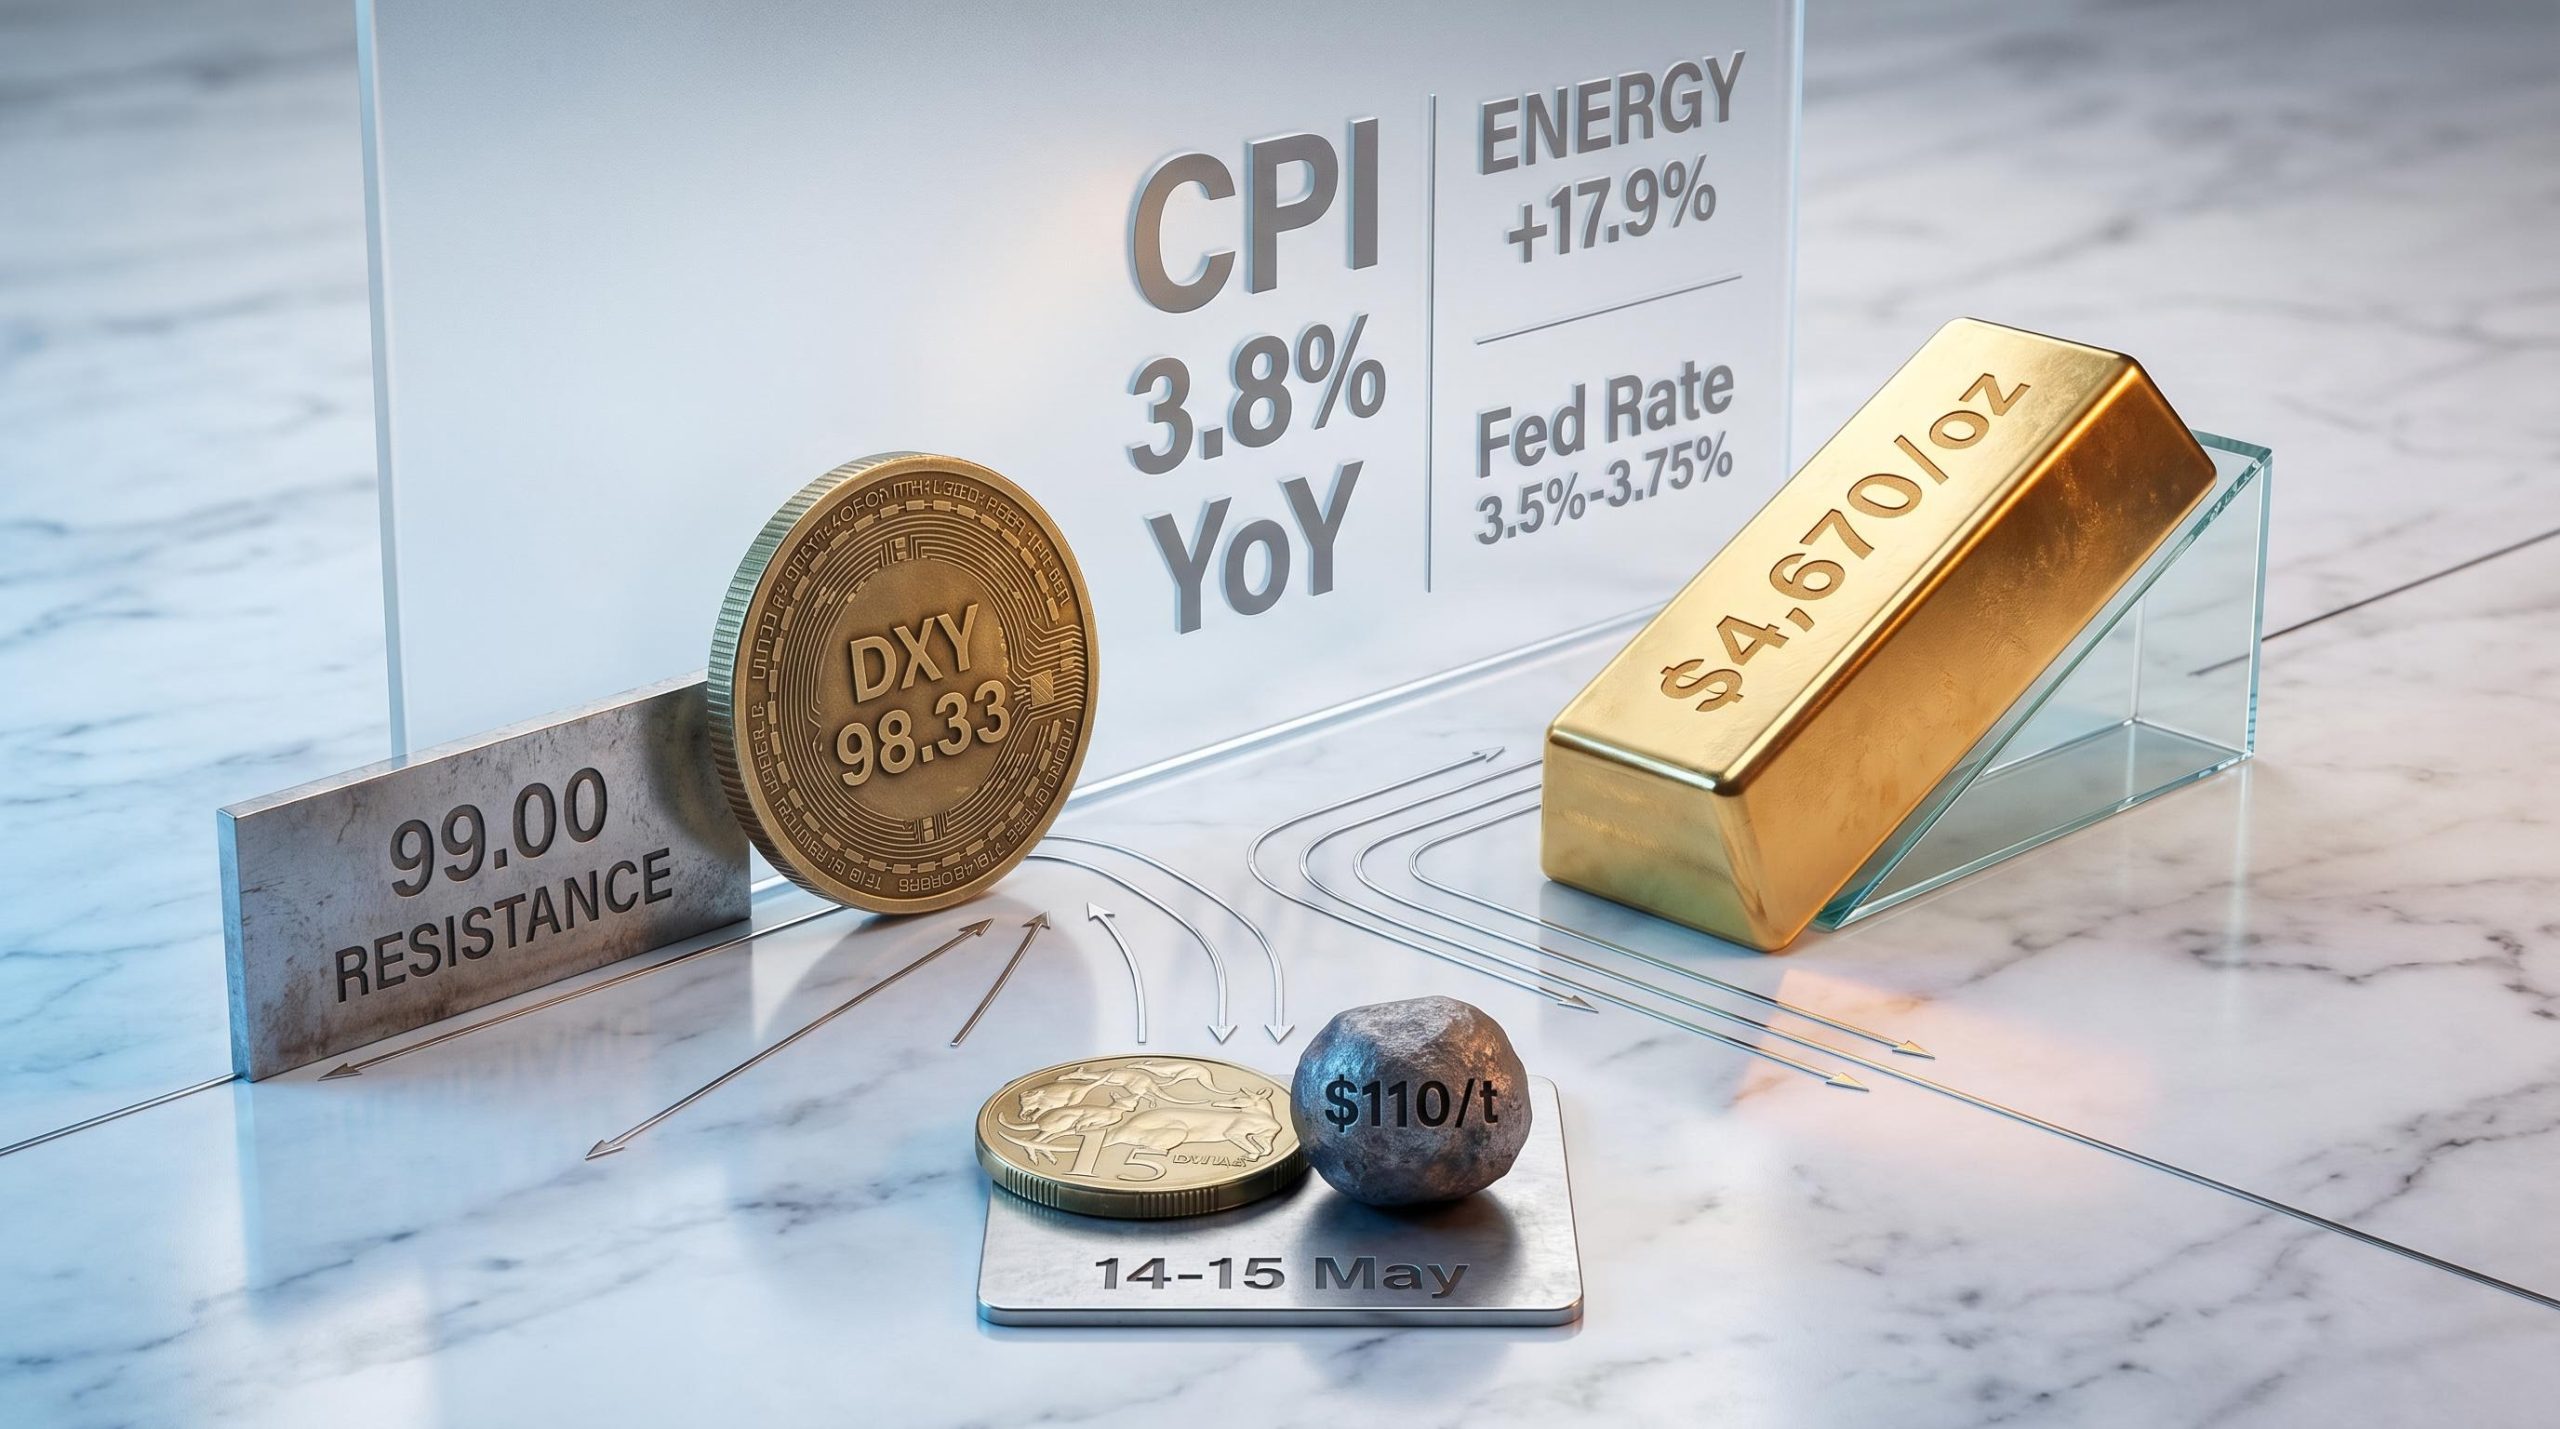
April’s US Consumer Price Index reading of 3.8% year-over-year, the highest since May 2023, arrived not as a single-market event but as a simultaneous stress test across three assets that were already sitting at technically significant junctions. The US dollar had been grinding into a supply zone after months of weakness. Gold was struggling below its 50-day moving average with momentum fading. AUD/USD had completed a multi-week recovery rally only to stall at resistance dating back to June 2022. What makes this inflation print worth analysing across all three markets at once is the mechanism: a single data release, driven primarily by energy costs up 17.9% year-over-year amid Strait of Hormuz disruptions, is now running through the Federal Reserve’s rate path, real yields, and relative rate differentials to apply pressure in different directions simultaneously. What follows is a breakdown of how the macro logic connects the three setups, what levels matter, and which catalysts in the next 48-72 hours will determine whether the current technical positioning confirms or reverses.
Why the 3.8% CPI print is a multi-asset inflection point
A single headline number, 3.8%, looks straightforward. The composition underneath it is not.
The April 2026 CPI reacceleration is driven overwhelmingly by a single component: energy, which rose 17.9% year-over-year, directly linked to Strait of Hormuz disruptions that have kept oil near $100/bbl. The remaining breakdown adds context rather than alarm:
- Energy: +17.9% y/y, the dominant contributor to the headline reacceleration
- Food: +3.2% y/y, elevated but not accelerating sharply
- Core CPI (excluding food and energy): Remains elevated, with persistent services inflation identified by policymakers as the source of stickiness
- Shelter and services: Cited in Fed communications as the reason the disinflation path has stalled
The transmission from this data to multiple asset classes runs through the Federal Reserve. With the fed funds rate at 3.5%-3.75%, markets are not pricing a return to rate hikes. They are pricing a slower pace of easing. CME FedWatch data shows a near-certain hold at the June meeting, with a 25 basis point cut now the base case for September 2026 at the earliest.
The April 29 FOMC decision to hold rates at 3.5%-3.75% was accompanied by a four-way internal dissent that fractured the committee across both hawkish and dovish directions, a fracture that makes the September cut baseline the article’s rate path rests on significantly less certain than CME FedWatch probabilities alone imply.
The Federal Reserve’s March 2026 SEP projections established the official FOMC rate path baseline, with participant forecasts anchoring the fed funds rate above 3.0% through 2026, which is precisely the trajectory that markets are now stress-testing against a reaccelerating CPI print.
Goldman Sachs forecasts two rate cuts in 2026, bringing the fed funds rate to approximately 3.0%-3.25% by year-end, a trajectory consistent with slower easing rather than a hawkish reversal.
That distinction matters. A delayed cut from 3.5%-3.75% lifts real yields modestly, supports the dollar through widening rate differentials, and creates a headwind for both gold (a non-yielding asset competing with higher real returns) and risk-sensitive currencies like the Australian dollar. The moves across all three markets are moderate rather than extreme precisely because the starting rate is already well below the 2023 cycle peak. The pressure is real, but it is graduated.
When big ASX news breaks, our subscribers know first
The US Dollar Index at the edge of a supply zone
The macro logic from the CPI print arrives at the DXY chart at a technically loaded junction. The index has been stabilising after months of weakness, grinding higher into the 98.38-99.00 supply zone, but remains below its major long-term moving averages. The medium-term bias is cautious, not bullish.
As of 13 May 2026, the DXY sits at approximately 98.33-98.42, pressing against the lower boundary of that resistance band. Momentum indicators have recovered from oversold conditions, which signals diminishing selling pressure without confirming a trend reversal.
| Level Name | Price | Signal if Reached |
|---|---|---|
| Supply zone resistance | 98.57-99.00 | Decisive break above confirms recovery trend; validates Deutsche Bank and Goldman Sachs USD targets |
| Initial support | 97.85 | Failure to hold the supply zone exposes this level as first downside target |
| Deeper support | 97.00 region | A move here would reassert the medium-term bearish trend |
What a DXY break above 99.00 would signal
A decisive daily close above 99.00 would confirm a transition from range-bound consolidation into a recovery trend. This is the scenario underpinning both Deutsche Bank’s target of DXY 100 (analyst Henry Allen noted on 10 May that the 3.8% CPI solidifies USD strength into Q3 absent Fed cuts) and Goldman Sachs’s Lindsay Rosner expectation of a 99-100 trading range, supported by inflation divergence versus the RBA and ECB.
For gold and AUD/USD, this is the scenario that amplifies downside pressure. The DXY’s resolution within this supply zone is the single most consequential technical outcome for all three markets this week.
How inflation expectations shape a currency and commodity simultaneously
A common question when reviewing cross-asset reactions to a CPI print is why one asset strengthens while another weakens from the same data. The mechanism runs through two connected channels: real yields and relative rate differentials.
Real yields represent the difference between nominal Treasury yields and inflation expectations. When a CPI print surprises higher, nominal yields tend to rise as markets push back the timeline for rate cuts. If that increase in nominal yields outpaces the rise in inflation expectations, real yields climb. Gold, which generates no income, loses relative attractiveness when investors can earn a higher inflation-adjusted return from Treasuries. This is the primary mechanism by which higher inflation creates a headwind for gold, a relationship that appears counterintuitive until the real yield channel is understood.
Relative rate differentials explain the dollar’s side of the equation. The US dollar does not strengthen because rates are high in absolute terms; it strengthens because inflation divergence means the Fed is cutting more slowly than other central banks. Goldman Sachs characterised the dollar as supported by inflation divergence versus the RBA and ECB, where rate cut timelines are more advanced. That widening differential makes dollar-denominated assets relatively more attractive to global capital.
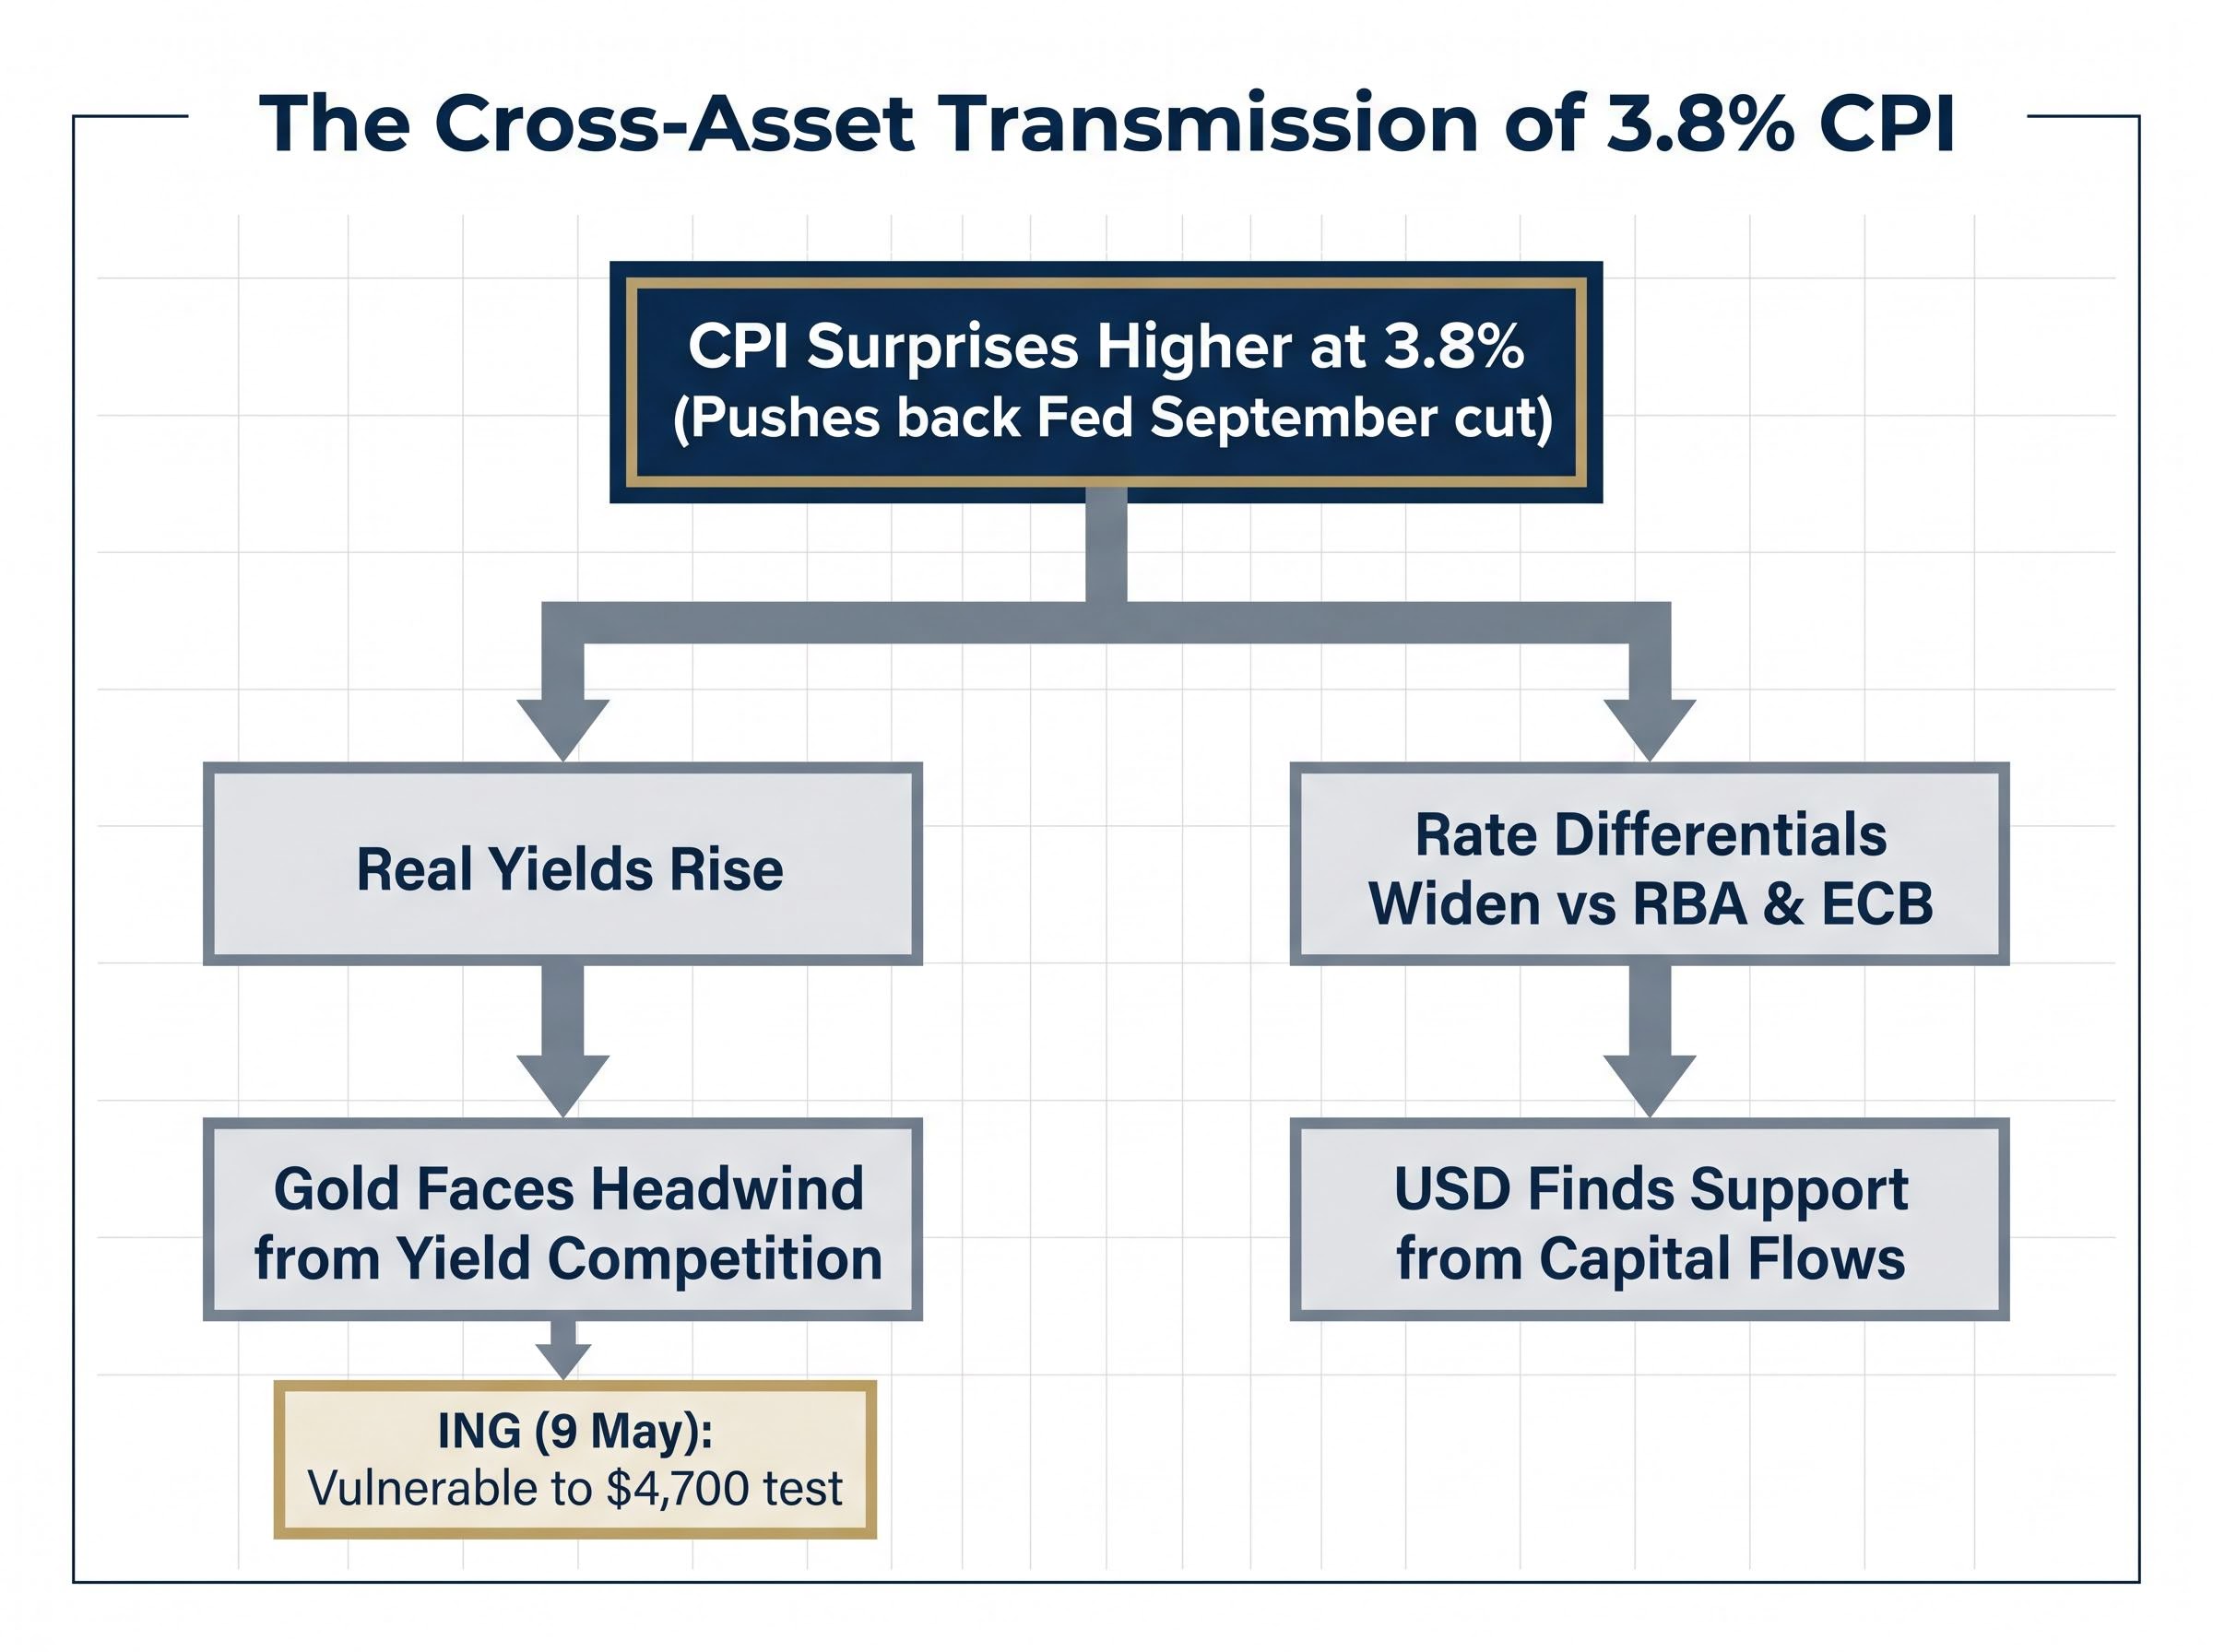
The three-step logic chain connects a single data release to both outcomes:
- CPI surprises higher at 3.8%, pushing back the Fed’s September cut timeline
- Real yields rise and rate differentials widen against other major central bank benchmarks
- Gold faces a headwind from yield competition while the USD finds support from capital flows
ING’s Francesco Pesole noted on 9 May that gold remains vulnerable to a $4,700 test as real yields rise post-CPI, a view consistent with the real yield transmission mechanism applying pressure to non-yielding assets.
Traders who understand these connected channels can anticipate cross-asset moves from a single data release rather than reacting to each market in isolation.
AUD/USD at three-year resistance as two macro forces collide
The Australian dollar has done the hard technical work. A multi-week recovery rally carried AUD/USD steadily higher, and the pair is now approaching the 0.7280 resistance level, corresponding to June 2022 highs, near the upper boundary of its rising channel. The rally is intact, but momentum is fading at the worst possible moment.
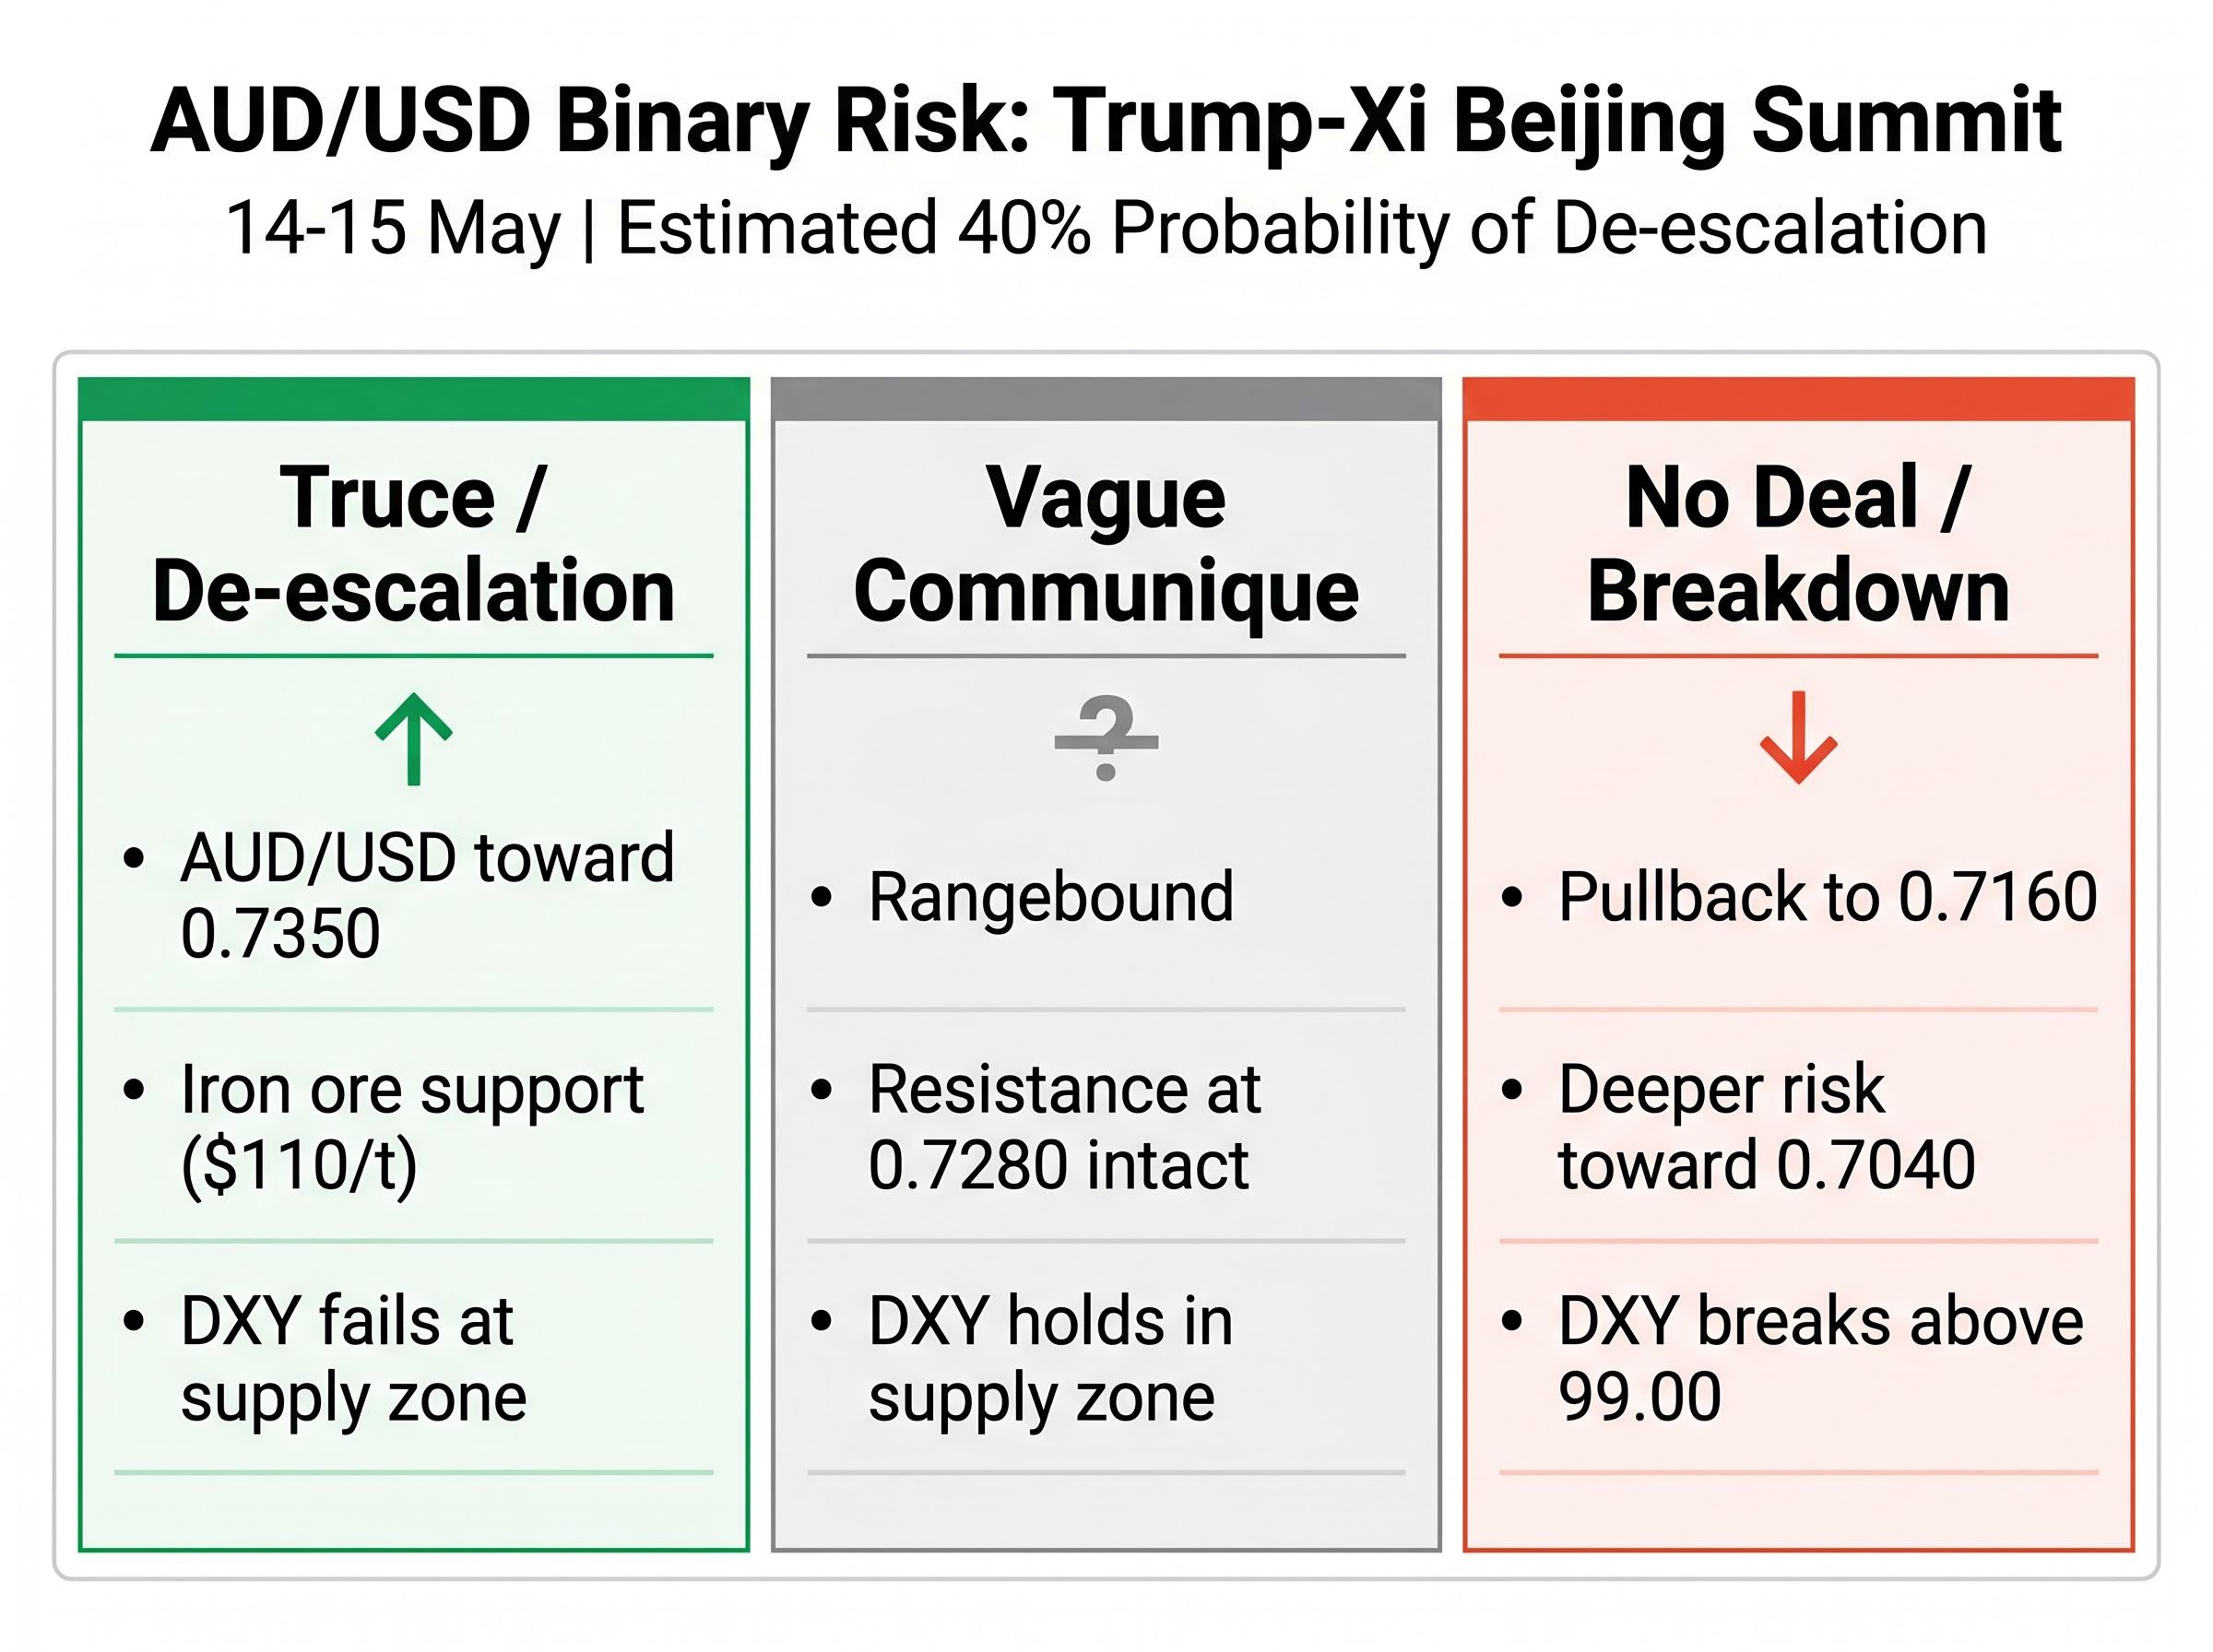
Two macro forces are converging against the pair simultaneously. The first is USD strength post-CPI, which applies direct downside pressure through the rate differential channel described above. The second is the binary risk of the Trump-Xi Beijing summit on 14-15 May, with pre-summit risk aversion already capping upside. The market’s estimated probability of meaningful tariff de-escalation has fallen from approximately 55% before the CPI data to roughly 40% as the hawkish inflation backdrop dampened risk appetite. Implied volatility in AUD options for the 15 May expiry has spiked to approximately 25%, reflecting elevated binary risk.
The Hormuz crisis forex dynamics that are lifting the USD through petrodollar transaction demand and domestic energy self-sufficiency are the same forces creating the relative resilience in AUD through elevated LNG export revenues, a structural divergence that explains why the Australian dollar has recovered as far as it has even as the rate differential works against it.
| Scenario | Summit Outcome | DXY Direction | AUD/USD Implication |
|---|---|---|---|
| Best case for AUD | Tariff truce or de-escalation | Fails at supply zone | AUD/USD toward 0.7350 via iron ore channel |
| Worst case for AUD | No deal or breakdown | Breaks above 99.00 | Pullback to 0.7160; deeper risk toward 50-day MA near 0.7040 |
| Mixed outcome | Vague communique, no specifics | Holds within supply zone | Rangebound; resistance at 0.7280 intact |
Westpac’s Sean Callow estimated that a positive summit outcome could lift AUD/USD toward 0.7350 via the iron ore channel, with iron ore futures already up 1.2% to approximately $110/t on de-escalation optimism heading into the event.
AUD/USD is effectively a real-time referendum on whether risk appetite can overcome USD momentum. The chart has built the setup; the summit and DXY resolution will determine which direction it breaks.
Gold’s fragile recovery and the real yield ceiling
Gold’s technical picture is the most ambiguous of the three setups. Trading at approximately $4,670-$4,715/oz as of 12-13 May, with a recent daily range of $4,638-$4,774, the metal sits below its 50-day moving average and beneath descending trend resistance. Momentum indicators have flattened after recovering from oversold levels, suggesting the rebound is losing steam rather than building toward a breakout.
The resistance zone at $4,770-$4,880 is the level gold must decisively reclaim to shift the technical picture. On the downside, immediate support sits at $4,510, with structural support near $4,330.
What makes gold’s setup more complex than the dollar or AUD is the presence of competing forces that prevent a clean directional read:
- Headwinds: Rising real yields and USD strength are structural pressures that increase the opportunity cost of holding a non-yielding asset; these favour downside toward the $4,600-$4,700 range
- Supports: Ongoing Strait of Hormuz tensions provide a geopolitical safe-haven floor, while a positive Trump-Xi summit outcome could generate approximately +$50/oz in near-term risk-on flows
JPMorgan’s Natasha Kaneva noted on 12 May that the near-term view is bearish below $4,800, with sticky US CPI capping upside and $4,600 identified as the next support level to watch.
The Goldman Sachs gold forecast of $5,400 per ounce for late 2026 rests on two pillars that the near-term real yield headwind does not invalidate: central bank accumulation projected at 750-850 tonnes providing a structural demand floor, and Federal Reserve rate reductions of 50 basis points modeled to deliver approximately $120 per ounce of direct price support once easing resumes.
The Hormuz variable: geopolitical floor or temporary noise?
The 11 May Iranian drone incident briefly disrupted approximately 5% of tanker traffic through the Strait, causing roughly a one-hour delay for 12 vessels before resolution without escalation. No repeat incidents have been reported in the subsequent 48 hours. The question is whether this risk provides a durable support floor for gold or was an event-specific spike that has already faded from pricing.
Goldman Sachs estimated that persistent oil above $100/bbl, partly attributable to Hormuz friction, adds approximately 0.2% to global CPI. That creates an indirect secondary support channel for gold: higher energy costs reinforce the Fed pause narrative, which in turn sustains the inflation expectations that anchor gold’s long-term appeal even as rising real yields pressure it in the near term.
Gold’s current setup rewards patience over conviction. The next directional move is more likely to be decided by whether real yields stabilise or continue climbing than by the chart pattern alone, making the Fed speaker calendar in coming weeks as informative as the price levels.
The next major ASX story will hit our subscribers first
The week’s decision points for traders watching all three markets
The three market threads converge on a small number of catalysts that will arrive in a specific sequence. DXY direction is the primary variable: if the dollar breaks above 99.00, the pressure on both gold and AUD intensifies materially; if it fails at the supply zone, both find relief.
The sequence to watch:
- DXY supply zone resolution (98.57-99.00): The first signal, likely before the summit, that will set the tone for cross-asset positioning
- Trump-Xi summit outcome (14-15 May): The binary risk event most specific to AUD and commodities, with iron ore as the primary transmission mechanism; approximately 40% probability of meaningful de-escalation
- Fed speaker calendar and any renewed Hormuz incidents: Secondary catalysts that could shift the September cut baseline and reopen the inflation narrative
| Catalyst | Timing | Most Exposed Asset | Direction of Impact |
|---|---|---|---|
| Trump-Xi summit | 14-15 May | AUD/USD | De-escalation bullish AUD; breakdown bearish |
| DXY 99.00 breakout | This week | Gold | Breakout accelerates gold downside toward $4,600 |
| Renewed Hormuz incident | Unpredictable | Gold / Oil | Upside risk to oil and inflation expectations |
| Fed speaker communications | Coming weeks | DXY | Hawkish tone supports USD; dovish softens September hold |
WTI crude near $100.66-$101.21 remains the oil level to monitor for persistence of the CPI feedback loop. Goldman Sachs’s two-cut full-year forecast provides the baseline against which any Fed speaker deviation will be measured.
The Fed policy outlook carries an unusual degree of uncertainty heading into the second half of 2026, with the incoming Warsh chairmanship, five consecutive years of above-target inflation, and a labour market that is softer beneath its headline numbers all creating conditions where any single Fed speaker comment could shift the September cut baseline more materially than in a typical easing cycle.
Three charts, one macro story, and what comes next
The 3.8% CPI print is not an isolated dollar event. It is a macro catalyst whose effects are running simultaneously through three technically significant setups, each at a different stage of resolution. The inflation backdrop favours USD strength and pressures gold and AUD in the near term. The summit binary and any geopolitical de-escalation could partially offset that headwind for risk assets and commodities within the same week.
The resolution of the DXY supply zone and the summit outcome, likely within the next 48-72 hours, will provide the clearest signal on whether current technical setups confirm or reverse. Traders following these markets should track the DXY 99.00 level, the summit communique on tariffs, and any Fed speaker comments on the September cut baseline as the three most informative inputs in the week ahead.
This article is for informational purposes only and should not be considered financial advice. Investors should conduct their own research and consult with financial professionals before making investment decisions. Financial projections and forward-looking statements referenced in this analysis are subject to market conditions and various risk factors.