Vanguard VIHY Declares First Distribution at 49.49 Cents per Unit
7 mins ago

The ASX information technology index has delivered an average annual return of -0.66% over five years, yet Australian investors keep gravitating toward tech stocks. Xero’s share price has fallen roughly 54% in the past year alone, and it closed at $80.55 on 12 May 2026. Analyst consensus still points to a price target of $141.45. Something structural is driving that disconnect, and sector-level index returns alone cannot explain it.
The ASX tech sector’s 2025 drawdown of roughly 39-43% from its August peak has created an unusual situation: the investment thesis for quality SaaS (software as a service) businesses appears fundamentally disconnected from their share price trajectory. Understanding why requires looking past headline returns to the underlying business economics that make software companies categorically different from the rest of the ASX. What follows walks through the structural reasons tech businesses like Xero command persistent investor attention, using concrete margin, scalability, and valuation data to explain what index returns alone cannot.
Over the past five years, the S&P/ASX 200 Information Technology Index (XIJ) has returned an average of -0.66% annually. Over the same period, the broader ASX 200 has returned approximately 4.25% per year. That gap is wide enough to make a blanket case against the sector.
| Index | Five-year average annual return | 2025 drawdown from peak |
|---|---|---|
| ASX Information Technology (XIJ) | -0.66% | ~39-43% from August 2025 peak |
| ASX 200 | +4.25% | N/A (modest relative decline) |
Yet sector-level index returns and individual business fundamentals are measuring entirely different things. Index construction weights, timing of constituent additions and removals, and broad macroeconomic derating of growth multiples all shape XIJ’s headline figure. None of those factors directly measure whether the underlying companies are growing revenue, retaining customers, or expanding margins.
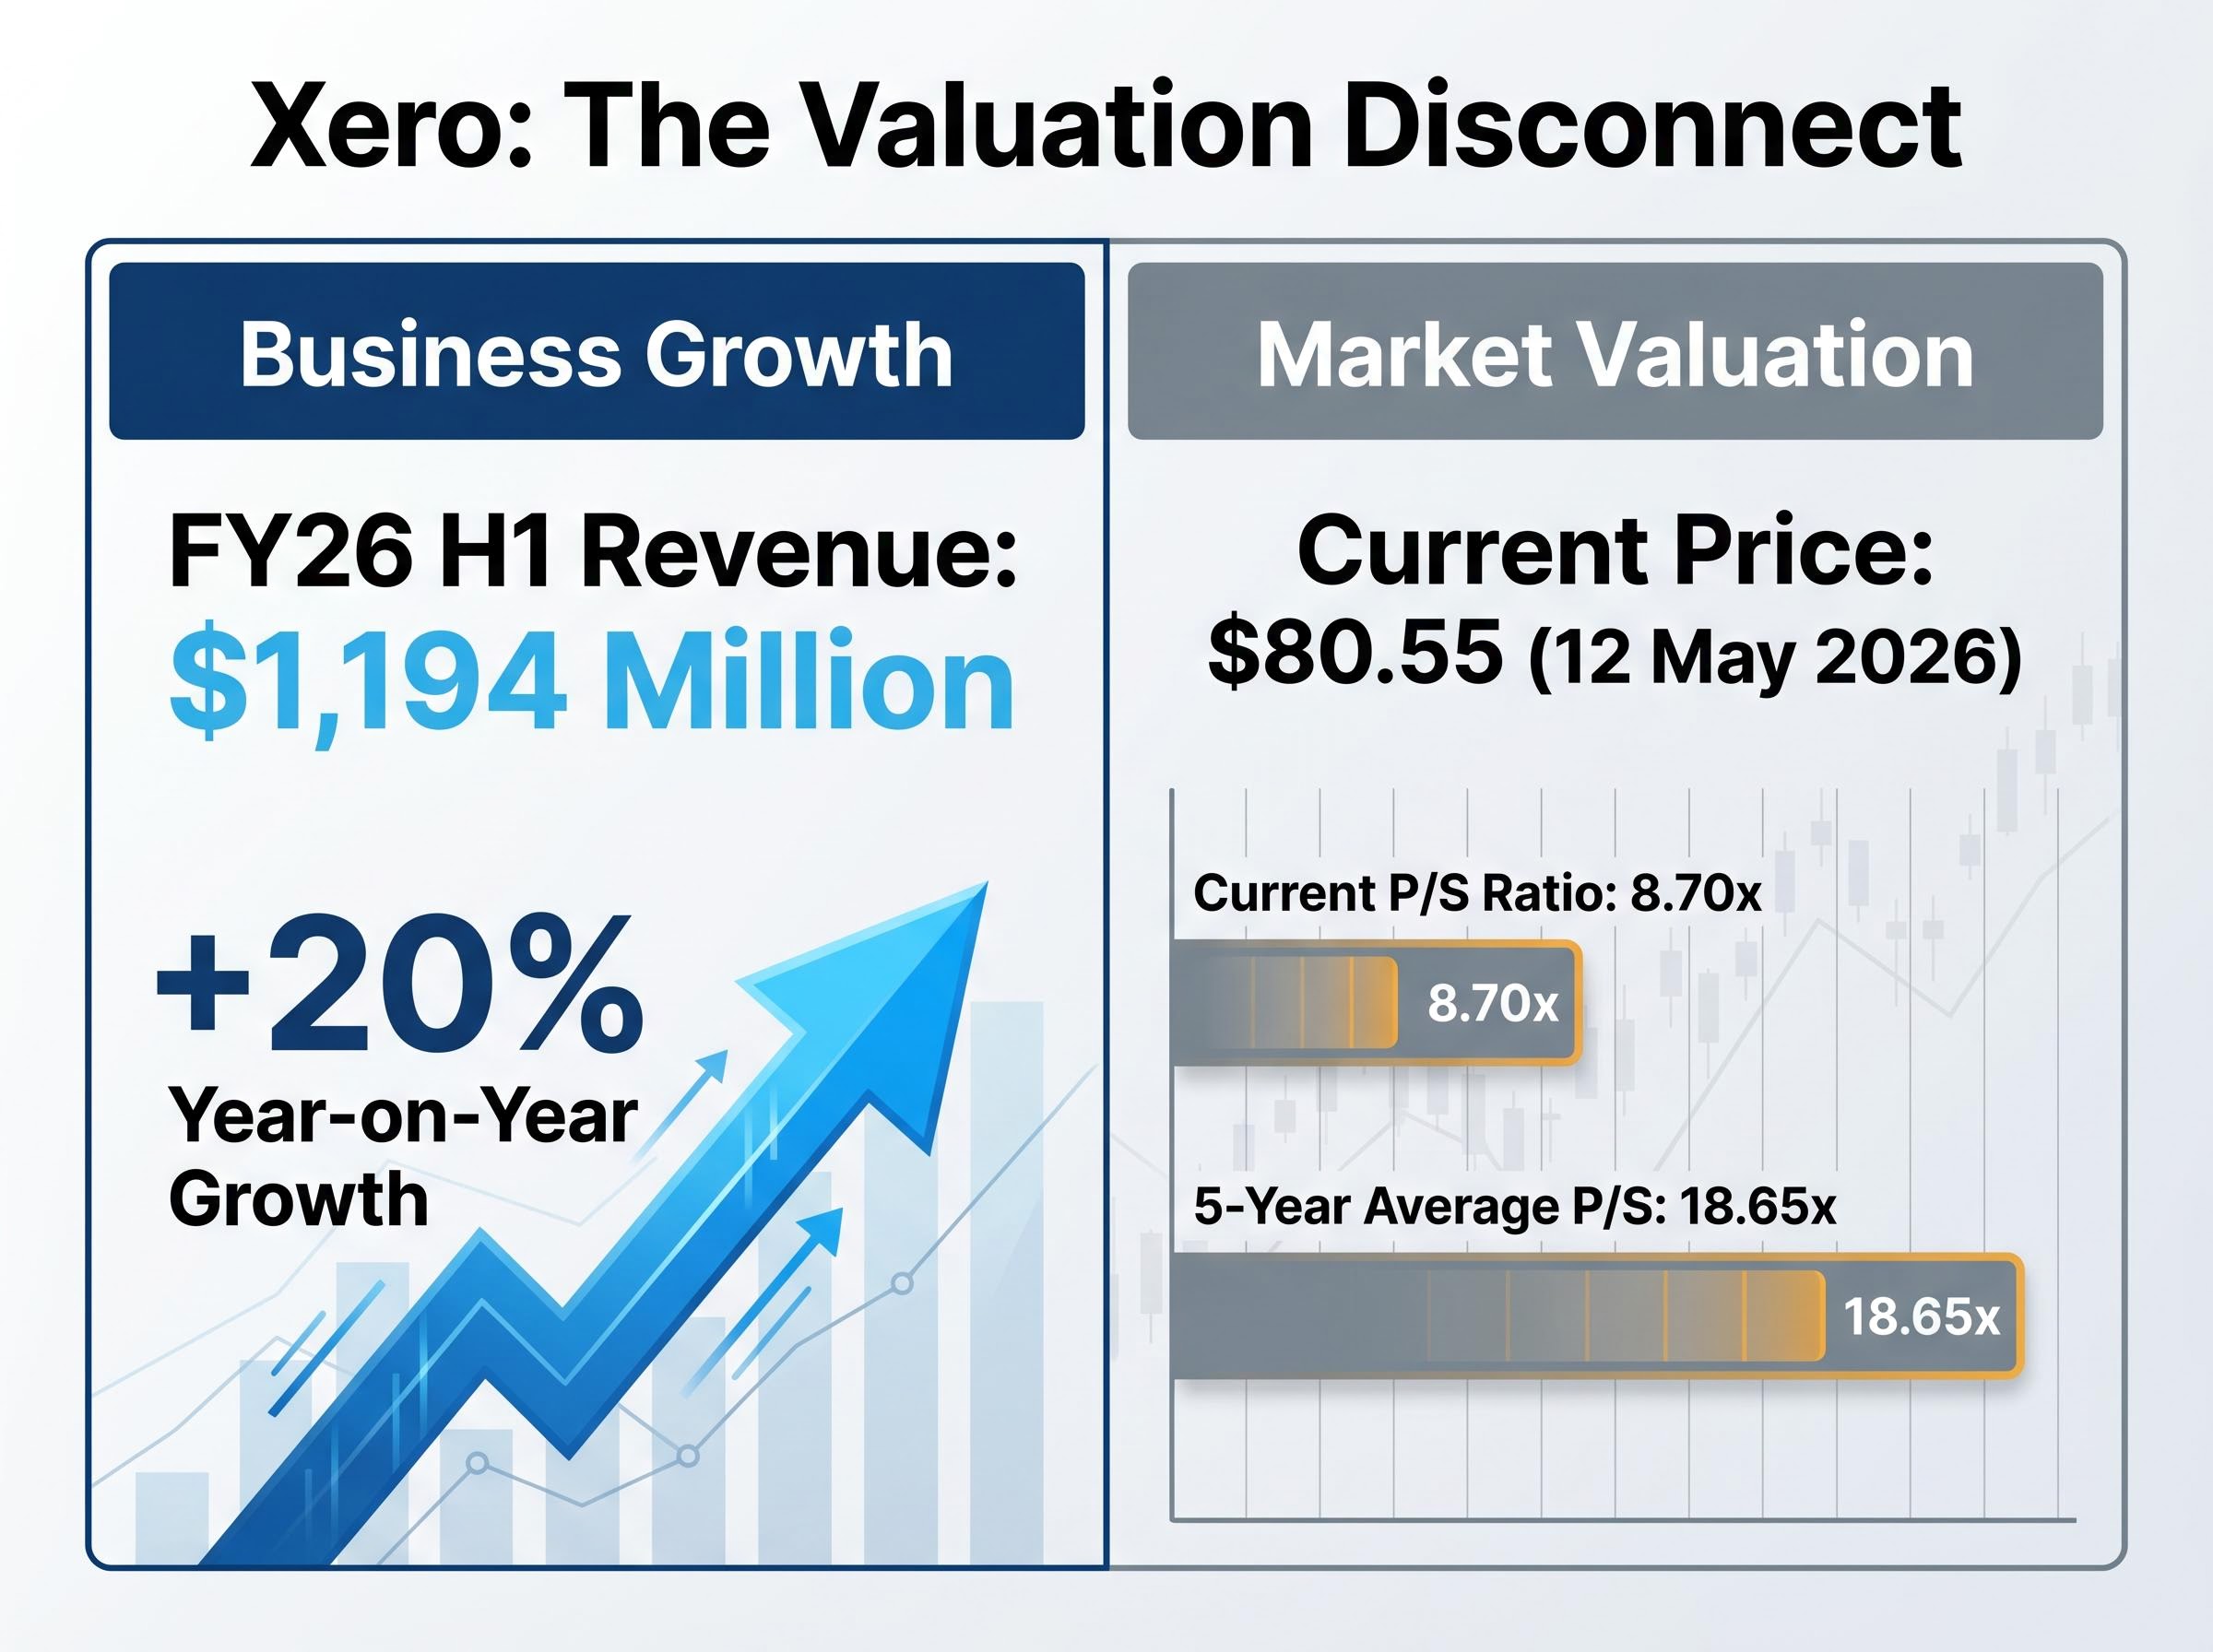
Xero’s share price declined approximately 28.7% from January 2025 through May 2026. Over the same period, the company reported FY26 first-half revenue of $1,194 million, representing 20% year-on-year growth.
That divergence is not a contradiction. It is evidence that macro derating, not operational deterioration, has been driving the share price lower. Revenue growth of 20% alongside a falling share price suggests the market is repricing the multiple it assigns to that revenue, not questioning whether the revenue itself is real. For investors researching Xero, separating that distinction matters before any valuation number is useful.
The ASX growth stock sell-off from October 2025 to April 2026 compressed forward P/E multiples between 26% and 64% across a cohort of ten prominent names, including Xero, while consensus earnings forecasts remained stable or improved in nine of those ten cases, providing the clearest available evidence that the repricing was sentiment-driven rather than fundamental.
Gross margin measures the percentage of revenue left after subtracting the direct costs of delivering the product. For a manufacturer, those costs include raw materials, factory labour, logistics, and warehousing. For a software company, the product is code. Once built, it can be distributed to each additional customer at near-zero incremental cost. The direct delivery expenses are primarily cloud hosting infrastructure and customer support.
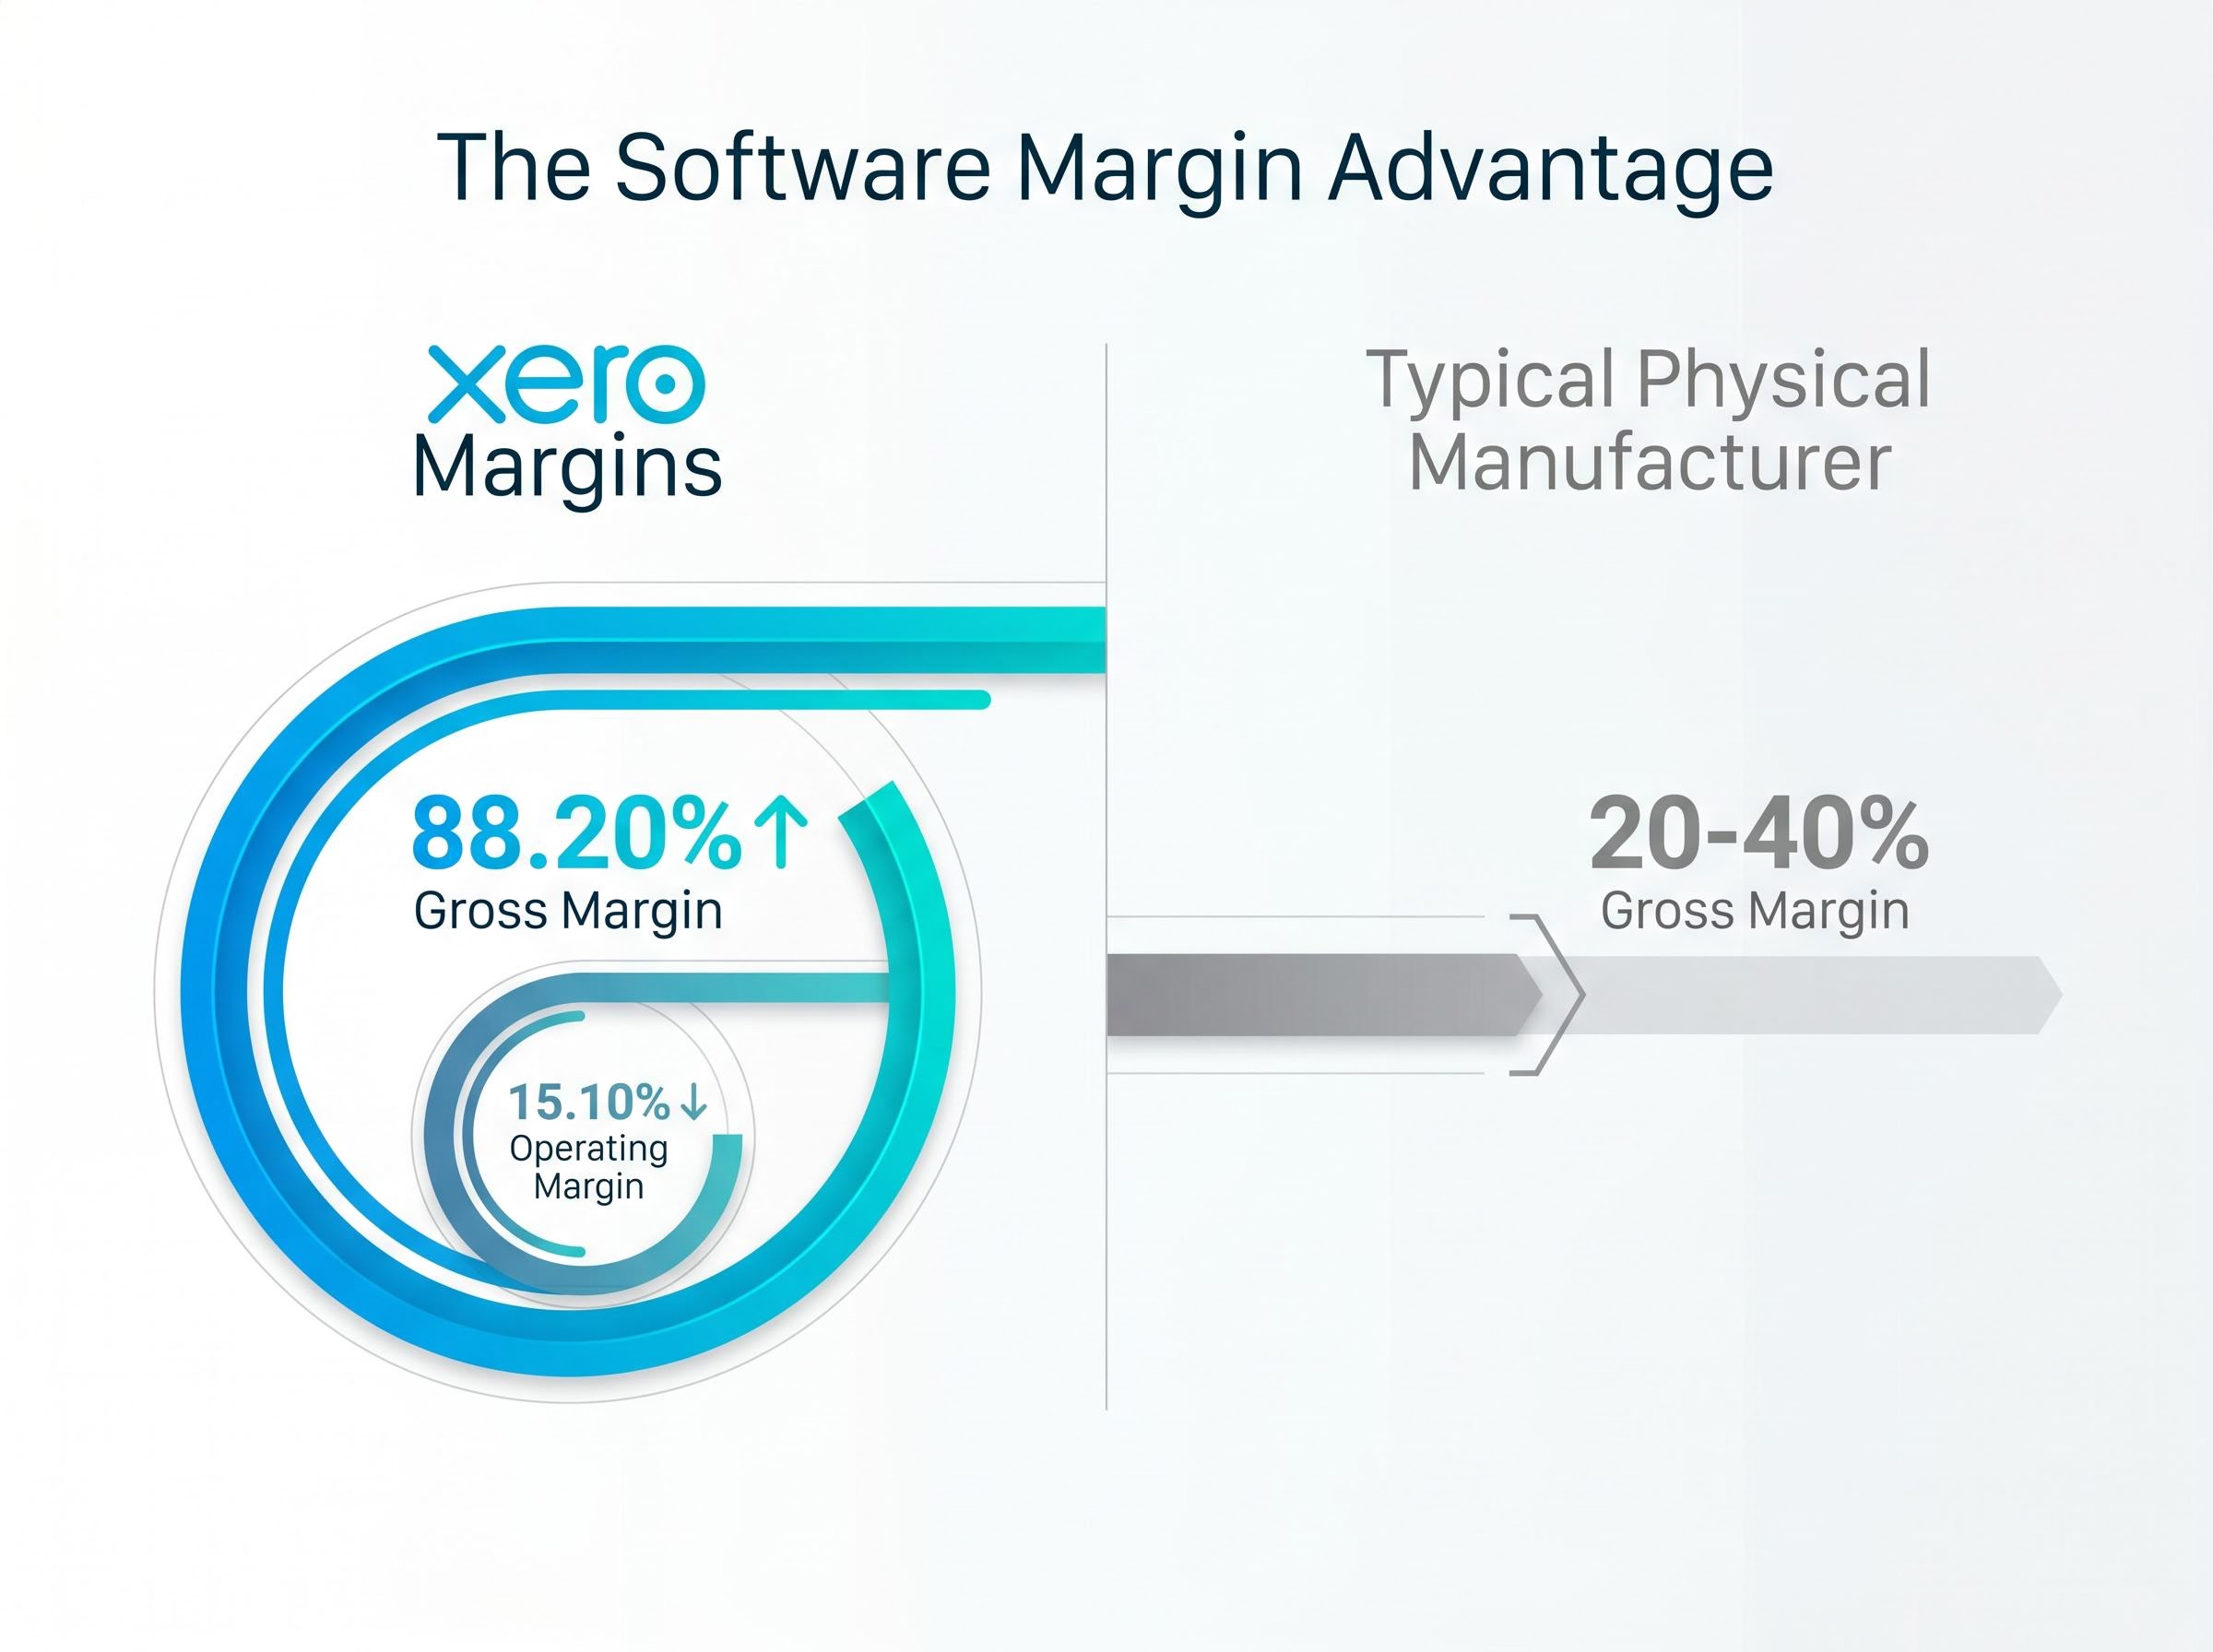
Xero’s gross margin: 88.20% For every dollar of revenue, approximately $0.88 remains after direct delivery costs, available to fund growth, product development, and profit.
That figure sits in a different category from physical businesses, where gross margins in the 20-40% range are typical for manufacturers. The structural gap reflects a fundamental difference in cost architecture:
Software business cost structure:
Physical business cost structure:
Xero’s operating margin stands at 15.10%, which captures the heavier investment the company makes in sales, marketing, and product development on top of its gross margin. The gap between 88.20% gross margin and 15.10% operating margin reflects a company spending aggressively on growth. For investors, gross margin is the signal of structural business quality; operating margin reflects the current stage of that investment cycle.
Investors examining gross margin in isolation miss an important companion metric: the Rule of 40 benchmark combines revenue growth rate and profit margin into a single score, with companies scoring above 40 commanding materially higher revenue multiples and those below facing persistent valuation discounts regardless of individual margin strength.
SaaS companies generate revenue through subscription fees, typically monthly or annual, paid by their customer base. This model creates a visible forward revenue stream that differs materially from businesses reliant on one-off transactions or project-based contracts.
The mechanics compound over time:
When a business can project next year’s revenue base with high accuracy, the risk profile shifts. Analysts can model forward earnings with greater confidence, and the predictability itself becomes a source of valuation premium.
The durability of Xero’s recurring revenue is not theoretical. The company holds an estimated 50-60% market share among cloud-using small and medium enterprises (SMEs) in Australia, with MYOB at approximately 20-25% and QuickBooks and other competitors sharing the remainder.
Australian cloud accounting market share data published in late 2025 places Xero above 60% among cloud-using SMEs, with MYOB holding approximately 20-25% of the online accounting segment, a distribution that reflects how completely Xero has captured the migration from desktop software to cloud-based platforms.
That market position is reinforced by customer acquisition dynamics. Xero commands a 61.38% share of pay-per-click advertising clicks in the Australian cloud accounting category, according to industry data. Dominant click share signals ongoing acquisition advantage, feeding new subscribers into a base that is already retained at scale. For investors evaluating Xero, recurring revenue is not just a business model preference; it directly affects how reliably the company can sustain and grow its margin economics over time.
Software products can reach new international markets at a fraction of the cost required to expand a physical business. There are no warehouses to lease, no local manufacturing facilities to build, no trade logistics to negotiate per shipment. The product is delivered over the internet, and the primary costs of entering a new geography are localisation, marketing, and customer support.
Xero operates across its core markets of Australia, New Zealand, and the United Kingdom, with ongoing expansion efforts in the United States. The barriers a physical business faces in equivalent international expansion are substantially different:
FY26 H1 revenue: $1,194 million (+20% year on year) This figure reflects a scaled international operation already generating over a billion dollars in half-year revenue across multiple geographies.
Scalability is what converts a high-margin recurring revenue model into a genuinely large business over time. Together, margins, recurring revenue, and global scalability form the three structural pillars that explain why tech companies can justify higher valuation multiples even when current earnings are modest. Australian investors evaluating global SaaS names need to weigh this scalability against the cost and complexity of any physical-business international expansion of equivalent ambition.
Xero’s current price-to-sales ratio sits at 8.70x as of May 2026. Its five-year average is 18.65x.
“Xero’s current price-to-sales multiple of 8.70x represents an approximately 53% discount to its five-year historical average of 18.65x.”
That discount is one data point in a broader valuation picture, not a standalone buy signal. Price-to-sales ratios measure how much investors are paying per dollar of revenue but do not account for profitability, cash flow, or capital structure. More comprehensive tools, including discounted cash flow (DCF) models and dividend discount models, provide a fuller assessment of intrinsic value.
The question of whether premium multiples across ASX tech reflect genuine business quality or a valuation trap depends heavily on the consistency of each company’s revenue, the depth of its customer switching costs, and the trajectory of its margins rather than on the P/E figure itself, a distinction that separates investors who ride recoveries from those who average down into deteriorating businesses.
The analyst consensus offers a secondary signal. The average one-year price target for Xero is $141.45, with a range spanning $87.67 to $245.49. That range reflects genuine uncertainty about the pace of multiple re-rating rather than disagreement about underlying business quality.
| Broker | Rating | Price target |
|---|---|---|
| Macquarie | Outperform | $230.30 |
| Morgans | Buy (upgraded April 2026) | $111.00 |
| Citi | Buy (May 2026) | $112.65 |
Morningstar Australia, in analysis published on 14 April 2026, characterised the ASX technology sector as materially undervalued following its sharp decline from the 2025 peak. That institutional framing positions the sector as attractive for patient, long-term investors, though it carries the same caveat as any forward-looking assessment: timing depends on macro conditions that remain uncertain.
For Australian investors actively researching Xero, this section translates the structural thesis into specific numbers, providing a starting point for assessing whether the current price represents a mispriced quality business or a value trap requiring deeper scrutiny.
The structural case is intact: 88.20% gross margins, 20% revenue growth in FY26 H1, and a dominant market position in Australian cloud accounting. These characteristics have remained stable through a period in which the XIJ index declined approximately 39-43% from its August 2025 peak. That operational resilience is the distinguishing characteristic of a quality business versus a speculative one.
The risks, however, are genuine:
AI disruption to SaaS models is accelerating faster than the per-seat subscription economics that underpin companies like Xero can absorb without business model adaptation, with autonomous agents increasingly automating the human-driven workflows that traditional accounting platforms were built to support, creating a structural risk that sits alongside, and compounds, the interest rate and multiple re-rating risks already discussed.
Morningstar’s April 2026 characterisation of the sector as materially undervalued frames the patient-investor case, but patience itself is a risk factor. The sector drawdown has already persisted for approximately nine months, and there is no mechanical rule governing when, or whether, a re-rating occurs.
The investor’s decision ultimately turns on timeframe and risk tolerance, not a binary buy or avoid verdict.
The structural advantages that make software businesses attractive to investors do not disappear in a down cycle. What changes is the price at which those advantages can be acquired. Xero’s high gross margins, recurring subscription revenue, and global scalability remain intact regardless of where the XIJ index closes on any given day.
Sector-level index returns are a poor proxy for business quality in the software sector. The three structural pillars covered in this analysis, margins, recurring revenue, and scalability, remain operational for quality ASX SaaS businesses even when their share prices are under pressure.
Timing a re-rating is genuinely difficult. Investors considering Xero may benefit from conducting deeper valuation analysis using DCF or equivalent methodologies, monitoring the FY26 full-year results scheduled for 14 May 2026, and weighing the structural thesis against their own risk tolerance and investment timeframe.
This article is for informational purposes only and should not be considered financial advice. Investors should conduct their own research and consult with financial professionals before making investment decisions. Past performance does not guarantee future results. Financial projections and analyst price targets are subject to market conditions and various risk factors.
A SaaS gross margin measures the percentage of revenue remaining after direct delivery costs such as cloud hosting and customer support. Xero's gross margin of 88.20% means approximately $0.88 of every revenue dollar is available to fund growth and profit, a structural advantage that physical businesses with margins of 20-40% cannot replicate.
Xero's share price declined approximately 28.7% from January 2025 through May 2026 despite 20% year-on-year revenue growth in FY26 H1, a divergence explained by macro-driven multiple compression rather than any deterioration in the underlying business. Analysts describe the repricing as sentiment-driven, with forward earnings forecasts remaining stable or improving over the same period.
As of May 2026, Xero's price-to-sales ratio stands at 8.70x, representing approximately a 53% discount to its five-year historical average of 18.65x, though this metric alone does not account for profitability or cash flow.
The average one-year analyst consensus price target for Xero is $141.45, with Macquarie setting an Outperform rating with a $230.30 target, Morgans rating it Buy with a $111.00 target, and Citi rating it Buy with a $112.65 target as of May 2026.
Key risks include interest rate sensitivity compressing growth stock multiples, dependence on a macro re-rating for share price recovery, intense US market competition from Intuit's QuickBooks, an elevated price-to-sales ratio of 8.70x that still requires sustained growth to justify, and accelerating AI disruption to the subscription-based accounting software model.