Woolworths: Strong Sales, Shrinking Profits, Slim Upside
13 mins ago

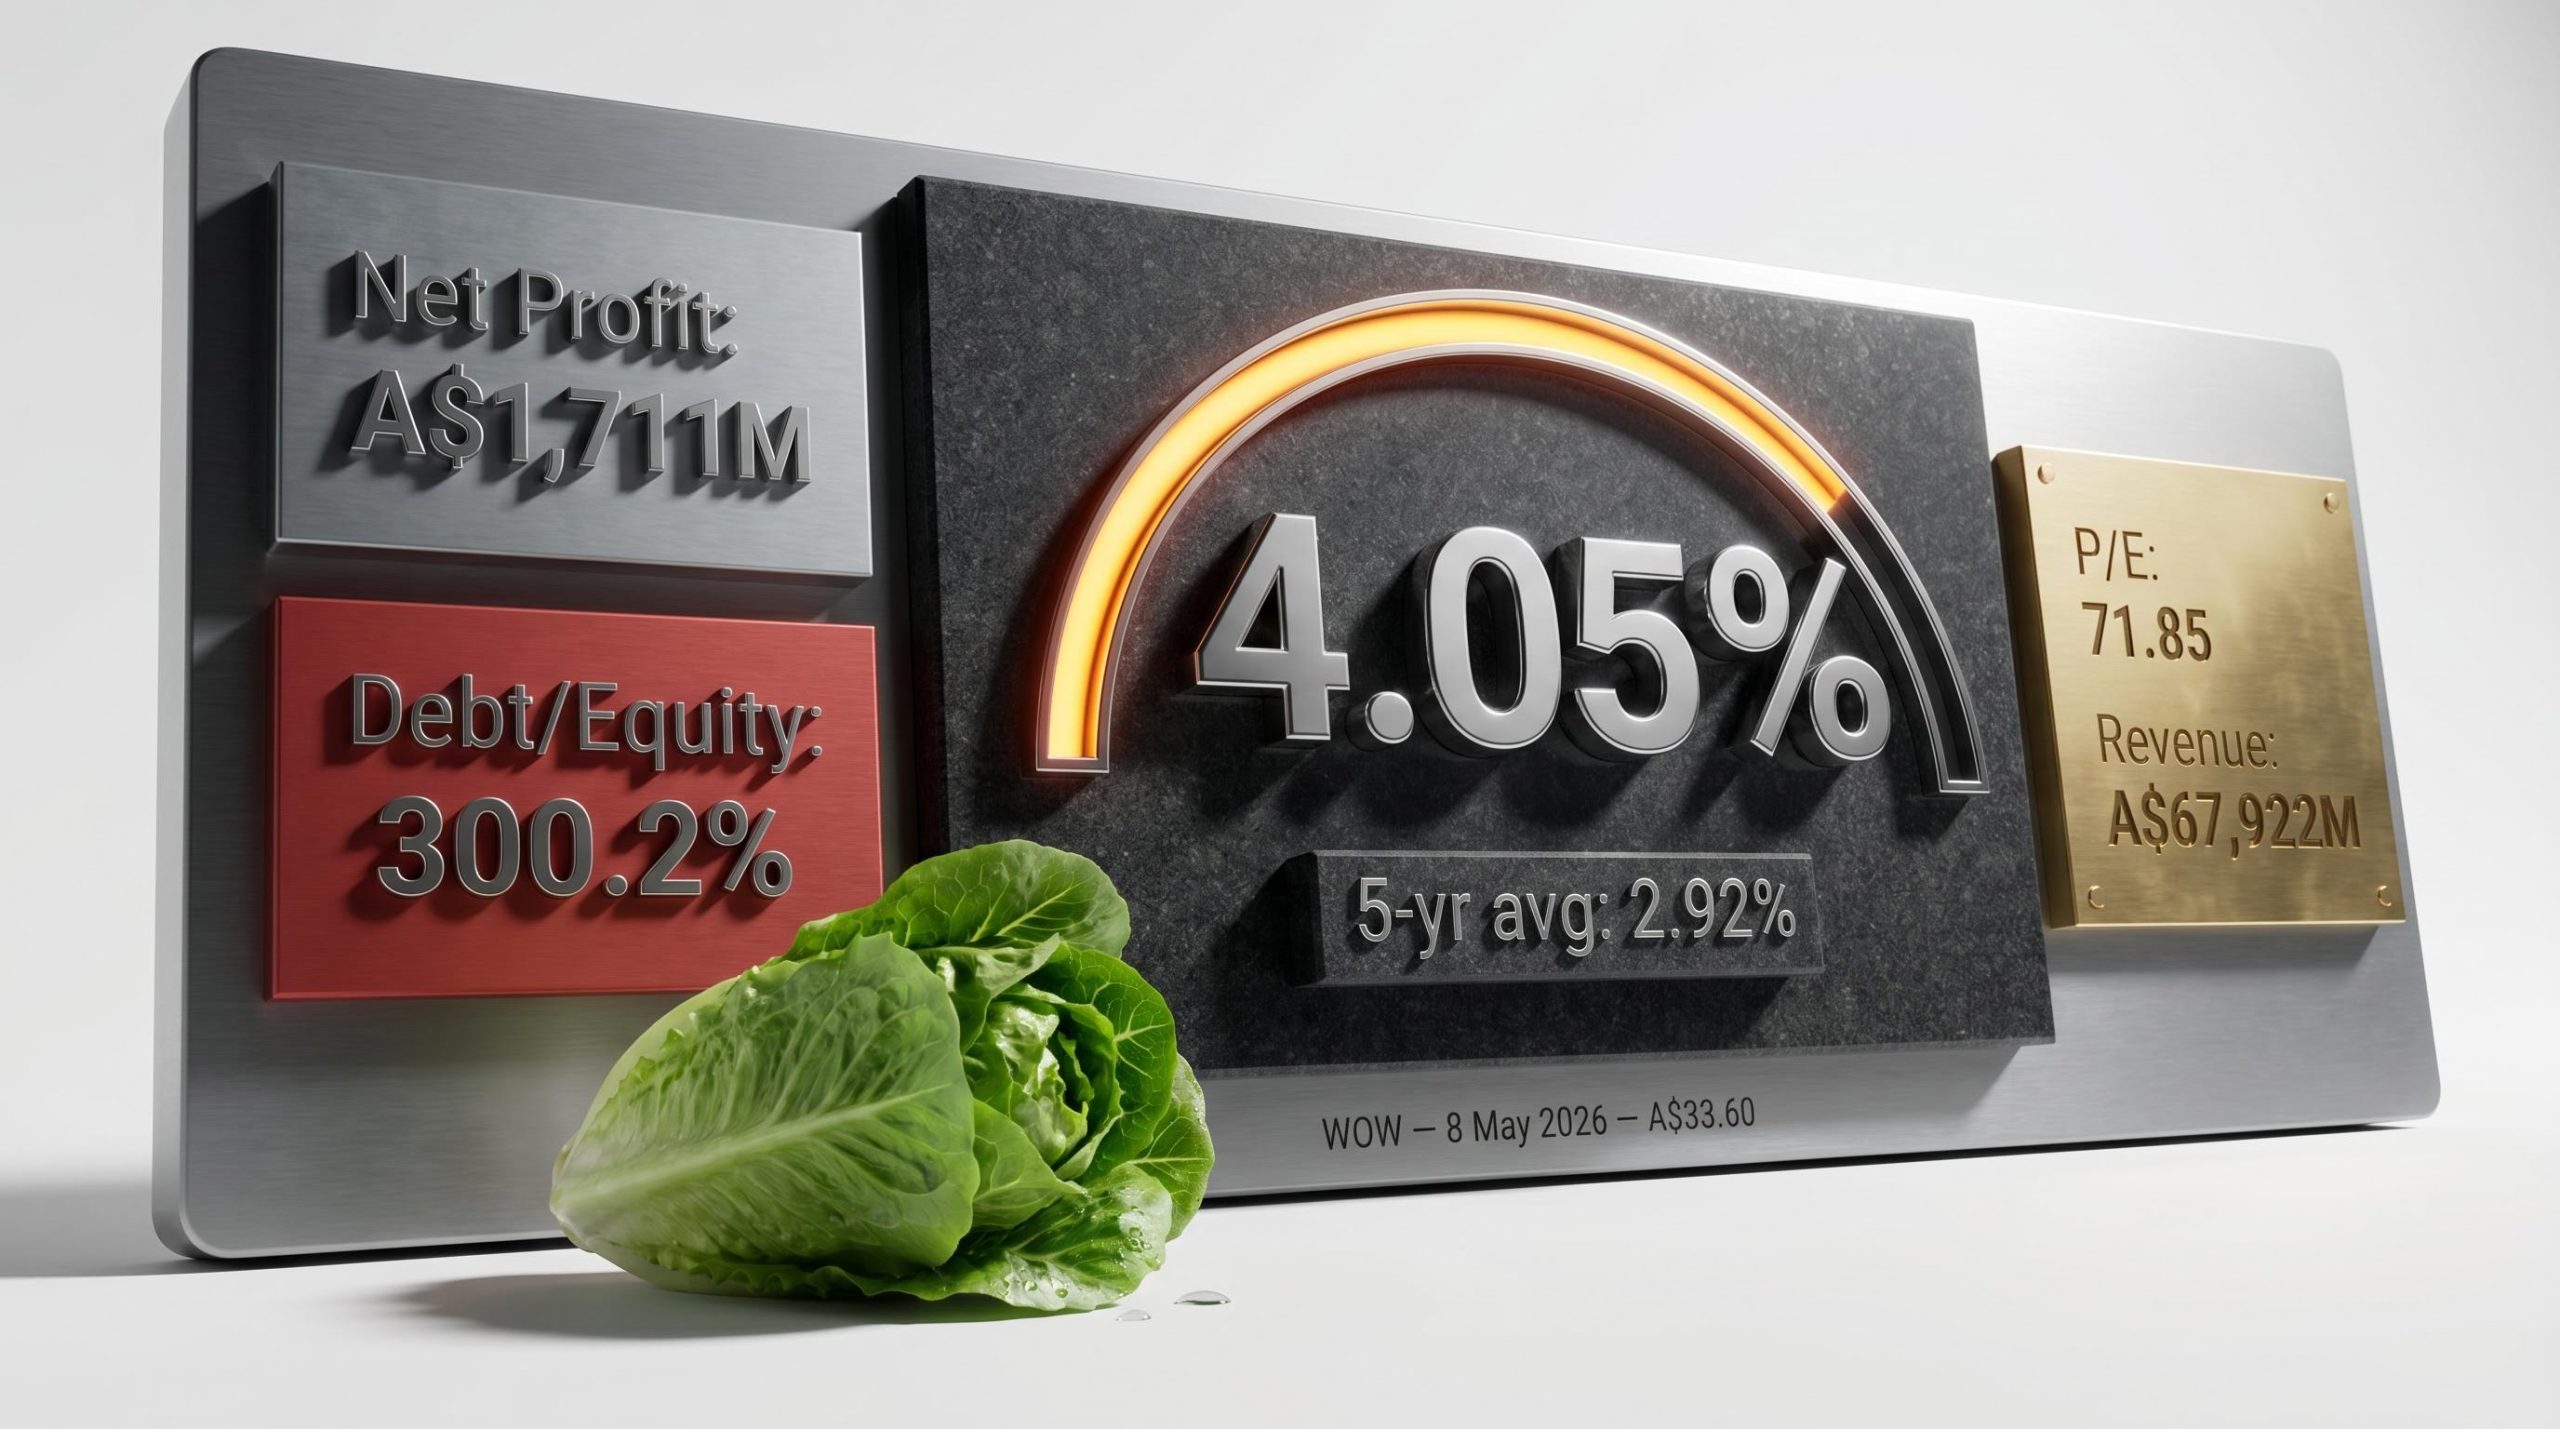
Commonwealth Bank of Australia shares fell more than 8% to $157.16 on 13 May 2026, even as the bank’s quarterly trading update showed cash profits running 4% above the prior year equivalent quarter. That disconnect between a respectable earnings result and a sharp market reaction is not a contradiction. It is a signal worth decoding. The Q3 FY2026 trading update (covering the three months to 31 March 2026) reveals a bank navigating a more complex operating environment than the headline profit figure suggests. The RBA’s 25 basis point rate hike on 6 May 2026, lifting the cash rate to 4.35%, added fresh pressure to an already strained household sector. CBA’s own management acknowledged elevated geopolitical and macroeconomic risk as a direct input into provisioning decisions. This analysis examines how CBA is structuring its capital, liquidity, provisioning, and funding base to weather this environment, whether its lending and deposit growth represents genuine competitive momentum, and what the valuation gap means for investors assessing the stock on fundamental grounds.
Cash net profit after tax of approximately $2.7 billion for Q3 FY2026, with statutory NPAT of approximately $2.6 billion, should have been an unremarkable result. Year on year, it represented a 4% increase. On its face, that is not the profile of a stock that deserves to lose nearly a tenth of its market capitalisation in a single session.
The market, however, was reading a different number. Cash profit came in 1% below the first-half quarterly average, and it was that sequential deceleration, not the year-on-year comparison, that repriced the stock. Three distinct signals were embedded in the sell-off:
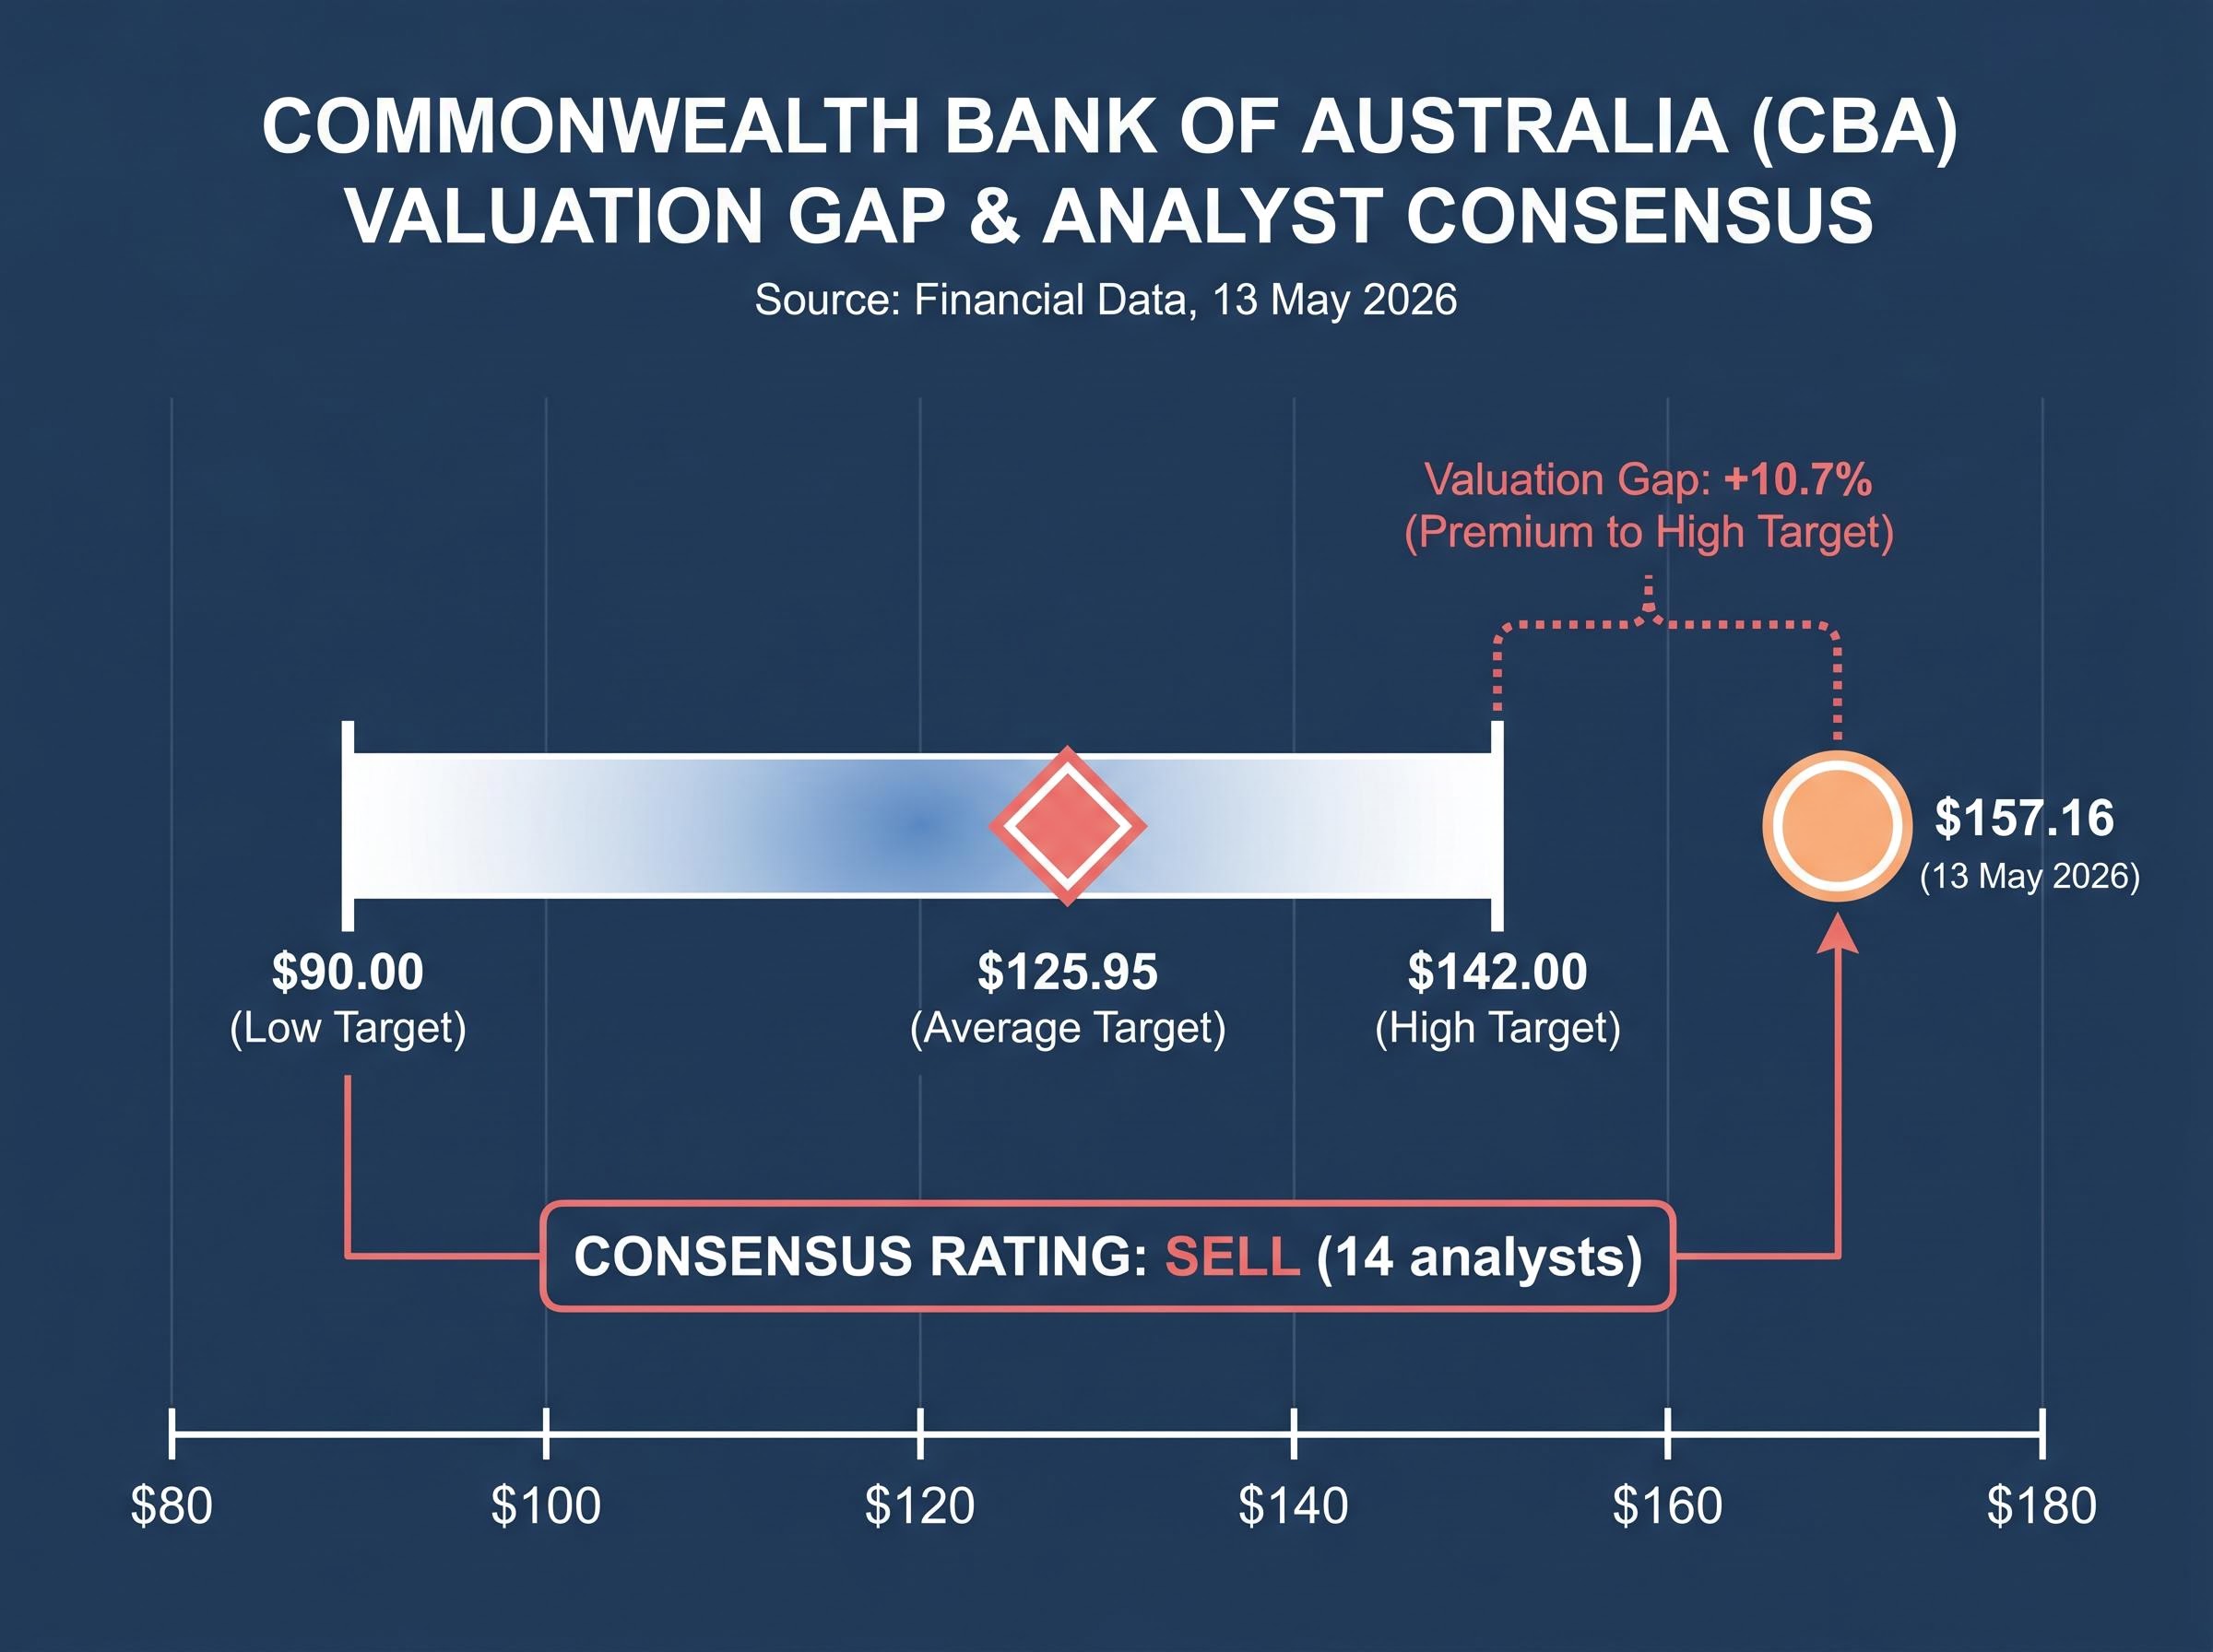
Consensus price target range: AUD $90.00 (low) to AUD $142.00 (high), with an average 12-month target of AUD $125.95 from 14 analysts, all carrying a consensus SELL rating.
Even after the 8% decline, CBA’s share price remained more than $15 above the highest analyst target. The sell-off was a valuation reassessment, not an earnings collapse.
CBA’s CET1 ratio (the core measure of a bank’s loss-absorbing capital as a proportion of its risk-weighted assets) stood at 11.6% for Q3 FY2026. That sits below the major bank sector average of approximately 12.2%, according to KPMG’s April 2026 analysis, and marginally below NAB’s half-year CET1 of 11.65%. On an internationally comparable basis, CBA’s capital position is broadly aligned with or slightly above peers.
| Metric | CBA | NAB | Sector Average |
|---|---|---|---|
| CET1 Ratio | 11.6% | 11.65% | ~12.2% |
| Deposit Funding Share | 79% | Broadly similar | N/A |
| Deposit-to-Loan Ratio | ~88% (sector) | ~88% (sector) | 88% |
Strong ratios do not automatically translate to strong returns. CEO Matt Comyn’s language in the trading update was telling: CBA had deliberately structured its balance sheet settings to “support customers through economic and geopolitical uncertainty.” That phrasing signals a defensive posture, one that prioritises resilience over return maximisation.
CBA had secured $32 billion in long-term wholesale funding by the Q3 reporting date, described as “well advanced on FY2026 funding task.” In practical terms, completing the bulk of wholesale issuance early in the financial year reduces roll-over risk. If credit markets tighten in the second half, CBA has already locked in the funding it needs, a degree of operational flexibility that deposits alone cannot provide.
A loan impairment expense of $316 million for Q3 FY2026 is not, on its own, alarming. What makes the quarter’s provisioning noteworthy is the $200 million increase in forward-looking collective provisions, the reserves a bank sets aside not against loans that have already soured, but against scenarios that have not yet materialised.
Forward-looking provision increase: CBA added $200 million to collective provisions during Q3 FY2026, reflecting management’s assessment that geopolitical and macroeconomic tail risks warranted balance sheet preparation now rather than later.
Actual loan losses remained low. Consumer arrears edged upward modestly. Corporate troublesome and non-performing exposures increased over the period. None of these individually constitutes acute stress. Together, they form a pattern of early-stage deterioration that CBA’s risk function has chosen to provision against rather than absorb reactively.
Three categories of stress signal are informing that decision:
Credit impairment signals across the Big Four in early 2026 have differed sharply in character: NAB’s $706 million charge reflected geopolitical stress concentrated in agriculture, transport, and manufacturing, while Westpac’s April decline traced to a one-off transaction cost with no loan quality implications, illustrating how the same provisioning headline can carry fundamentally different forward-looking risk content depending on the source.
The RBA’s March 2026 Financial Stability Review provides context. Mortgage stress was projected to reach 30.3% of borrowers under further rate rises, though the average owner-occupier borrower remained approximately 15 months ahead on scheduled payments. The 6 May 2026 rate hike to 4.35% has since added further pressure to that equation.
The RBA March 2026 Financial Stability Review assessed mortgage stress reaching 30.3% of borrowers under further rate rises while finding that the average owner-occupier remained approximately 15 months ahead on scheduled repayments, a cushion that the May 2026 rate hike has since begun to erode.
Provisioning decisions are among the most forward-looking signals a bank’s management team sends to the market. A $200 million lift is not a crisis indicator, but it is a deliberate statement about where CBA believes risks are accumulating.
Net interest margin, or NIM, is the spread between what a bank earns on its loans and what it pays on its deposits. It is the central engine of bank profitability. When rates rise, lending revenue increases because new and variable-rate loans reprice upward. That sounds straightforwardly positive.
The countervailing pressure arrives with a lag. The sequential logic works as follows:
CBA’s Q3 FY2026 net interest income grew 1%, a result that illustrates these competing forces in near-perfect balance. Expanded deposit margins, volume growth in both lending and deposits, and replicating portfolio earnings supported the figure. Cash rate lag effects, competitive pressures in home and business lending, NZD depreciation, and two fewer days in the quarter worked against it.
The trading update named home lending and business lending markets specifically as sources of competitive pressure. Intensified deposit competition, as savers actively seek higher-rate products, has increased CBA’s funding costs even as it supports deposit volume growth. The bank is paying more to retain and attract deposits, a structural shift that compresses the margin benefit of higher rates.
For any investor assessing CBA through a rate-cycle lens, understanding this dual-direction impact is foundational. A rate hike is not simply good for banks. Its benefit depends on timing, competition, and whether volume growth compensates for margin compression.
CBA’s twelve-month volume data to March 2026 reveals a pattern that rewards close reading. Not every growth figure tells the same story.
| Category | 12-Month Growth | vs System | Signal |
|---|---|---|---|
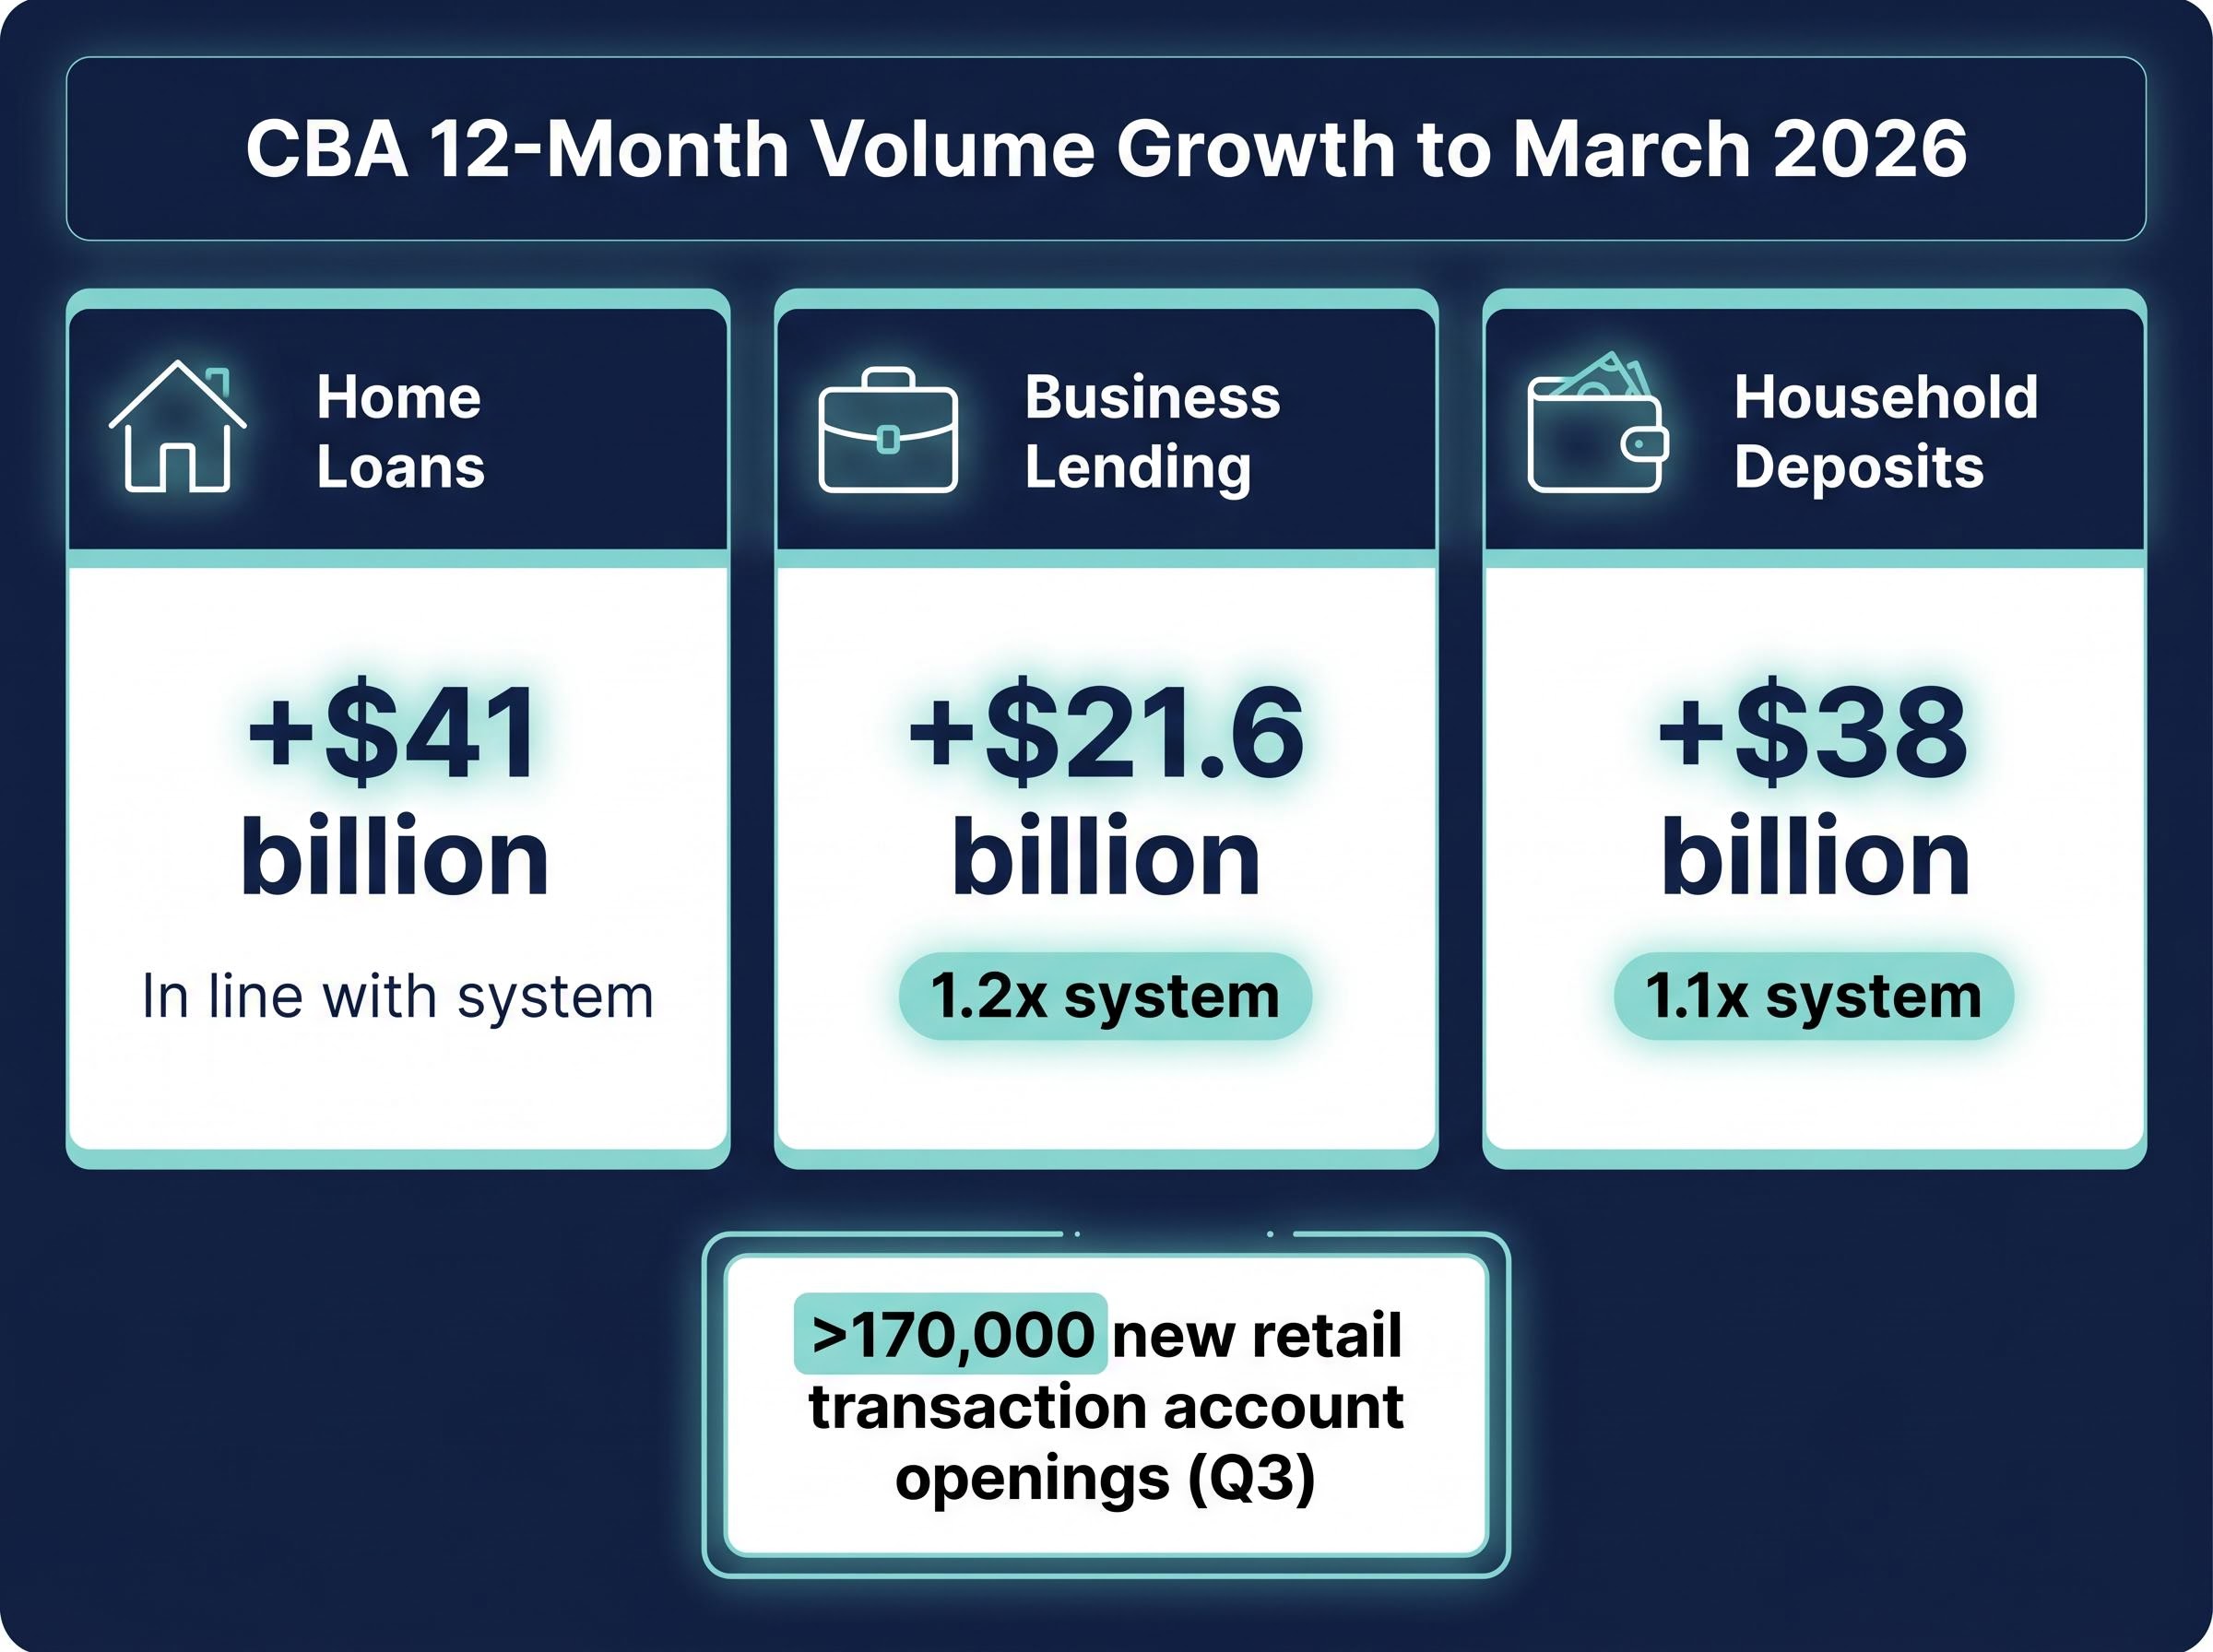
| Home Loans | $41 billion | In line with system | Holding share, not gaining |
| Business Lending | $21.6 billion | 1.2x system | Active share gain |
| Household Deposits | $38 billion | 1.1x system | Structural funding advantage |
Business lending at 1.2 times system growth and household deposits at 1.1 times system represent the strongest signals of competitive positioning. Home loan growth tracking in line with system suggests a deliberate margin-over-volume trade-off rather than competitive weakness.
The bank also reported more than 170,000 new retail transaction account openings in Q3, a leading indicator of customer acquisition momentum with long-term deposit and cross-sell implications.
Operating costs rose 1% (excluding restructuring and notable items), driven by:
Above-system deposit growth, in particular, is a structural advantage. It reduces reliance on more expensive wholesale funding and provides a more stable funding base through periods of market disruption.
The analytical threads assembled across this analysis point in two directions simultaneously. The bull case and bear case both rest on verified data, and they do not resolve neatly into a single conclusion.
Bull case:
Bear case:
The Australian Financial Review characterised CBA as facing “an uphill battle to win back investors in 2026,” a framing that captures the market’s scepticism about whether premium pricing is warranted at this stage of the cycle.
The analyst community’s concern is not that CBA is poorly managed. It is that CBA is expensively priced. The 8% sell-off compressed but did not resolve the valuation gap between market price and consensus target. Investors are left to weigh quality at a premium against quality at fair value.
The Q3 FY2026 trading update confirms what CBA’s balance sheet has signalled for some time: this is a structurally resilient institution. Deposit funding at 79%, wholesale funding well advanced, and above-system growth in business lending and household deposits are not characteristics of a bank under duress.
The provisioning build and competitive margin pressure, however, are genuine forward-looking considerations. CBA’s management, through CEO Matt Comyn’s commentary about continuing to “adjust operational settings in response to evolving conditions,” has signalled that defensive positioning will persist.
The RBA’s March 2026 Financial Stability Review assessed the Australian financial system as broadly stable while noting elevated global risks. The rate environment, at 4.35% following the 6 May 2026 hike, remains contingent on inflation trajectory, and further moves in either direction would materially alter CBA’s NIM outlook.
The RBA’s May 2026 rate decision passed with eight of nine Board members voting for the hike, with forward guidance language that neither committed to a pause nor signalled a fourth move, leaving Q2 CPI and labour market data as the critical inputs before July 2026, a degree of policy uncertainty that makes CBA’s provisioning posture and NIM trajectory materially harder to forecast at this stage of the cycle.
Three forward-looking indicators warrant monitoring:
The question CBA investors carry forward is precise: whether a bank with these structural advantages justifies a persistent premium to both peer valuations and analyst consensus targets. The 8% sell-off is not evidence that CBA is deteriorating. It is evidence that the market is reconsidering what a high-quality, defensively positioned Australian bank is worth at this point in the rate cycle.
Investors holding CBA and weighing whether to act on the post-sell-off price will find our deep-dive into CBA’s broker consensus and downside scenarios covers the specific price targets from Morgans, UBS, and other covering analysts in detail, including the earnings growth rate that would be required to justify the current multiple and the portfolio concentration considerations that apply to SMSF and direct equity holders.
This article is for informational purposes only and should not be considered financial advice. Investors should conduct their own research and consult with financial professionals before making investment decisions. Past performance does not guarantee future results. Financial projections are subject to market conditions and various risk factors.
A CET1 ratio measures a bank's core loss-absorbing capital as a proportion of its risk-weighted assets. CBA's CET1 ratio stood at 11.6% in Q3 FY2026, which is marginally below the major bank sector average of approximately 12.2% but broadly aligned with peers on an internationally comparable basis.
CBA's cash profit came in 1% below the first-half quarterly average, breaking the narrative of accelerating returns that had supported the stock's premium valuation. The market also reacted to a $200 million increase in forward-looking collective provisions and the fact that the share price remained well above the highest analyst consensus target even after the sell-off.
As of the Q3 FY2026 update, 14 analysts carried a consensus SELL rating on CBA with an average 12-month price target of AUD $125.95, ranging from a low of AUD $90.00 to a high of AUD $142.00, all of which sat below the post-sell-off share price of $157.16.
Rate hikes initially boost CBA's lending revenue as variable-rate loans reprice upward, but deposit repricing follows with a lag, increasing funding costs. Competitive pressure in both home lending and business lending then further narrows the margin, meaning the net benefit depends on timing, competition, and whether volume growth compensates for margin compression.
The $200 million rise in forward-looking collective provisions reflects CBA management's assessment that geopolitical and macroeconomic tail risks warrant balance sheet preparation ahead of any actual loan losses. While arrears edged up only modestly and corporate non-performing exposures increased incrementally, the build is a deliberate forward-looking signal rather than a response to acute existing stress.