On 5 May 2026, the Reserve Bank of Australia lifted the cash rate to 4.35%. The same day, Westpac confirmed a 77-cent interim dividend, one cent above consensus expectations. For income investors weighing Australian bank dividends against term deposits now averaging roughly 4.5%, the two announcements landed as a single question: do the Big Four still earn their place in an income portfolio?
The answer depends almost entirely on a variable most headline yield tables ignore: franking credits. Strip them out and the banks look like a marginal proposition against term deposits. Factor them in and two of the four names deliver grossed-up yields that leave cash rates well behind. What follows is a comparison of confirmed yields, grossed-up figures, payout sustainability, and the investor profile each bank best serves, drawn from the most recent half-year results and May 2026 pricing.
How the four banks rank on income right now
The headline numbers offer a starting point, and for most investors, a misleading one.
| Bank | FY26 Dividend | Headline Yield | Grossed-Up Yield | Franking Status |
|---|---|---|---|---|
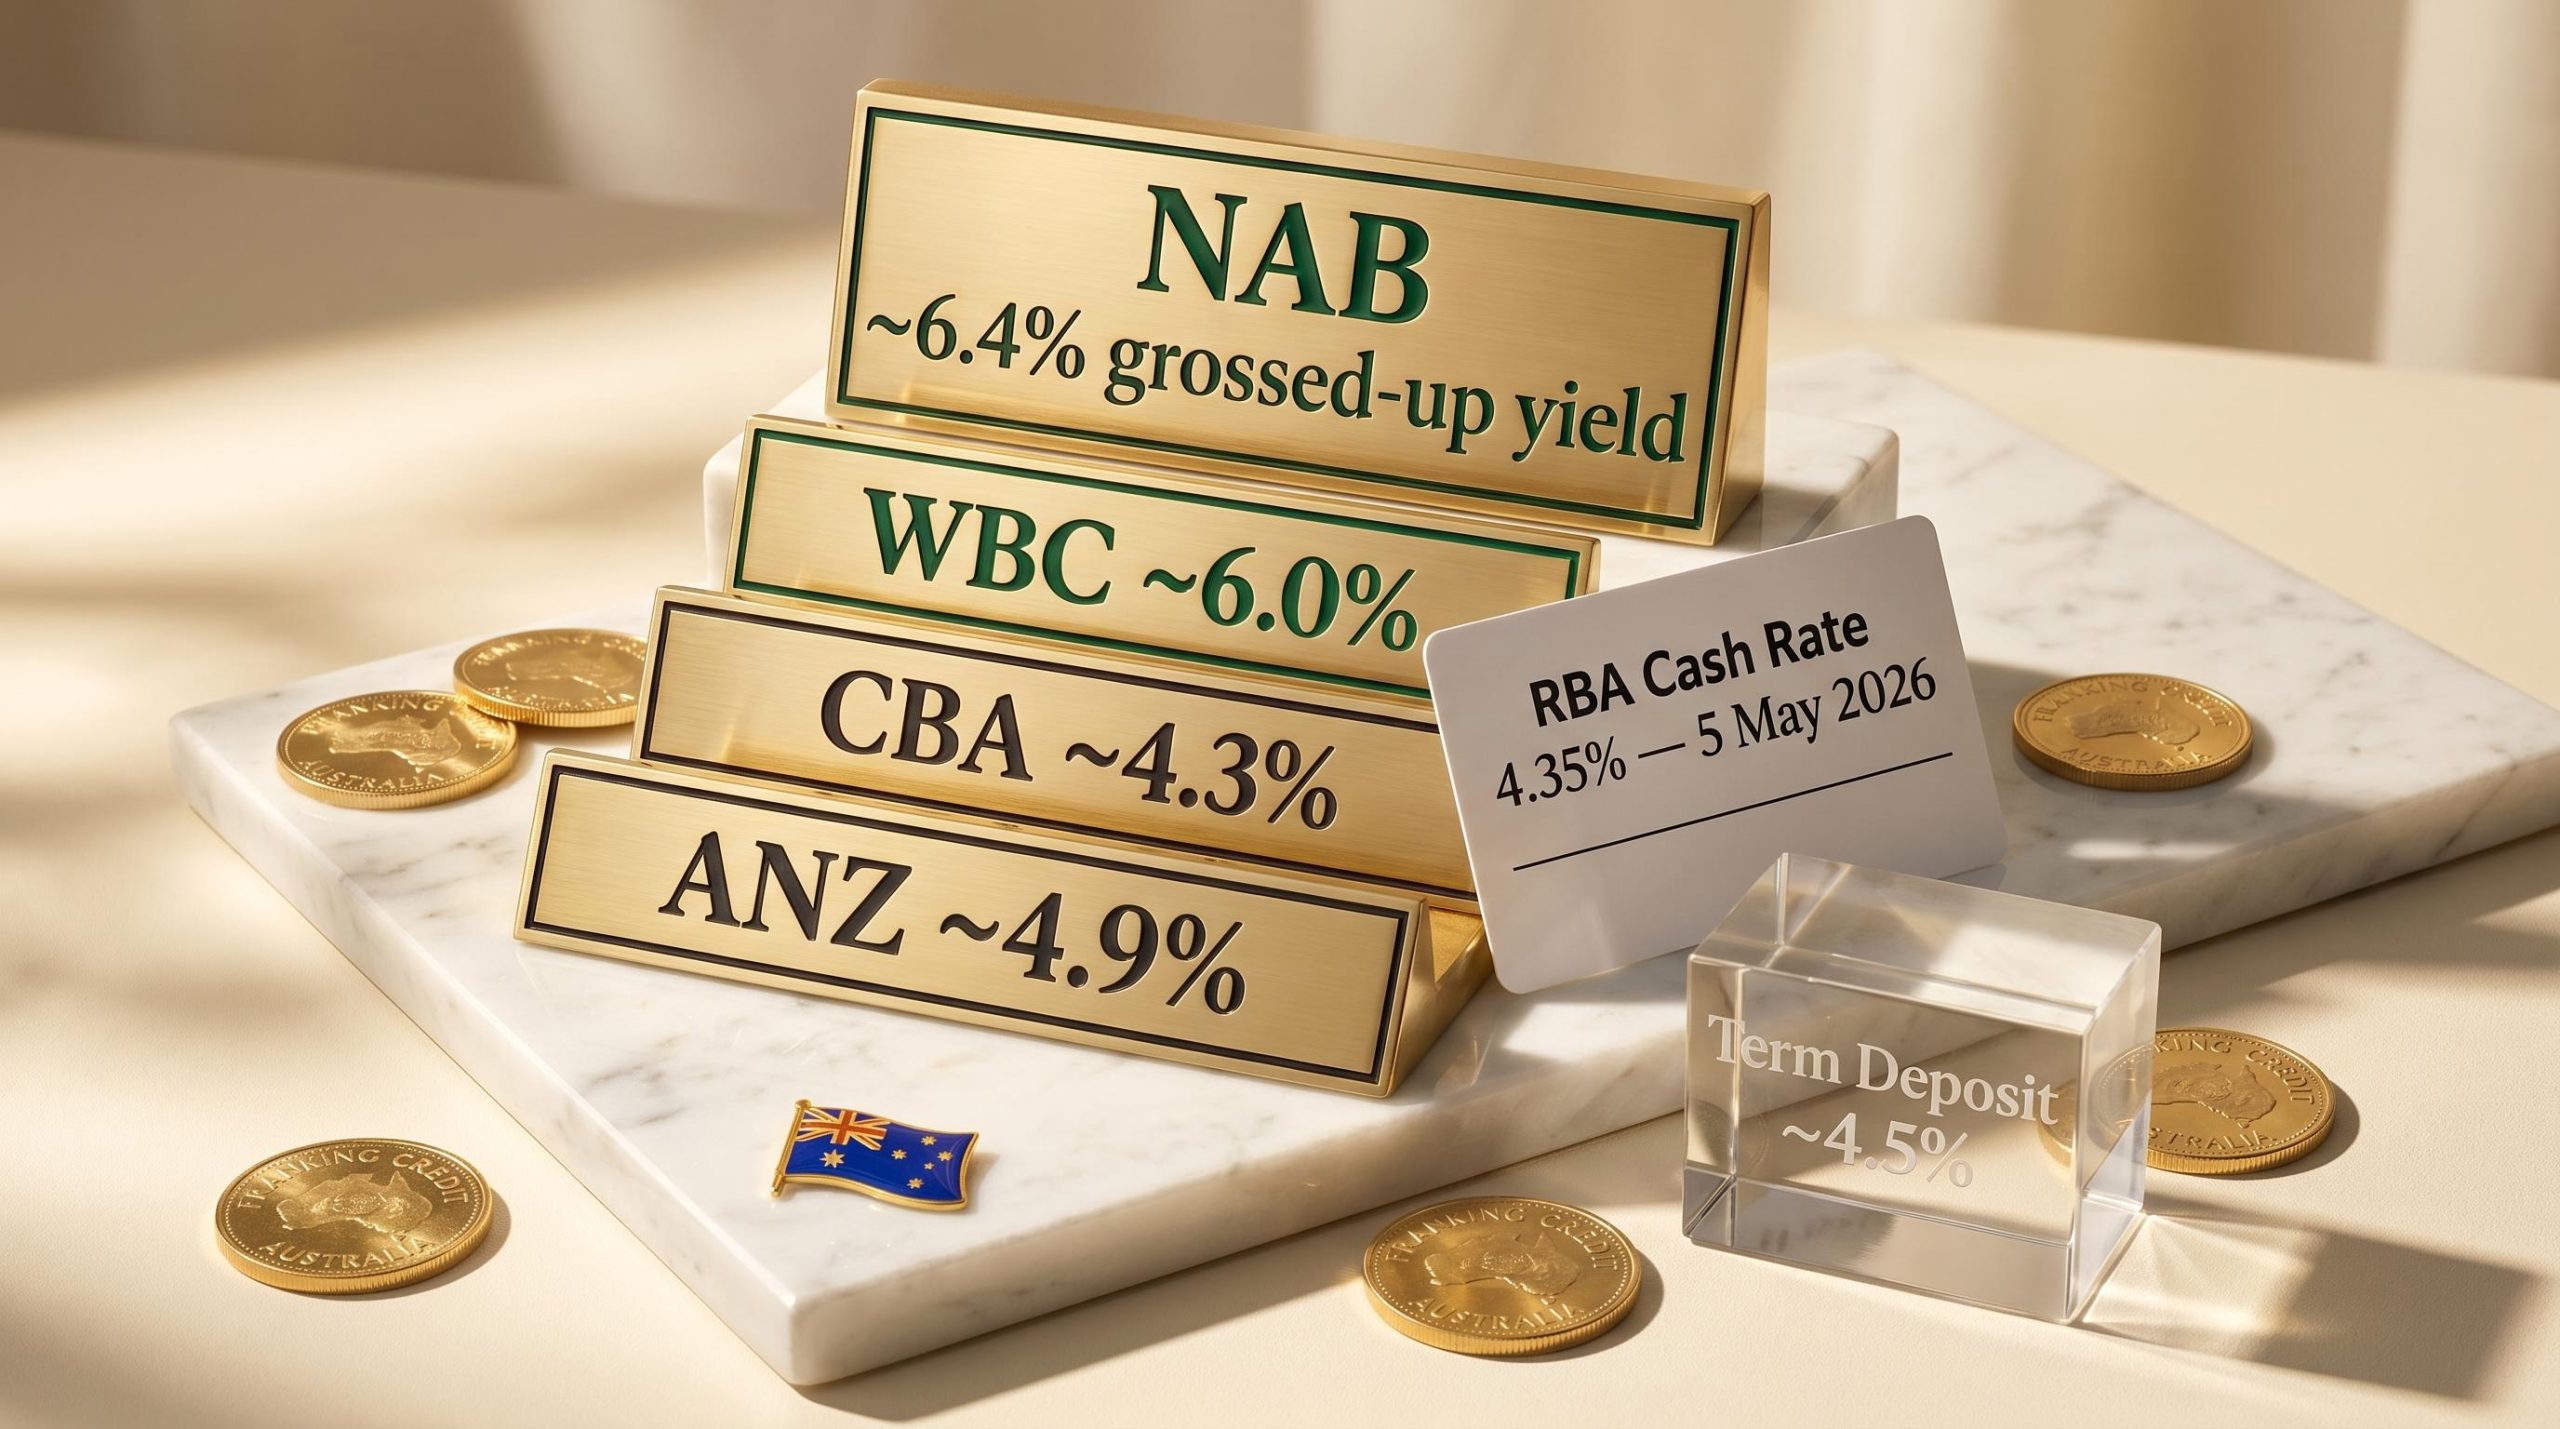
| ANZ | $1.68 | ~4.6% | ~4.9% | Partial |
| NAB | $1.76 | ~4.45% | ~6.4% | Full |
| WBC | $1.56 | ~4.2% | ~6.0% | Full |
| CBA | $5.20 | ~3.0% | ~4.3% | Full |
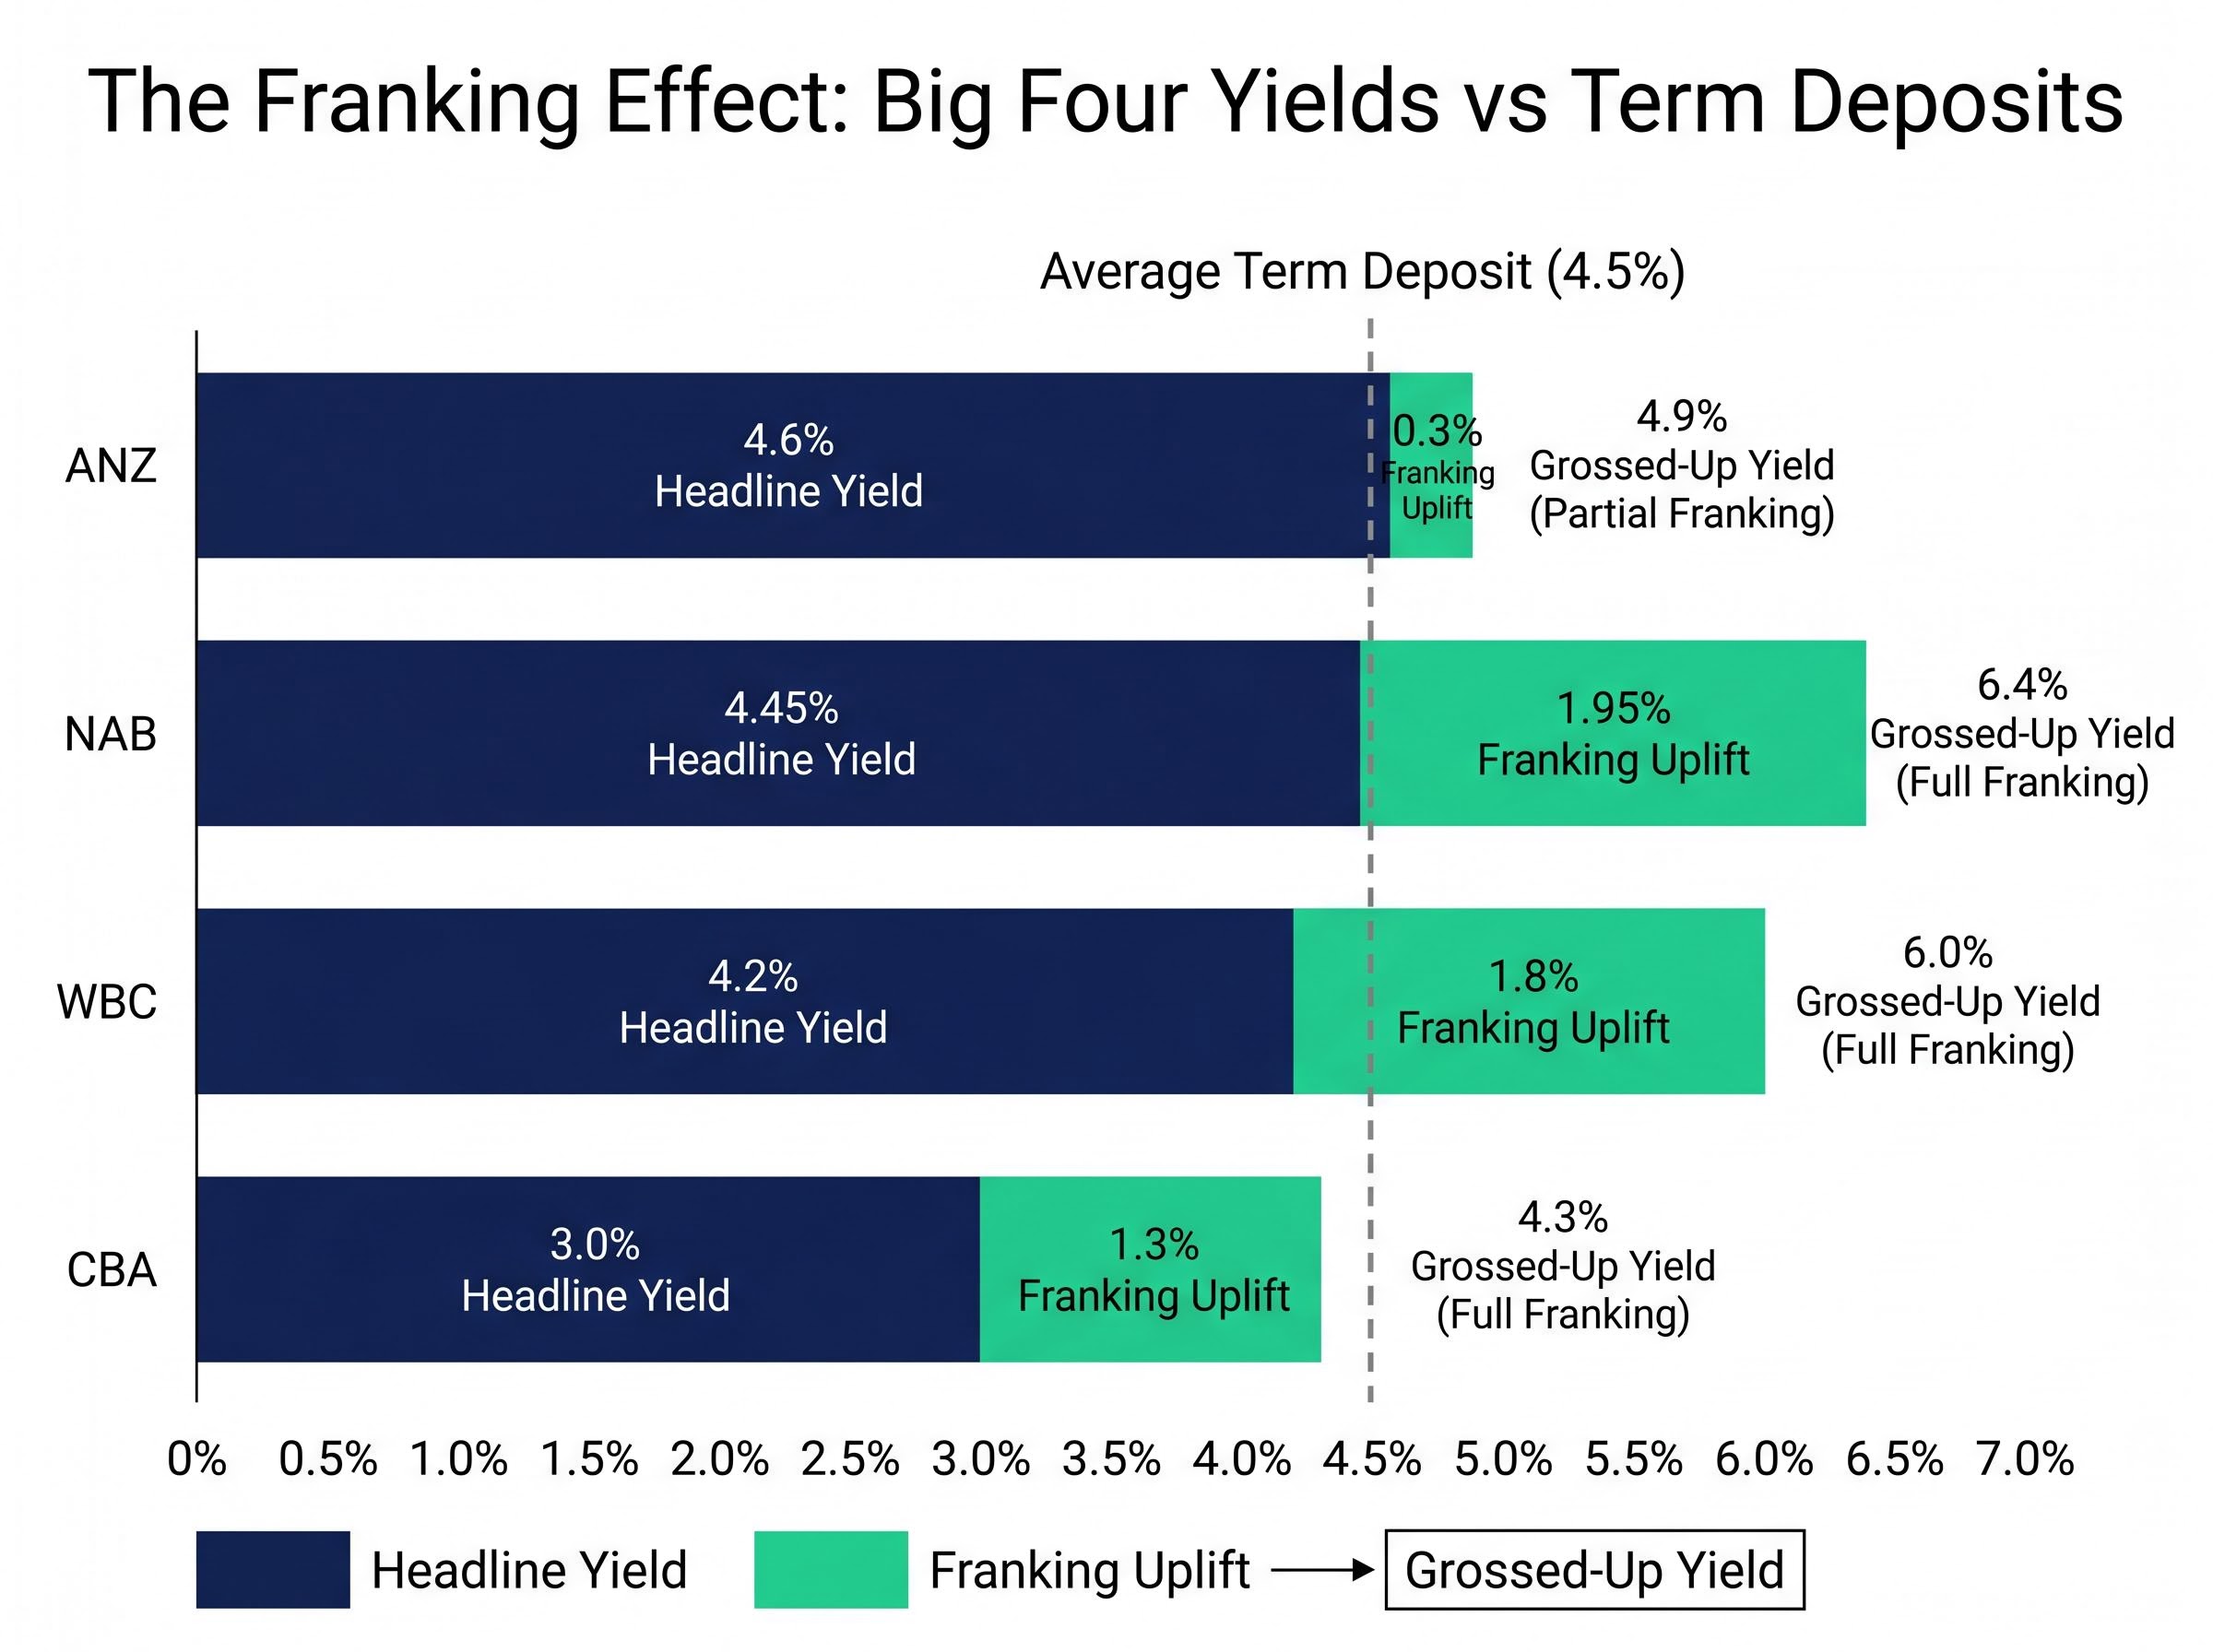
On headline yield alone, ANZ leads at approximately 4.6%, followed by NAB, WBC, and CBA in a distant fourth. That ranking inverts the moment franking credits are included.
NAB’s grossed-up yield rises to approximately 6.4%, placing it firmly at the top of the income hierarchy. WBC follows at roughly 6.0%. ANZ, despite its headline advantage, delivers a conservative grossed-up yield of only 4.9% because its dividends are partially franked. No restoration to full franking has been announced or signalled.
NAB’s grossed-up yield of approximately 6.4% makes it the highest-yielding Big Four name for Australian investors who can utilise franking credits, despite sitting second on headline yield.
The gap between ANZ’s headline lead and its grossed-up position is not a footnote. It is the single most material differentiator in this comparison, and investors sorting by headline yield alone will systematically undervalue NAB and WBC.
When big ASX news breaks, our subscribers know first
What franking credits actually add to your return
Franking credits represent tax already paid at the corporate level. When a fully franked dividend is received, the investor is entitled to a credit for the 30% corporate tax the company has already remitted. The practical effect: every dollar of fully franked dividend is worth more than a dollar, because the tax office treats part of the investor’s tax obligation as already settled.
The grossed-up dividend calculation uses a straightforward formula: the cash dividend multiplied by 30, divided by 70, reflecting the 30% corporate tax already remitted by the company before any payment reaches the investor, which is why a $1,000 fully franked dividend translates to $1,428.57 of total value for a pension-phase SMSF receiving the credit as a cash refund.
In dollar terms across the four banks:
- CBA’s FY26 dividend of $5.20 per share grosses up to approximately $7.43, an uplift of $2.23 per share
- NAB’s $1.76 grosses up to approximately $2.51, adding $0.75 per share
- WBC’s $1.56 grosses up to approximately $2.23, adding $0.67 per share
- ANZ’s $1.68 grosses up to only approximately $1.72 on a conservative basis, an uplift of just $0.04 per share, reflecting the limited benefit of partial franking
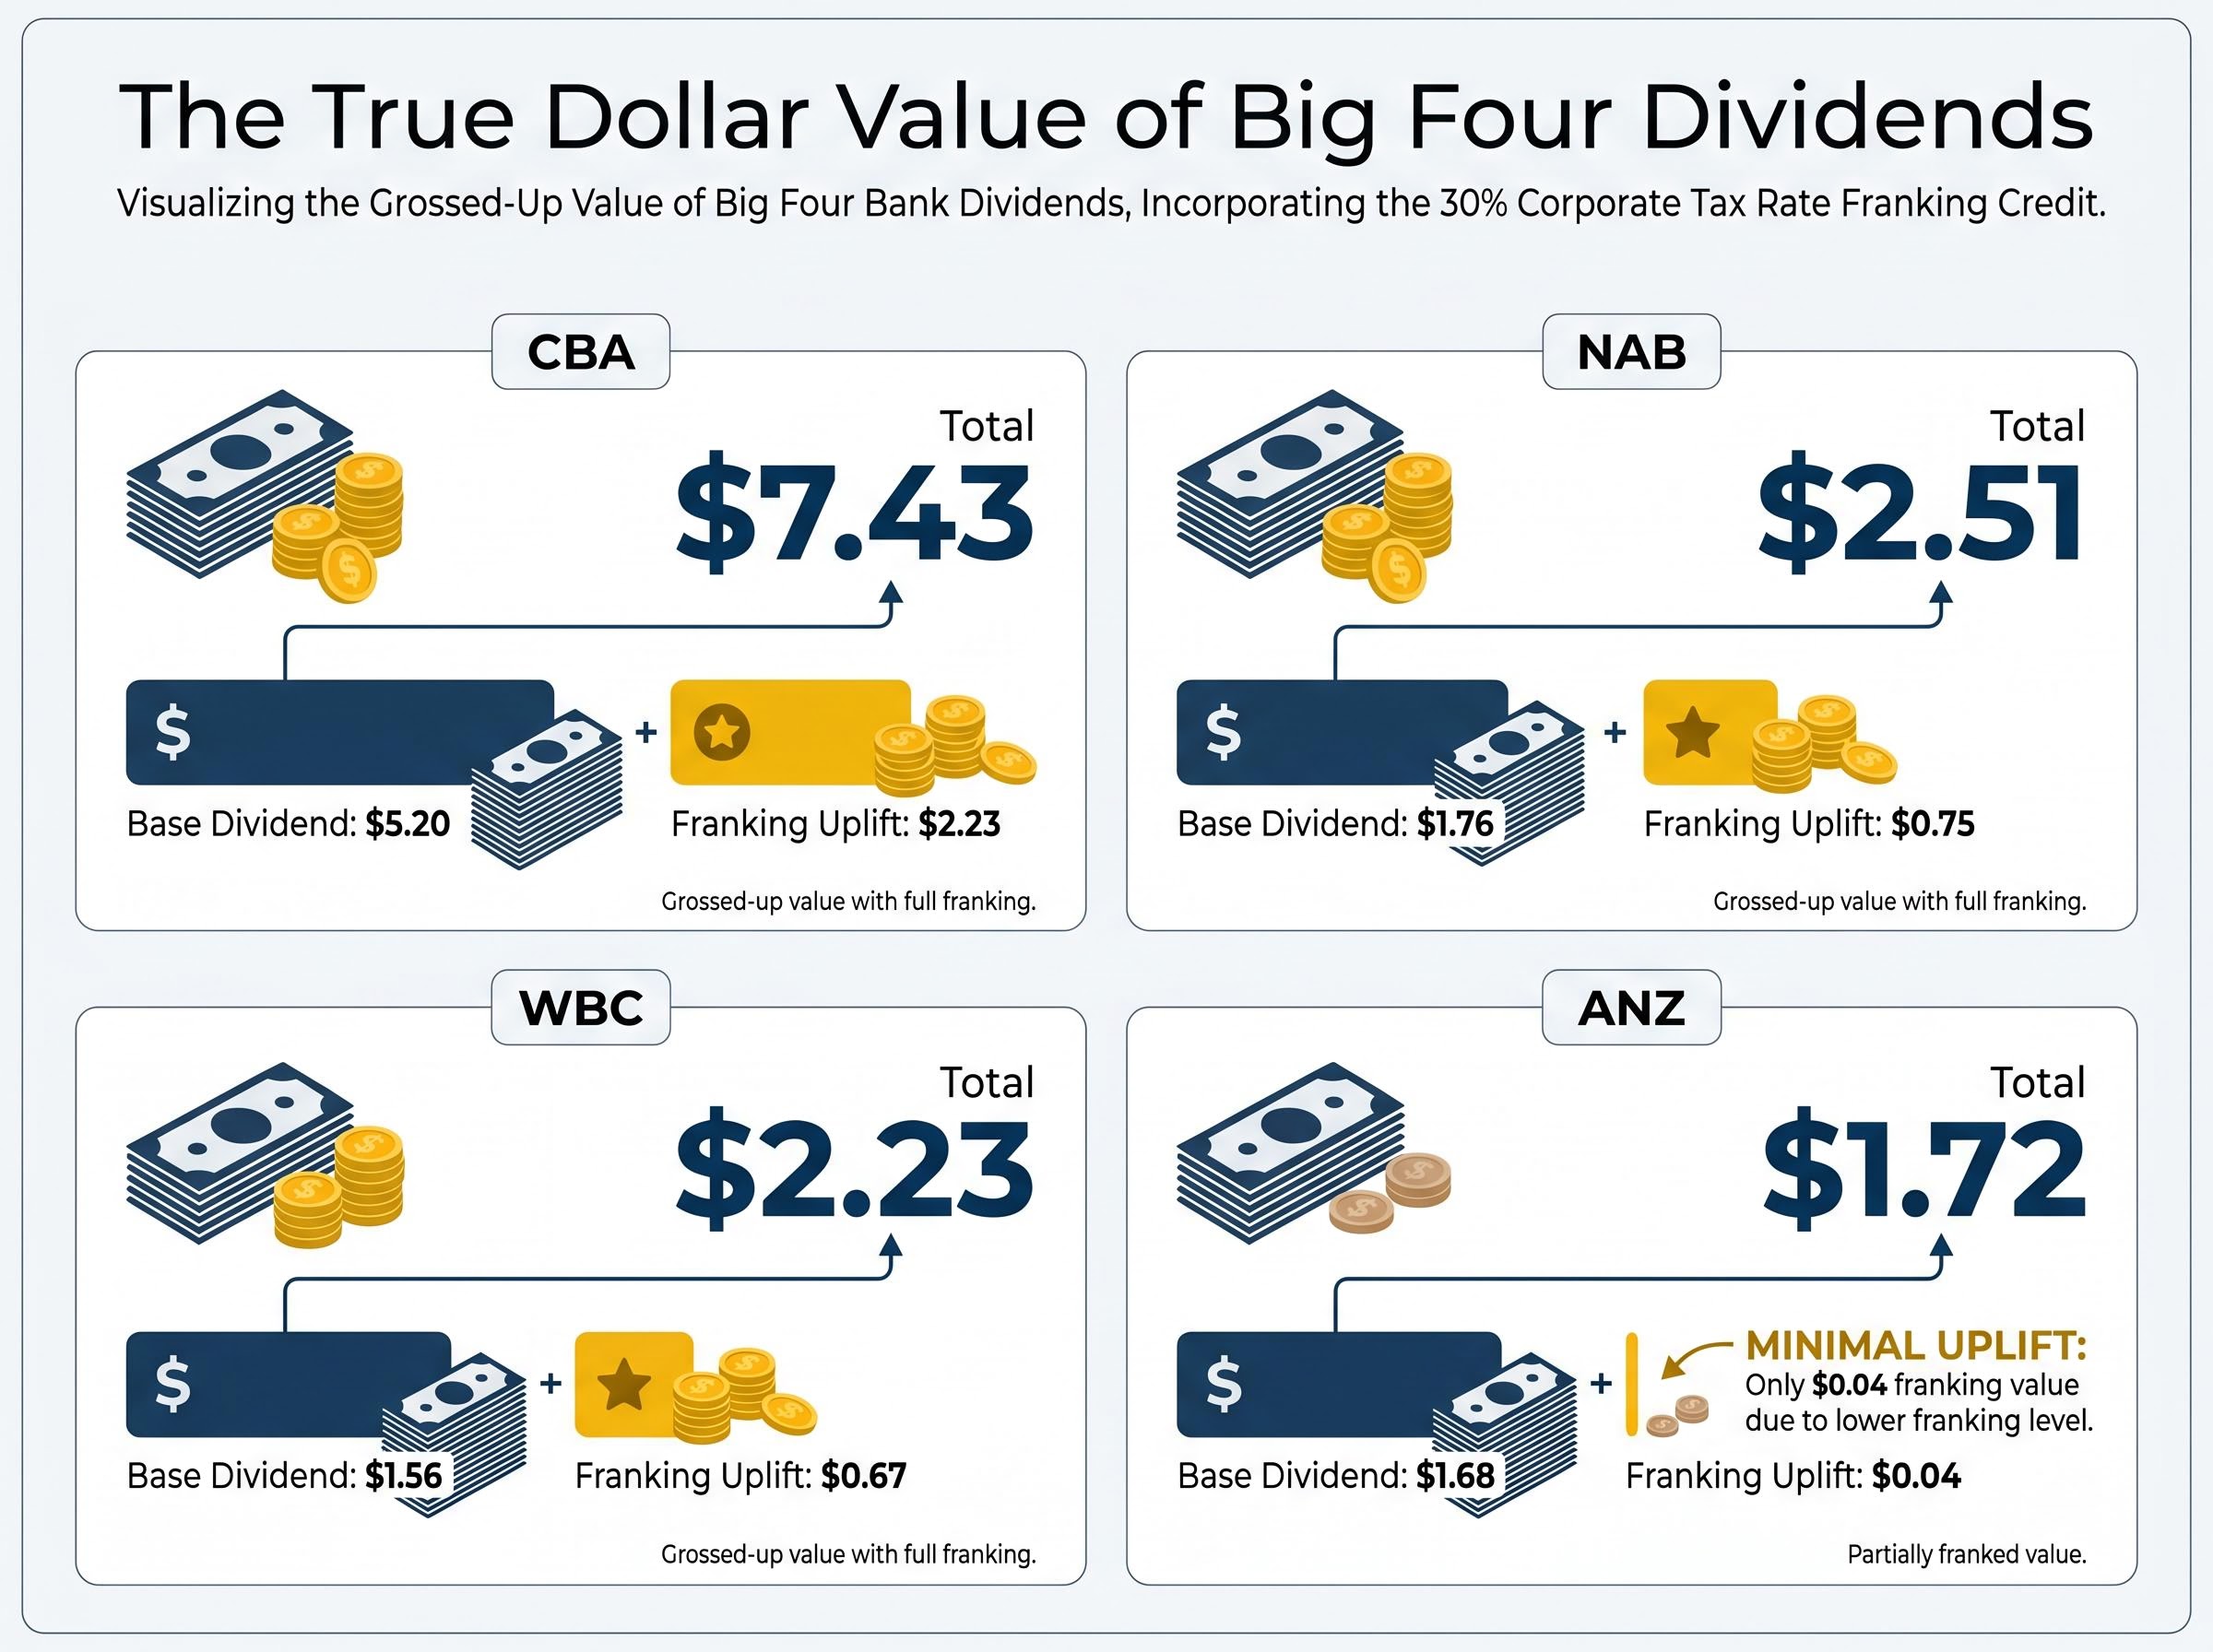
The contrast is stark. For every $1,000 in dividends received from NAB, the franking credit adds roughly $428 in tax value. The same $1,000 from ANZ adds a fraction of that.
How superannuation investors benefit most
Investors in the superannuation accumulation phase pay a concessional tax rate of 15% on income. Because the franking credit reflects 30% corporate tax already paid, the credit exceeds the investor’s tax liability, and the difference is applied against other taxable income within the fund. The maths favours full franking heavily at this tax rate.
For pension-phase super funds, the benefit is even more direct. With a zero marginal tax rate, the entire franking credit is refunded as cash by the ATO. A fully franked dividend from NAB or WBC delivers materially more after-tax income to a pension-phase investor than the same headline payment from ANZ.
The ATO franking credit refund rules confirm that eligible individuals and superannuation funds can receive excess franking credits as a cash refund where the credit exceeds their tax liability, a mechanism that makes pension-phase investors the most direct beneficiaries of fully franked dividends from NAB and WBC.
ANZ’s partial franking is most disadvantageous for precisely this group.
What the RBA’s May rate rise means for dividend sustainability
The RBA’s decision to lift the cash rate to 4.35% on 5 May 2026 disrupts the declining-rate narrative that shaped much of the earlier 2025 analysis around bank earnings. For dividend investors, the shift matters in a specific and positive direction.
The RBA May 2026 cash rate decision, which lifted the target rate by 25 basis points to 4.35%, cited persistent inflation and evolving global risk factors as the primary drivers, providing the monetary policy context that frames near-term NIM expectations across the Big Four.
Higher rates generally expand net interest margins (NIMs), the spread between what banks charge borrowers and pay depositors. Wider NIMs support the earnings base from which dividends are funded. Where earlier commentary from S&P Global (April 2025) referenced NIM compression from lower rates, the May hike partially reverses that pressure dynamic.
According to KPMG’s Big Four Banks Half Year 2026 Results Analysis (approximately 5 May 2026), the four banks delivered combined half-year profit after tax of $15.2 billion, signalling sustained dividend-paying capacity.
CBA reported half-year cash profit of $5.45 billion, beating forecasts and underpinning the $2.35 interim dividend increase. Payout ratios across all four banks sit at or near upper policy limits: CBA targets 70-80% and currently pays 73%; NAB and WBC both target 65-75% and both sit at approximately 73%.
The term deposit comparison is where the rate environment becomes directly actionable:
- CBA’s headline yield of approximately 3.0% sits below the 4.5% term deposit average, an unfavourable comparison on cash income alone
- NAB (4.45%) and ANZ (4.6%) marginally exceed term deposits on headline yield
- NAB’s grossed-up yield of approximately 6.4% and WBC’s of approximately 6.0% substantially exceed the 4.5% term deposit rate for eligible investors, a gap term deposits cannot close because they carry no franking benefit
Growth versus yield: matching each bank to an investor profile
The four banks are not interchangeable income holdings. Each suits a different investor situation.
| Bank | Best Suited To | Key Advantage | Key Risk |
|---|---|---|---|
| CBA | Growth-oriented income investors | Only Big Four with consistent DPS growth | Premium valuation compresses yield |
| NAB | Tax-aware yield maximisers | Highest grossed-up yield (~6.4%) | Payout ratio near policy ceiling |
| WBC | Tax-aware yield maximisers | Strong grossed-up yield (~6.0%), positive dividend surprise | Payout ratio near policy ceiling |
| ANZ | Investors indifferent to franking | Highest headline yield (~4.6%) | Partial franking, flat payout trajectory |
CBA is the growth-oriented income choice. Its FY26 dividend of $5.20 is forecast to rise to $5.50 in FY27, representing approximately 5.8% growth, the only Big Four name delivering consistent dividend-per-share increases at current valuations. The trade-off is a 3.0% headline yield that sits below term deposits.
- Pro: Only Big Four bank with a visible dividend growth trajectory
- Con: Share price of approximately $173 means the yield premium arrives slowly
NAB and WBC are yield-maximising choices for investors who prioritise grossed-up income today. Both are fully franked, both substantially exceed term deposits on a grossed-up basis, and both offer modest consensus dividend growth (NAB FY27: $1.82; WBC FY27: $1.60).
- Pro (NAB): Grossed-up yield of 6.4% leads all four banks
- Con (NAB): Limited earnings surprise potential constrains further upside
- Pro (WBC): Confirmed 77-cent interim beat expectations; payment date 26 June 2026 offers a near-term income event
- Con (WBC): Yield growth dependent on earnings, which consensus projects as modest
ANZ carries yield trap characteristics. The 4.6% headline yield is the highest, but partial franking, a flat payout history (FY27 consensus: $1.72), and no announced path to full franking restoration make it the least compelling option for tax-aware income investors.
- Pro: Highest face-value yield among the Big Four
- Con: Partial franking erodes the after-tax advantage that defines the bank dividend thesis
All four banks offer dividend reinvestment plans. CBA confirmed no discount on its $2.35 interim (record date 19 February 2026), and WBC confirmed no discount on the 77-cent interim (payment date 26 June 2026). Payout ratios at or near upper policy bounds structurally cap dividend growth to the pace of earnings growth for all four names.
The structural case for bank dividends beyond 2026
Australia’s concentrated banking structure gives the Big Four a durable competitive position that few other ASX sectors replicate. Deep customer relationships, a tightly regulated environment, and an oligopolistic market share collectively provide the pricing power that underpins consistent dividend payments across economic cycles.
That structural strength does not translate into unlimited upside. All four banks trade near record highs, with CBA in particular appearing stretched relative to international peers. Elevated valuations compress prospective total return even if dividends hold or grow modestly. No share buybacks or additional capital returns are anticipated in the near term, and no APRA regulatory changes impacting dividend policy have been noted through May 2026.
The analyst consensus on CBA is the starkest expression of the valuation tension embedded in the Big Four income story: all 14 covering analysts rate the stock a sell, with an average price target of $130.34 implying approximately 25.5% downside from late April 2026 pricing, yet the income case remains compelling for investors who entered at lower levels and are holding for grossed-up yield rather than capital appreciation.
Why payout ratio ceilings matter for long-term income planning
With payout ratios at 73-74% across all four banks, sitting at or near the upper bounds of stated policy targets, the only lever for dividend growth is earnings growth itself. The payout ratio cannot expand meaningfully from here without breaching regulatory comfort zones.
Consensus forecasts project flat-to-modest earnings growth, implying dividend growth of roughly 3-5% annually at best. Three structural risk factors frame the long-term income outlook:
- Valuation compression: Record-high share prices limit capital gains potential and push entry yields lower
- Payout ratio ceiling: No scope for dividend growth to outpace earnings growth
- Limited earnings surprise potential: Mature business models in a regulated oligopoly produce steady, not accelerating, profit trajectories
This makes the Big Four compelling as income-first holdings but unsuitable as total return vehicles for growth-oriented investors. Position sizing should reflect that distinction.
The income verdict for Australian investors in 2026
For tax-aware income investors, the grossed-up yield hierarchy determines the ranking:
- NAB (grossed-up yield approximately 6.4%): The strongest income proposition for investors who can utilise full franking credits, delivering nearly 200 basis points above the term deposit alternative
- WBC (grossed-up yield approximately 6.0%): A close second with the added signal of a positive dividend surprise; the 26 June 2026 payment date offers near-term income for new holders
- CBA (grossed-up yield approximately 4.3%): The right choice for investors who prioritise dividend growth over current yield and are comfortable with a premium entry price
- ANZ (grossed-up yield approximately 4.9%): Defensible only for investors indifferent to partial franking; the headline yield advantage dissipates once tax treatment is applied
NAB’s grossed-up yield of approximately 6.4% versus the term deposit rate of approximately 4.5% illustrates the gap that franking credits create for eligible investors, a difference term deposits structurally cannot close.
The RBA’s rate at 4.35% supports the near-term earnings base, and combined Big Four half-year profits of $15.2 billion confirm that dividend-paying capacity remains intact. Valuation risk is the primary concern for new entrants, particularly at CBA’s current pricing.
The income case for Australia’s Big Four is genuine, but it rewards selectivity. Investors who understand the grossed-up hierarchy, recognise the payout ratio ceiling, and match their bank choice to their tax profile will extract meaningfully better after-tax income than those who default to the highest headline number.
For investors who want income exposure beyond direct bank share holdings, our dedicated guide to ASX income ETFs compares passive options like VHY and HYLD against active and dividend-harvesting strategies, with five-year total return data showing that low-cost passive vehicles outperform most higher-yielding alternatives over the long term despite offering lower headline distributions.
This article is for informational purposes only and should not be considered financial advice. Investors should conduct their own research and consult with financial professionals before making investment decisions. Past performance does not guarantee future results. Financial projections are subject to market conditions and various risk factors.