Finfluencer Rules Won’t Work Until the Penalty Beats the Profit
1 hr ago

Sonic Healthcare’s share price has shed more than 16% since 1 January 2026, while the stock trades at a price-to-sales ratio 46% below its five-year historical average. For a segment of the market, that combination looks like a straightforward buying opportunity.
The cheapness is real. But so is a three-year net profit compound annual growth rate (CAGR) of negative 27%, a $3.87 billion net debt position, and a US operations restructuring whose costs and timeline remain publicly undefined. Sonic Healthcare (ASX: SHL) sits at the intersection of genuine valuation compression and unresolved financial headwinds, making it one of the more analytically demanding stocks on the ASX healthcare board.
This analysis walks through the financial track record, the debt burden, the competing valuation signals from analyst consensus and Morningstar, and the variables that will determine whether SHL at approximately $18.91 is a discount or a trap.
The market’s verdict has been clear. As of 12 May 2026, SHL trades at approximately $18.91, a year-to-date decline of 16.19%. That slide has not arrived as a single shock; it is the product of multi-quarter repricing that began when COVID-era testing revenues fell away and intensified after H1 FY26 earnings per share came in at $0.531, below a consensus estimate of approximately $0.58.
The EPS miss compounded pre-existing unease. Investors had already been recalibrating expectations through 2024 and 2025 as net profit settled at roughly a third of its pandemic peak. The H1 result confirmed that the recovery trajectory would be slower than some models assumed.
SHL’s 16% year-to-date decline sits within a broader ASX healthcare sector rout that has pushed the S&P/ASX 200 Health Care Index to a six-year low, with five compounding forces, including RBA rate hikes, AUD appreciation, and collapsing consumer confidence, creating simultaneous headwinds for every large-cap name in the index.
What makes SHL analytically interesting rather than merely weak is the range of professional disagreement about where it should trade:
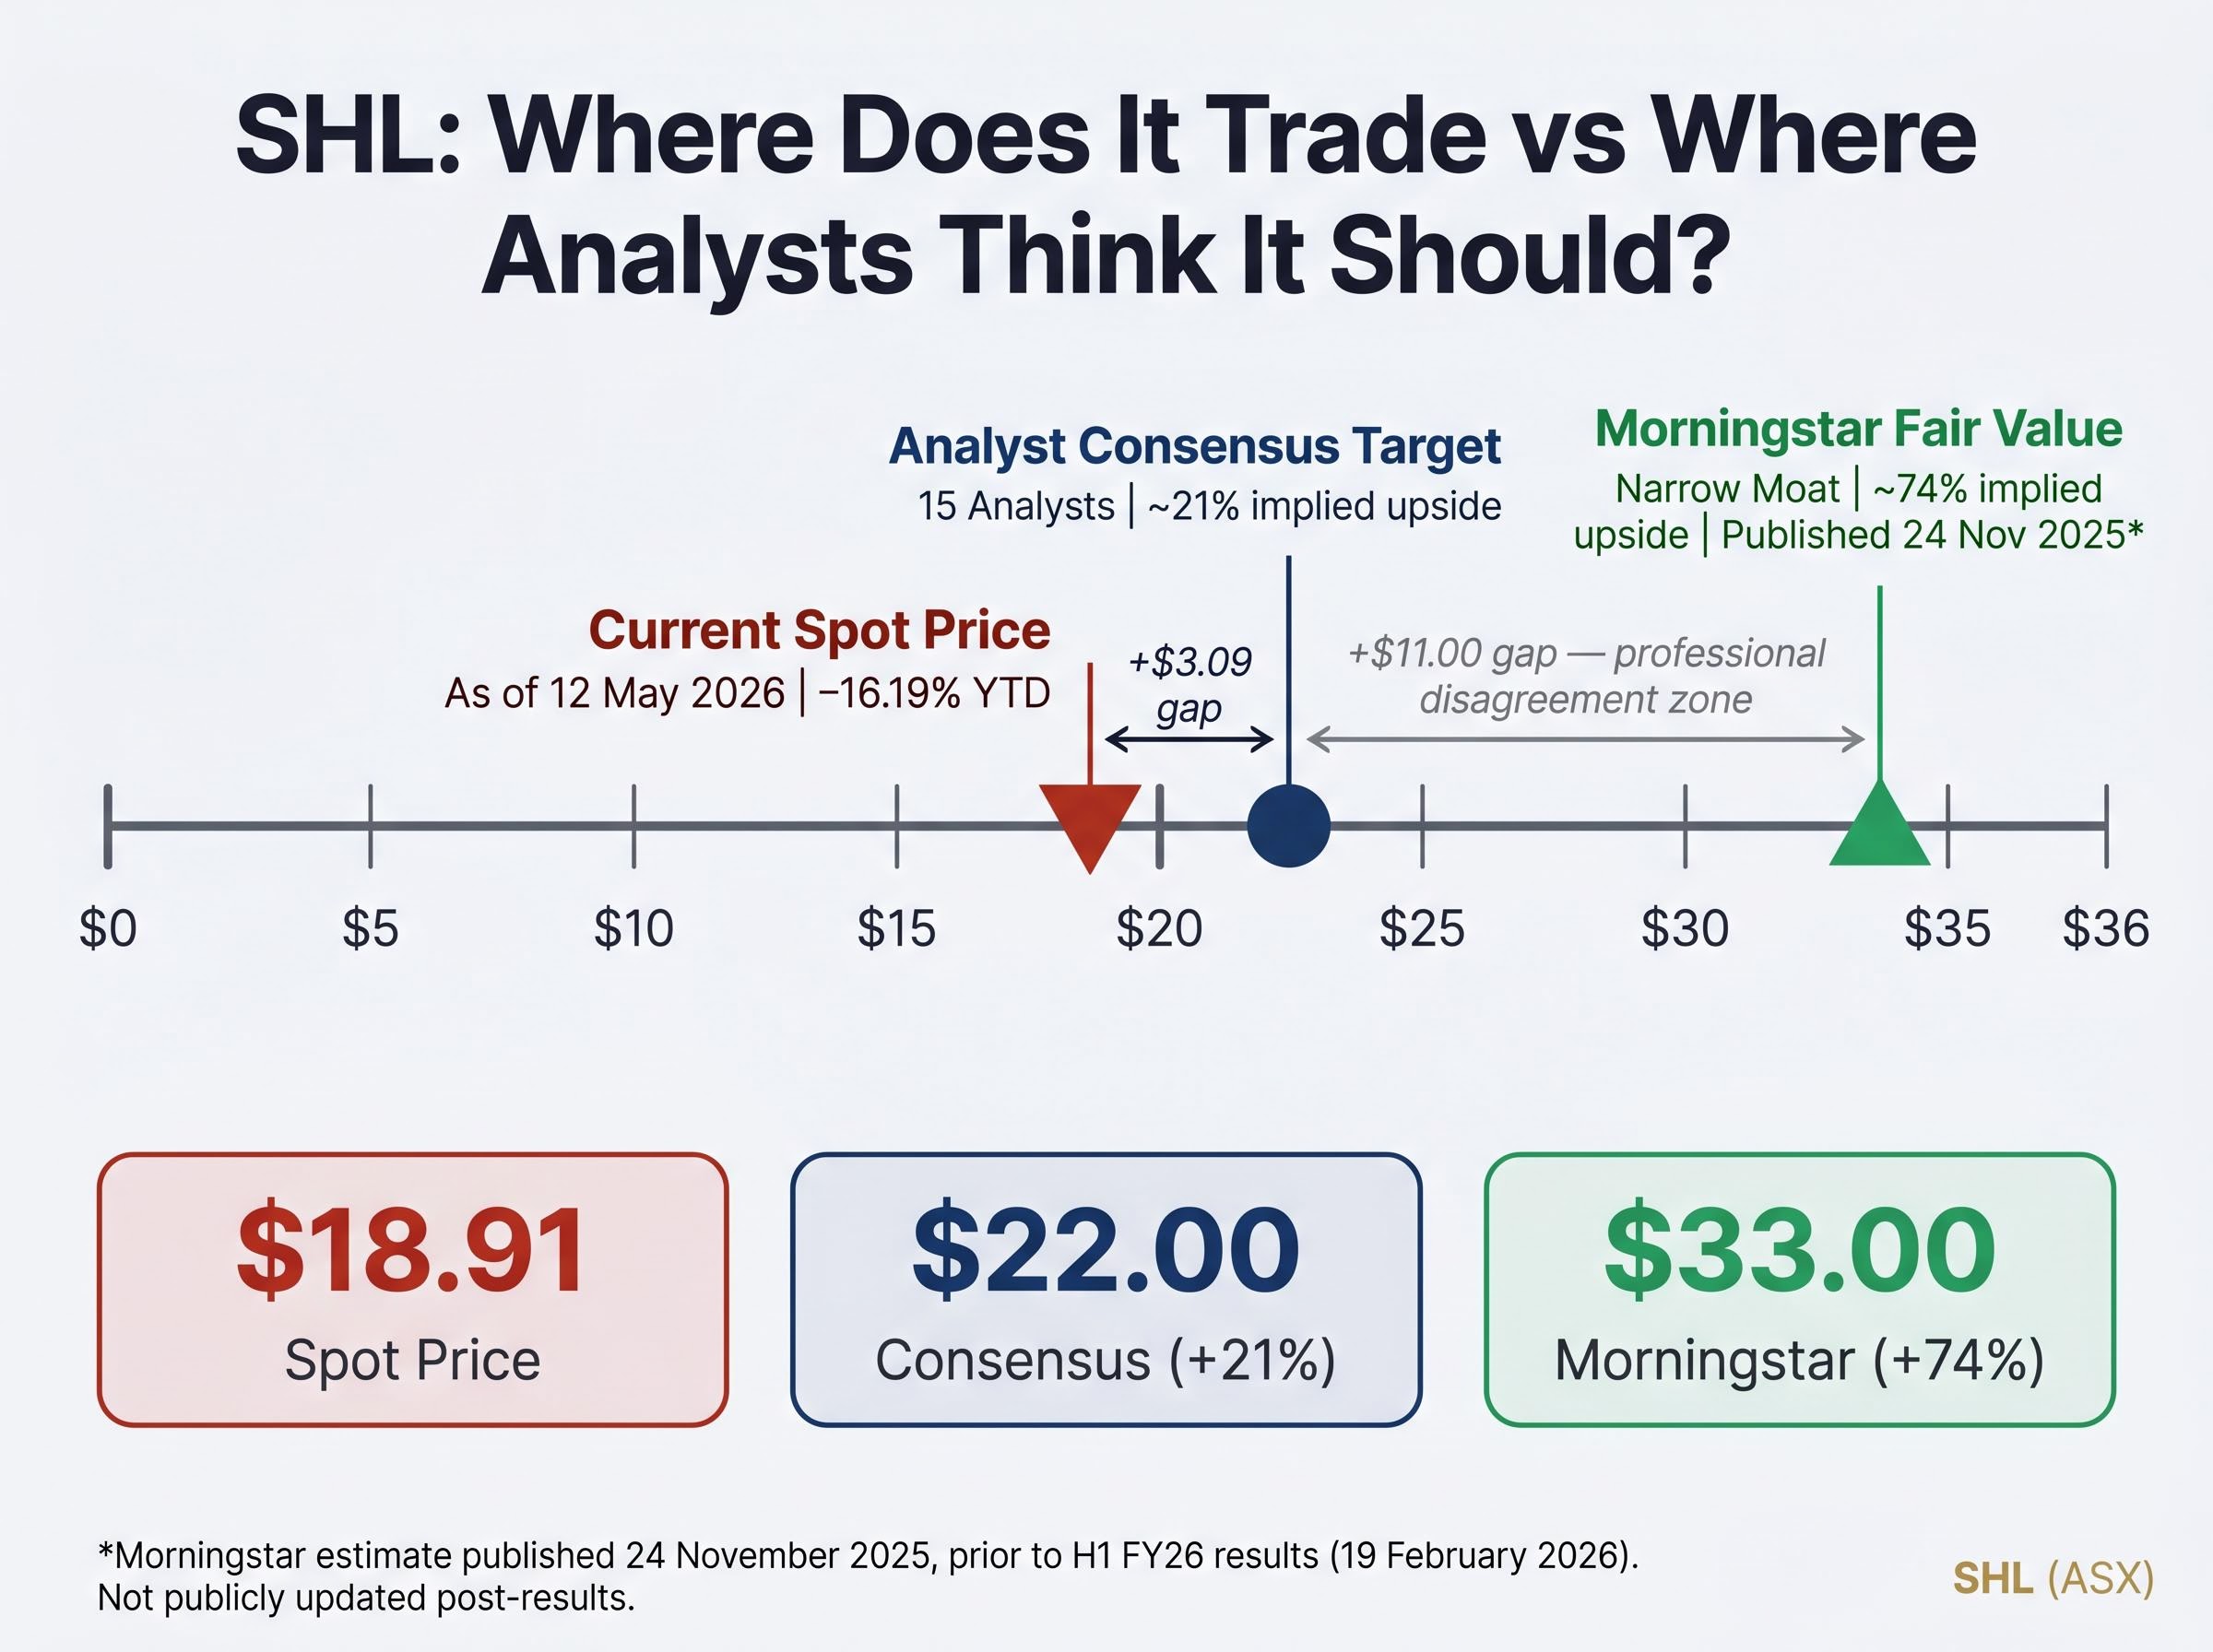
Morningstar fair value: $33.00 (narrow-moat rating) Published 24 November 2025, predating H1 FY26 results released 19 February 2026. This estimate has not been publicly updated post-results.
The gap between $22 and $33 is not a rounding difference. It signals meaningful disagreement among informed professionals about SHL’s medium-term earnings trajectory, margin recovery potential, and the weight to assign unresolved risks. Understanding which camp is closer to correct requires examining the earnings history that brought the stock here.
The scale of the decline deserves to land before any interpretation is offered.
| Period | Revenue | Net Profit | EBITDA |
|---|---|---|---|
| FY22 | Peak-era (COVID) | $1.315 billion | N/A |
| FY24 | Post-COVID base | $511 million | N/A |
| FY25 | $9.65 billion (+7.6% YoY) | $514 million | $1.725 billion (+8%) |
| H1 FY26 | $5.445 billion | $262 million | $907 million |
From $1.315 billion in FY22 to $514 million in FY25: a three-year net profit CAGR of negative 27%. Revenue, by contrast, grew at a CAGR of just 0.8% over the same period. Profit fell while the top line held roughly steady, a pattern that reflects margin compression rather than revenue destruction.
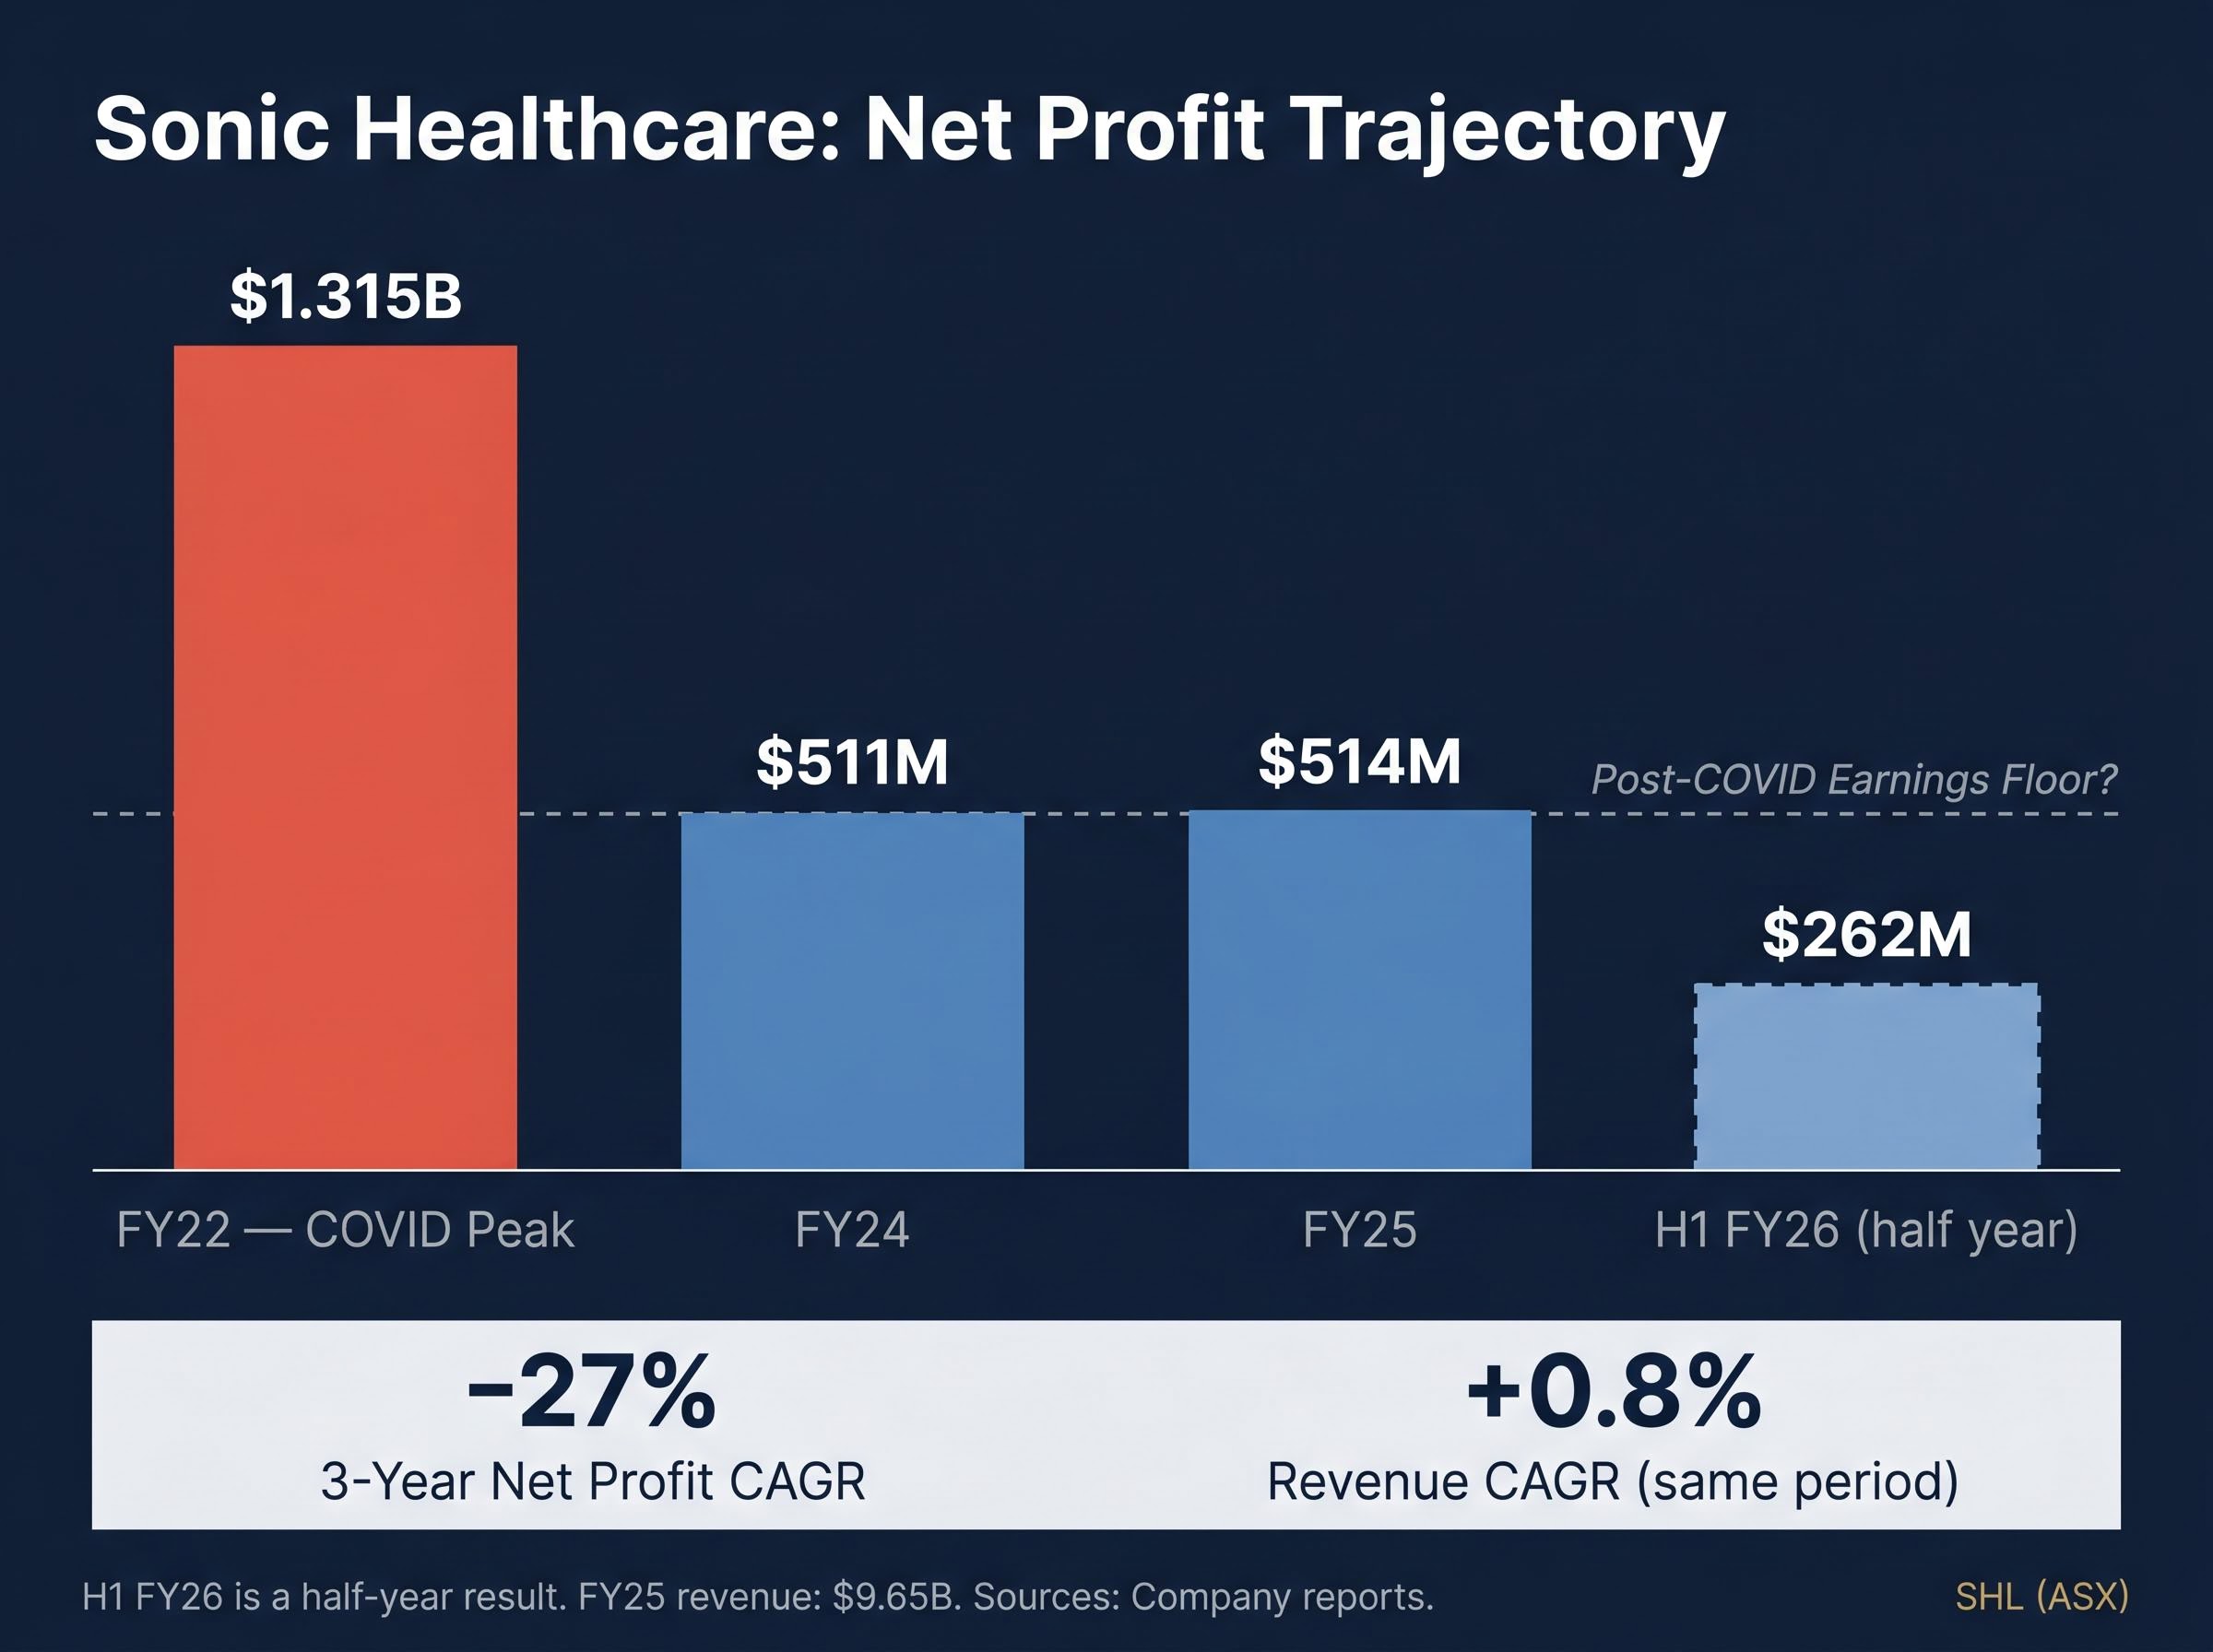
The most significant signal in the table, however, is the FY24-to-FY25 comparison. Net profit moved from $511 million to $514 million, effectively flat. For investors evaluating SHL today, that stabilisation is arguably the most material recent data point: it suggests the post-COVID reset may have run its course.
Morningstar’s November 2025 analysis characterises the profit decline as primarily cyclical, not structural. The supporting evidence: organic volume growth has continued at 3-4% per annum throughout the downturn. In H1 FY26, organic revenue growth reached 5%.
These two facts, a 27% profit CAGR decline and steady volume growth, can coexist. The volume growth is driven by government funding support, demographic tailwinds from an ageing population, and a mix shift toward more complex testing. The profit decline was driven by the disappearance of high-margin COVID testing revenue that inflated the FY22 peak.
The distinction matters. If the decline is cyclical and the base is now set at approximately $510-514 million in annual net profit, SHL is growing off a durable floor. If it is structural, the floor has not yet been found.
SHL is frequently discussed as an Australian pathology company. The reality is more complex and more consequential for investment analysis.
Listed on the ASX since April 1987, Sonic Healthcare operates across five service categories:
Revenue is distributed across three geographic regions, each with distinct performance characteristics:
The geographic diversification creates earnings exposure that domestic peers cannot replicate. Healius holds approximately 24% of the Australian pathology market, with Australian Clinical Labs in third position. In FY25, Healius delivered approximately 3% revenue growth while Australian Clinical Labs achieved approximately 4% organic growth, both within the same post-COVID normalisation corridor as Sonic’s domestic operations.
The assumed defensiveness of ASX healthcare has been aggressively tested in 2026, with AUD appreciation eroding USD-denominated earnings across the sector and rising interest rates compressing growth multiples on the same names that institutional portfolios traditionally held as inflation hedges.
According to Morningstar’s November 2025 forecast, Australian pathology revenue is projected to grow at a 5% CAGR and imaging at 7% CAGR over the next decade. SHL’s European operations provide geographic diversification, but they also introduce currency risk and operational complexity, factors that partly explain why the market applies a discount relative to a pure-play domestic operator.
The income statement tells one story. The balance sheet tells another.
Sonic Healthcare carries $5.95 billion in total debt and $3.87 billion in net debt, with a debt-to-equity ratio of 68.22%. These are not figures that can be set aside when assessing the investment case.
Net debt: $3.87 billion This sits alongside $514 million in annual net profit (FY25), placing the net debt position at roughly 7.5 times annual earnings.
The leverage shows up directly in shareholder returns. Return on equity (ROE) stood at just 6.8% in FY24, reflecting how much of the equity base is consumed by debt servicing rather than generating compounding returns.
There are counterbalancing signals. The dividend has not been cut: the H1 FY26 interim payment was $0.43 per share, 60% franked, implying an annualised run-rate of approximately $1.08 per share. Management guidance for FY26 includes modestly lower depreciation and interest expense, which, if delivered, would represent early evidence of deleveraging momentum.
Three metrics frame the shareholder return picture:
The dividend stability is a positive signal for income-oriented investors. The combination of elevated leverage and sub-7% ROE, however, means capital is not compounding efficiently at current profitability levels. Margin recovery is the lever that changes both numbers.
The headline number is striking. SHL trades at a price-to-sales ratio of approximately 1.04x, compared with a five-year average of 1.94x, a 46% compression. The divergence arose mechanically: the share price fell while revenue expanded modestly (three-year revenue CAGR of 0.8%).
| Metric | Current | Five-Year Average / Benchmark | What It Signals |
|---|---|---|---|
| Price-to-Sales | 1.04x | 1.94x | 46% discount to historical average |
| Trailing P/E | 17.87x | N/A | Moderate; reflects depressed earnings base |
| Forward P/E | 14.49x | N/A | Consensus expects earnings recovery |
| EV/EBITDA | ~10x | Peer range varies | Premium to some diagnostics peers |
| Earnings Yield | 5.84% | N/A | Modest compensation for equity risk |
The trailing P/E of 17.87x, the forward P/E of 14.49x, and the EV/EBITDA of approximately 10x tell a more nuanced story than the P/S ratio alone. Notably, that 10x EV/EBITDA represents a premium to some diagnostics peers on that specific metric, suggesting the market has not uniformly concluded that SHL is cheap.
Price-to-sales ratios are most useful when a company’s profit margins are stable. They become misleading when profit has shrunk relative to the revenue base.
SHL’s own trajectory illustrates this clearly. Revenue has been roughly flat over three years (CAGR 0.8%), but net profit fell from $1.315 billion to $514 million over the same period. A company generating $9.65 billion in revenue but only $514 million in net profit is a fundamentally different earnings proposition than one generating similar revenue at pandemic-era margins. The P/S ratio treats both scenarios identically. That is its limitation.
For a capital-intensive business like SHL, with significant debt and ongoing acquisition activity, more analytically rigorous frameworks such as discounted cash flow (DCF) models and dividend discount models (DDM) better capture the relationship between future cash generation and current enterprise value. These approaches were not performed for this analysis, but they represent the tools most appropriate for resolving the valuation question with confidence.
The investment case at current prices reduces to a specific set of variables.
The bull case:
The bear case:
Key risk: US restructuring remains the single largest information gap. Until scope, cost, and timeline are disclosed, the earnings recovery trajectory cannot be modelled with confidence.
SHL is not a simple value call. At current prices, it rewards investors with patience, a long-duration investment horizon, and comfort with balance sheet leverage. Those who need clear near-term catalysts or low-leverage profiles are likely to find better-suited opportunities elsewhere on the ASX.
The value or value trap question is not unique to SHL; CSL is simultaneously navigating decade-low prices, three consecutive guidance downgrades, and analyst targets ranging from A$109 to A$141, a spread that reflects similarly unresolved uncertainty about whether a structural de-rating or a cyclical trough is the correct diagnosis.
The analytical tension runs through every layer of this stock. The sector’s structural tailwinds, government funding, demographic growth, and a shift toward complex testing, are real and durable. Morningstar forecasts Australian pathology at a 5% CAGR and imaging at 7% CAGR over the next decade. SHL’s 32.8% gross margin sits within a competitive range for the industry.
The Budget 2024-25 pathology funding reforms reintroduced annual MBS indexation for a range of pathology services from July 2025 and established permanent Medicare arrangements for respiratory testing, providing a more predictable government funding floor for operators including Sonic Healthcare’s Australian division.
Those tailwinds do not automatically translate into earnings-per-share growth when leverage is elevated and restructuring costs remain live. The gap between the $22 analyst consensus target and Morningstar’s $33 fair value estimate is itself a signal: the stock’s risk profile is contested among professionals, not just retail investors.
The catalysts that would close SHL’s valuation gap are identifiable. Investors monitoring this stock should watch for:
This article is for informational purposes only and should not be considered financial advice. Investors should conduct their own research and consult with financial professionals before making investment decisions. Past performance does not guarantee future results. Financial projections are subject to market conditions and various risk factors.
As of 12 May 2026, Sonic Healthcare (ASX: SHL) trades at approximately $18.91, representing a year-to-date decline of 16.19% since 1 January 2026.
Sonic Healthcare's net profit fell from $1.315 billion in FY22 to $514 million in FY25, a three-year CAGR of negative 27%, primarily because high-margin COVID testing revenue that inflated the FY22 peak disappeared, while underlying organic volume growth remained steady at 3-4% per annum.
Morningstar's November 2025 estimate places Sonic Healthcare's fair value at $33.00, implying roughly 74% upside from current prices, while the 15-analyst consensus 12-month price target sits at $22.00, implying roughly 21% upside, a gap that reflects genuine professional disagreement about the company's medium-term earnings recovery.
Sonic Healthcare carries $5.95 billion in total debt and $3.87 billion in net debt, equivalent to roughly 7.5 times its FY25 annual net profit of $514 million, which constrains capital flexibility and contributed to a return on equity of just 6.8% in FY24.
Key catalysts include disclosure of the scope, cost, and timeline of the US operations restructuring, confirmation of EBITDA guidance in the FY26 full-year results, evidence of debt reduction in the next reporting period, and whether organic revenue growth translates into improved net profit margins.