
How Many Westpac Shares You Need for $10,000 in Income
3 hrs ago

When a company leads its quarterly earnings release with a record subscriber number and buries a margin contraction three pages later, that ordering is not accidental. It is editorial strategy. Every earnings release serves two functions simultaneously: it is a regulated financial disclosure, and it is a carefully constructed narrative. Investor relations teams shape raw numbers into stories designed to maximise favourable impressions within legal limits. Most retail investors read the headline and move on, unaware of the choices that produced it. This guide walks through the specific techniques companies use to frame earnings narratives, including placement tactics, selective metric choice, and the gap between adjusted and GAAP results, and delivers a practical framework for analysing earnings reports that can be applied to the next release on the calendar.
The starting assumption most investors bring to an earnings release is that it is a neutral summary of quarterly results. It is not. An earnings press release is a document with a point of view, shaped by the investor relations team to present results in the most favourable light the law permits. Understanding that distinction is the prerequisite for reading any earnings report critically.
The difference between an earnings press release and a formal SEC filing is substantial. Formal filings, the 10-Q (quarterly) and 10-K (annual), are audited, standardised, and subject to SEC review. The press release that most investors actually read operates under far looser rules.
The regulatory scaffolding underpinning these documents is also in flux: the SEC reporting requirements that make the 10-Q a mandatory quarterly artefact are under formal review, with a 2026 proposal that would allow eligible companies to file on a semiannual basis instead, reducing the frequency of the structured disclosures investors currently rely on.
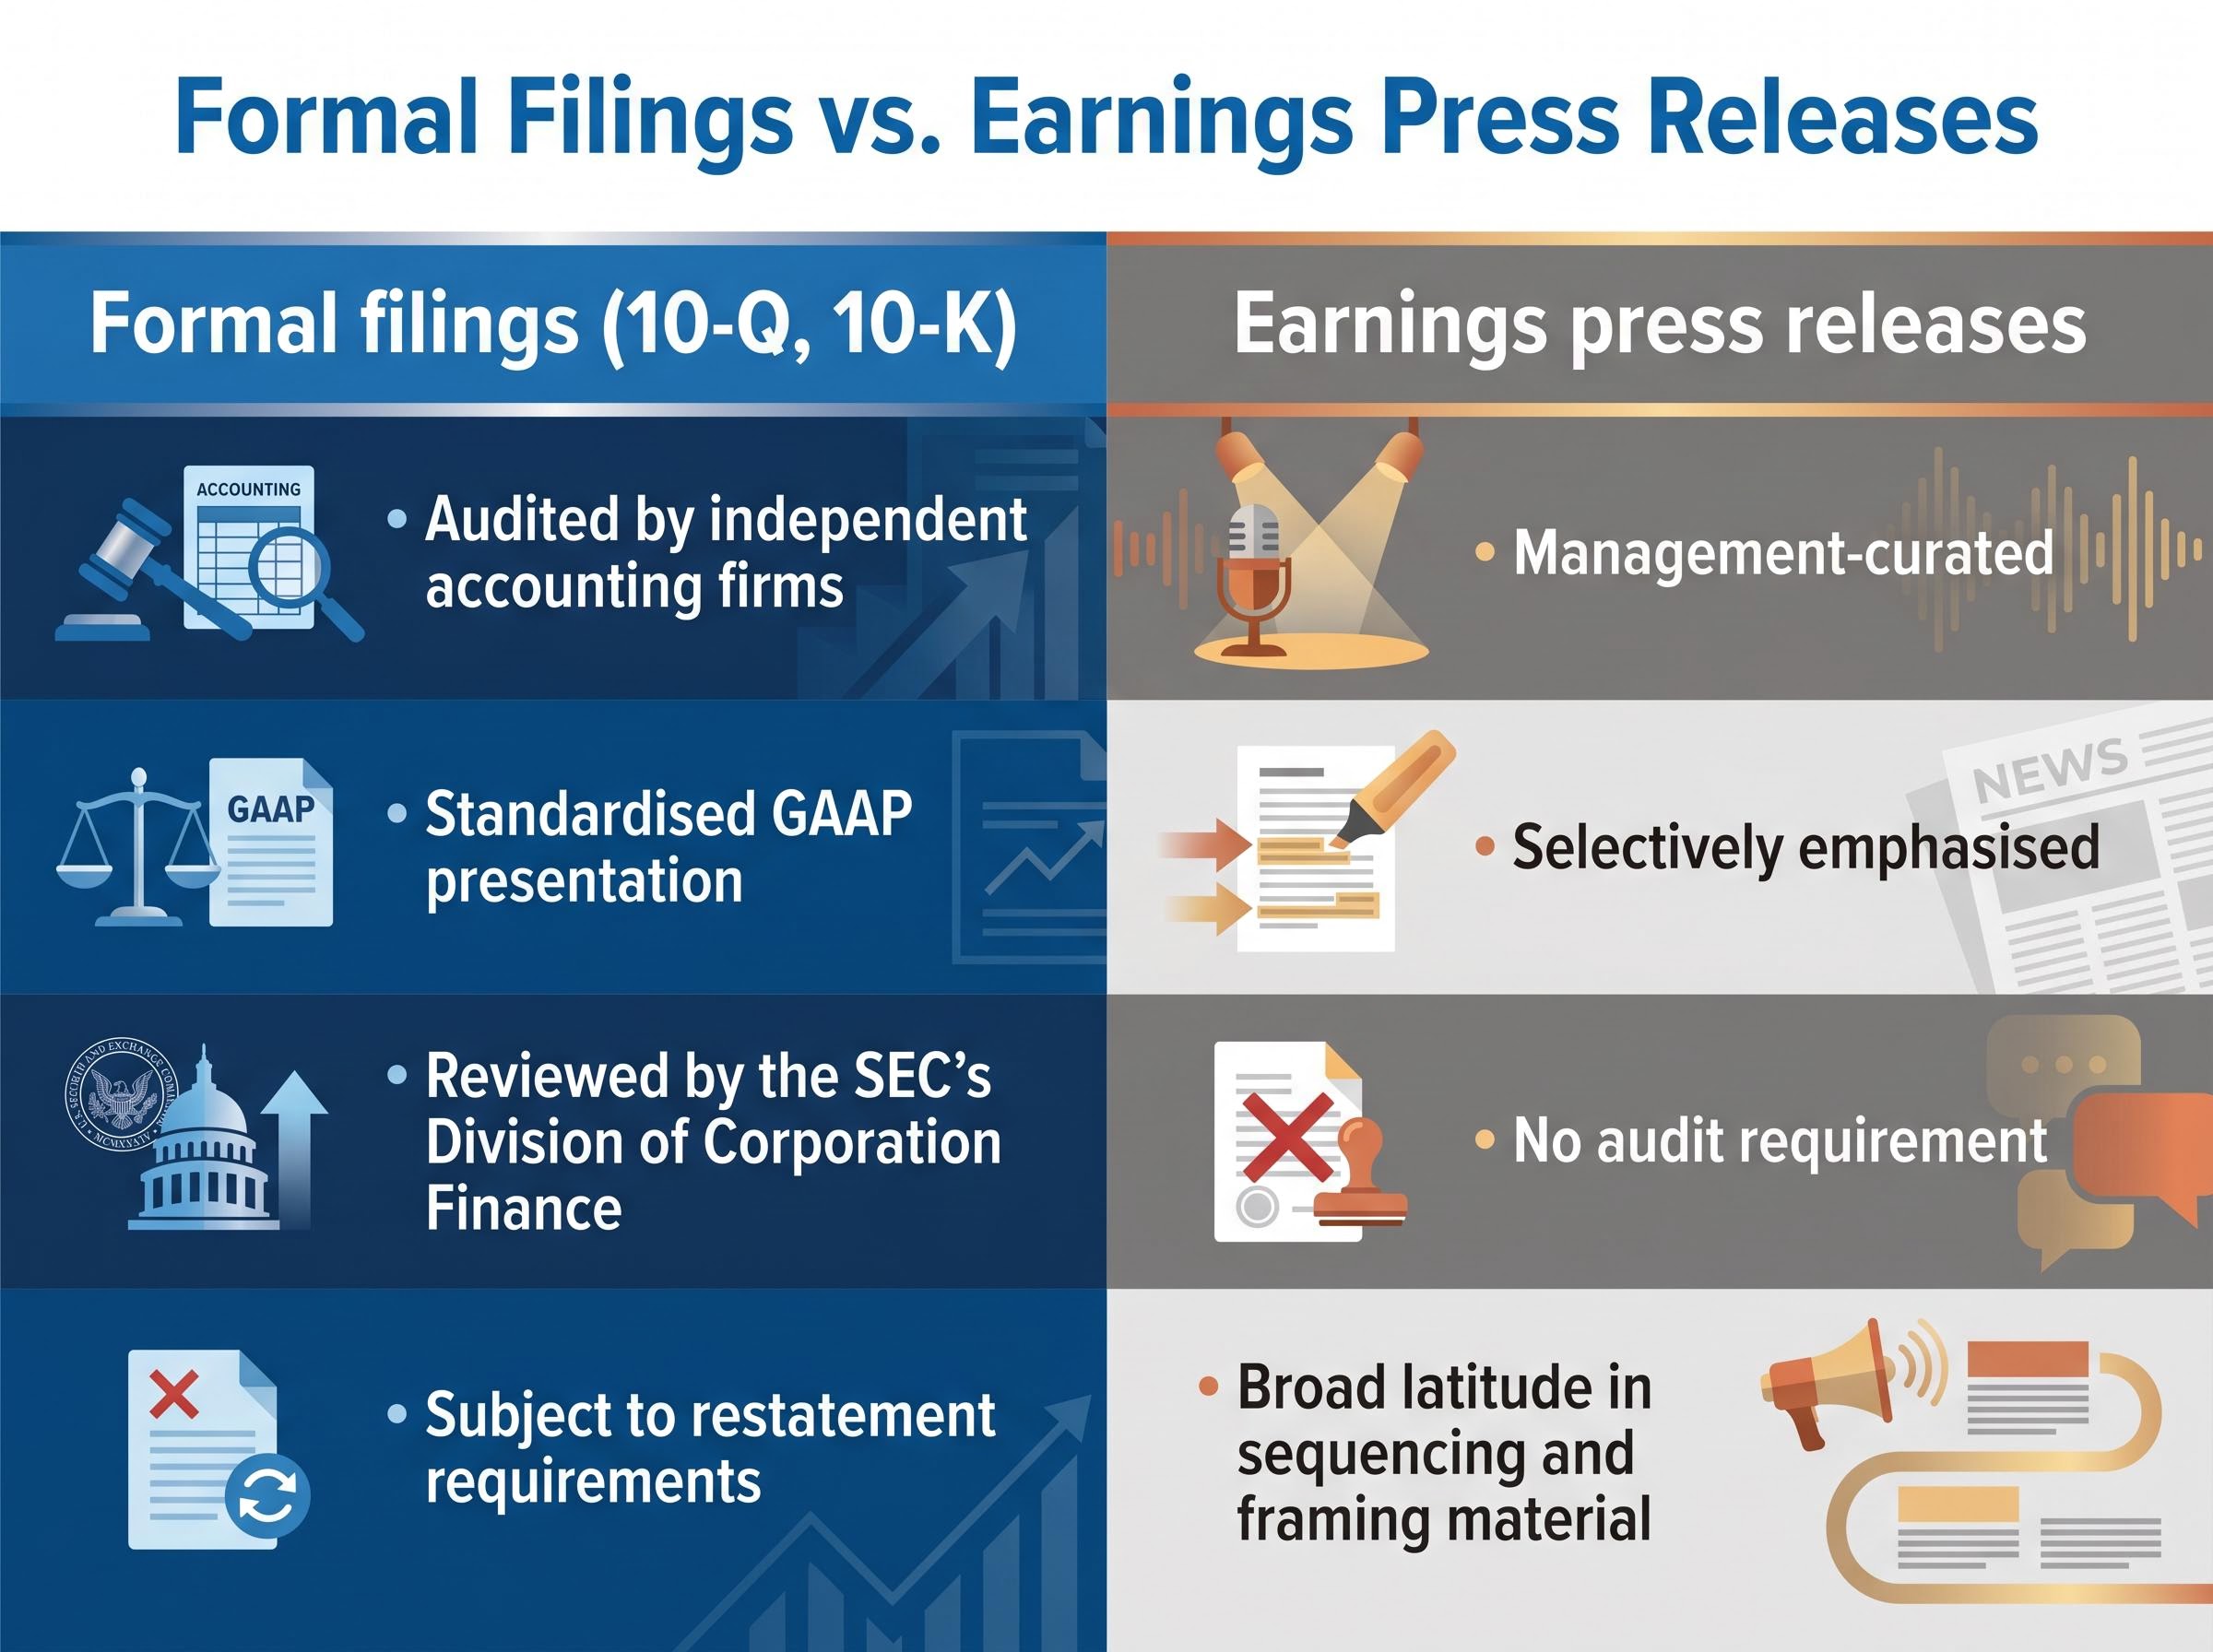
The press release is the company’s curated front door to its quarterly story. Favourable results receive top billing. Weaker developments are contextualised, qualified, or placed where fewer readers will reach them. This is legal, common, and largely expected by institutional participants. Retail investors who treat the press release as an objective summary are reading the document on the company’s terms.
Ratio analysis tells investors what happened. Language analysis tells them what management thinks is coming. Treating the earnings call transcript as data, not background noise, adds a qualitative layer that headline figures never provide.
The scripted prepared remarks that open an earnings call are vetted by legal counsel, investor relations, and often the board itself. They are polished, on-message, and designed to control the narrative. The more revealing section begins when analysts ask questions.
Specific language patterns distinguish confident management from management managing expectations:
Research published in Accounting Forum by Ning, Jing, Luqiao Zhang, Biao Mi, Jessica Hong Yang, and Lei Tao (May 2024) supports the relationship between managerial tone and analyst behaviour. The study found that analysts adjust their models and recommendations based on tone signals, treating language patterns as informative inputs alongside the financial data itself.
Three patterns in the Q&A section warrant attention. First, questions that receive unusually brief responses, or that prompt management to redirect back to prepared remarks, may signal topics the company prefers not to elaborate on. Second, when the same issue draws probing questions across two or three consecutive quarterly calls, the analyst community has identified a concern regardless of whether management directly acknowledges it. Third, any question that management declines to answer quantitatively, when a numerical answer would be natural, should be flagged. Earnings call transcripts are freely available and searchable, and investors who read them with these patterns in mind extract signal the headline EPS number never provides.
The opening paragraph and bullet-point summary of an earnings release are the most strategically valuable real estate in the document. They anchor the reader’s first impression before any financial table appears. Investor relations teams understand this, and they use it.
The front-loading pattern works through two mechanisms. The first is metric selection: choosing to lead with the annual figure when it flatters more than the quarterly one, or highlighting a non-GAAP number before a GAAP equivalent, are deliberate structural choices. The New York Times year-end release offers a useful illustration. The company led with digital subscriber growth and website advertising revenue increases, front-loading the strongest metrics before weaker developments appeared later in the document. The second mechanism is sequencing: placing softer results in the back third of the release, surrounded by positive context, reduces the probability that a casual reader encounters them with fresh attention.
The omission signal may be more informative than either. When a metric that featured prominently in the prior quarter’s release disappears without explanation, that absence is not an oversight.
When a metric that appeared in the prior quarter’s release vanishes from the current one, treat the silence as a data point.
A practical three-step structural scan converts this knowledge into a reading habit:
Adjusted earnings, or non-GAAP figures, are among the most widely cited numbers in any earnings release. Understanding what they are, why they exist, and where they can mislead is a core skill for any investor reading quarterly results.
GAAP (Generally Accepted Accounting Principles) figures are audited, standardised, and must meet SEC requirements. Non-GAAP figures are management-defined, unaudited, and can vary by company and by quarter. Both appear in the same earnings release, but they can tell very different stories.
The items most commonly excluded from non-GAAP results include stock-based compensation, restructuring charges, amortisation of acquired intangibles, and litigation costs. Each exclusion has a legitimate rationale: these items may not reflect ongoing operational performance. That same rationale, however, is also the mechanism that enables the gap between adjusted and reported earnings to widen without clear justification.
Beat source analysis, the discipline of identifying whether an EPS beat originated from revenue growth, gross margin expansion, or cost reduction, matters here because cost-driven beats often carry no forward earnings power and can be accompanied by quietly weakened guidance in the same document.
| Excluded Item | Company’s Stated Rationale | Why It May Recur | What to Check |
|---|---|---|---|
| Stock-based compensation | Non-cash expense; does not reflect operating performance | Issued every quarter as part of employee compensation | Compare excluded amount across 4-8 quarters for consistency |
| Restructuring charges | One-time cost associated with organisational changes | Multi-year restructuring programmes span many quarters | Check whether restructuring appeared in prior-year reconciliations |
| Acquired intangible amortisation | Non-cash write-down of acquisition-related assets | Serial acquirers carry this expense continuously | Review acquisition history; if acquisitions are ongoing, amortisation is ongoing |
| Litigation costs | Unusual expense unrelated to core operations | Companies in regulated or IP-heavy industries face recurring legal exposure | Pull litigation disclosures from prior 10-Qs for recurrence pattern |
The New York Times case study illustrates the recurrence problem directly. The company reported generative AI-related litigation expenses as separately identified items in both its fiscal year 2024 and fiscal year 2025 annual releases, demonstrating how an item presented as notable or distinct can appear across consecutive periods.
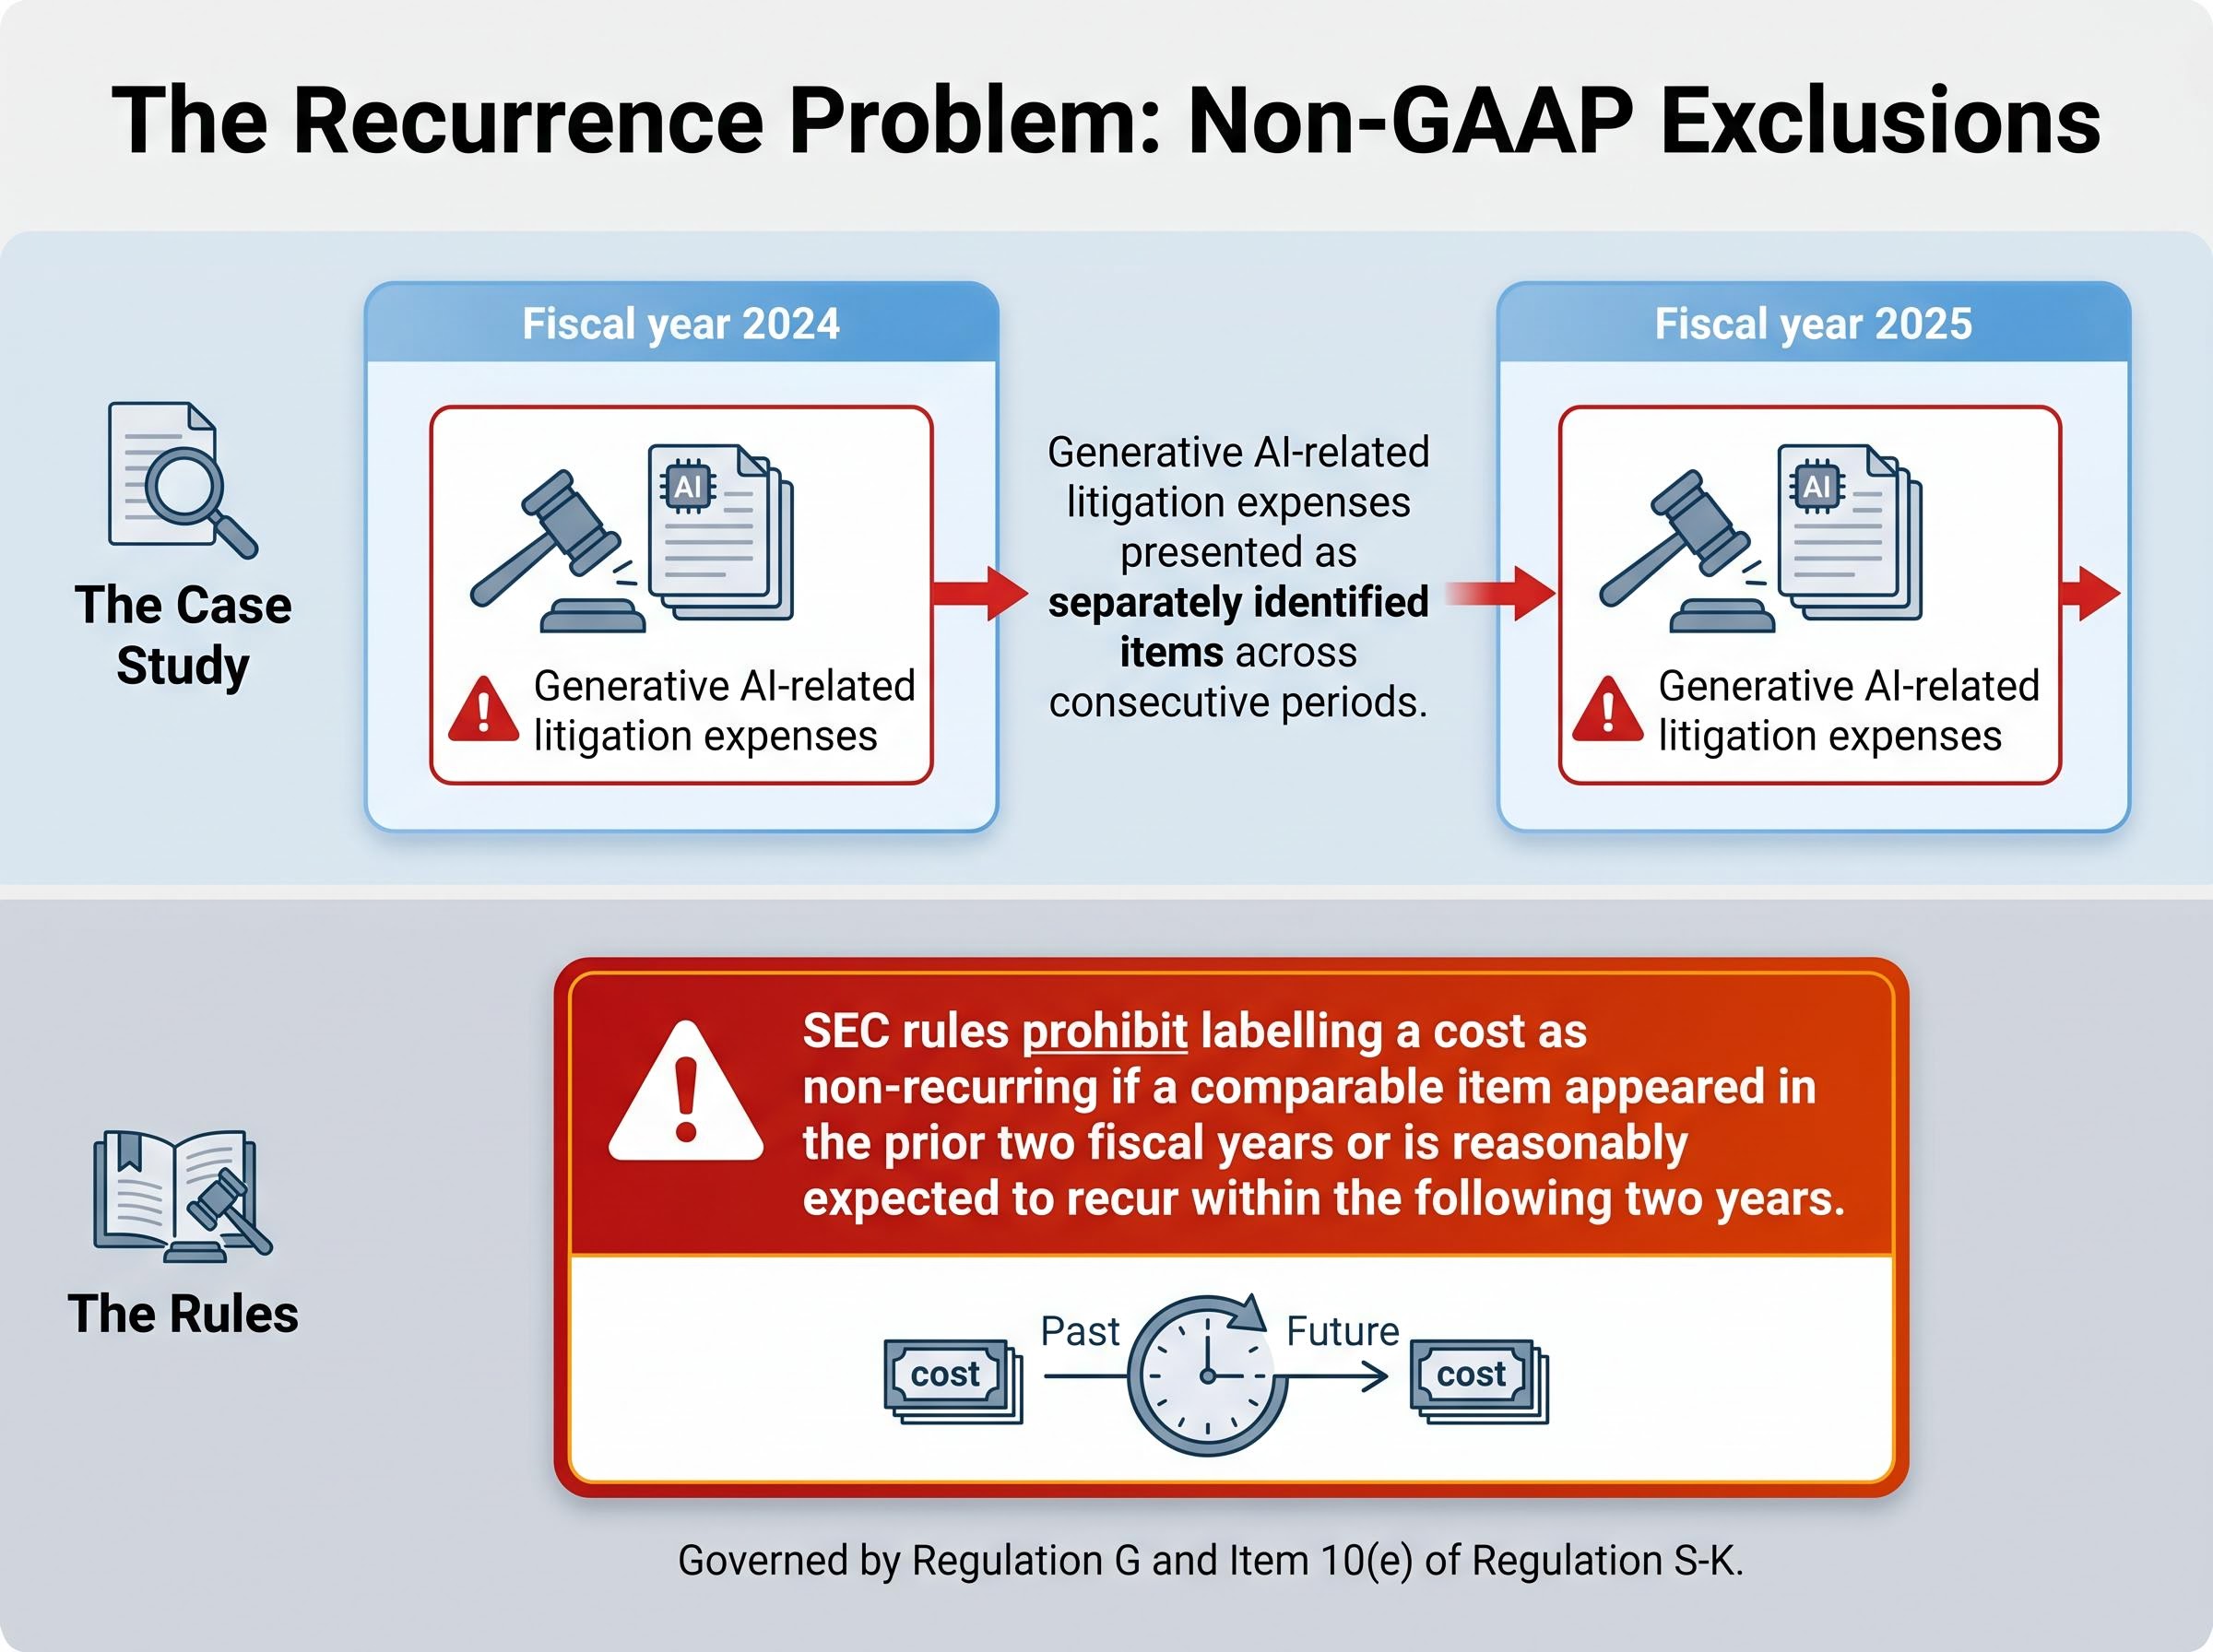
SEC rules specifically prohibit labelling a cost as non-recurring if a comparable item appeared in the prior two fiscal years or is reasonably expected to recur within the following two years. Yet the pattern of recurring “one-time” items remains common across S&P 500 reporting.
Under Regulation G, companies using non-GAAP metrics must provide a reconciliation to the most directly comparable GAAP measure, and the GAAP measure must be presented with at least equal prominence. Item 10(e) of Regulation S-K governs these disclosures in SEC filings. The reconciliation table the company is legally required to publish is one of the most useful analytical tools available to investors. Most retail investors never read it.
Regulation G and Item 10(e) of Regulation S-K set the binding requirements for how companies must present non-GAAP financial measures, mandating both a reconciliation to the nearest comparable GAAP figure and equal or greater prominence for that GAAP figure wherever the adjusted metric appears.
Past performance does not guarantee future results. Financial projections are subject to market conditions and various risk factors.
The placement, non-GAAP, and tone signals covered in earlier sections convert into a sequential reading protocol that requires no paid tools and no financial modelling background. A retail investor with access to SEC EDGAR (sec.gov/edgar) and 30 minutes can apply every step to any S&P 500 earnings release.
The six-step sequential reading protocol:
Key warning signals and where to find them in the filing:
| Red Flag | What It May Signal | Where to Find It |
|---|---|---|
| Accounts receivable growing faster than revenue | Aggressive revenue recognition or channel stuffing | Balance sheet and revenue line in the 10-Q |
| Inventory buildup disproportionate to sales growth | Demand weakness or overproduction | Balance sheet current assets section |
| Cash flow diverging from net income | Accrual-based earnings inflation | Cash flow statement vs. income statement |
| Widening gap between GAAP and non-GAAP EPS | Growing reliance on adjustments to meet targets | GAAP reconciliation table in the earnings release |
| Sudden changes in accounting policies | Potential earnings management or restatement risk | Notes to financial statements in the 10-Q/10-K |
Free tools for every step: SEC EDGAR (sec.gov/edgar) provides all filings, reconciliation tables, and prior-period comparisons. Company investor relations pages host supplemental materials. Yahoo Finance and Google Finance offer historical financials and analyst estimate tracking at no cost.
Sector-specific metrics, such as net revenue retention for SaaS companies, book-to-bill ratios for industrials, and loan loss provisions for banks, add a layer of analysis the six-step protocol above does not cover in depth; these figures often telegraph directional shifts in business quality well before they appear in aggregate earnings lines.
Companies constructing favourable narratives around their quarterly results is legal, expected, and not inherently deceptive. It is the nature of investor communications. That reality, however, places the burden of reading critically on the investor rather than on the document itself.
This guide has built three analytical layers for meeting that burden:
The next earnings season is the immediate application opportunity. The tools required, SEC EDGAR for filings and reconciliation tables, freely available earnings call transcripts, and the three-step structural scan, are all publicly accessible and cost nothing. Investors who apply even two or three of these checks consistently develop an edge over readers who stop at the headline number, not because they possess proprietary data, but because they are reading the entire document the company chose to publish.
For investors who want a compressed version of this workflow, our dedicated guide to reading earnings reports in 20 minutes applies the same reconciliation table, cash flow cross-check, and Q&A transcript steps within a strict time budget, with specific instructions for using SEC EDGAR and Yahoo Finance at each stage.
This article is for informational purposes only and should not be considered financial advice. Investors should conduct their own research and consult with financial professionals before making investment decisions.
Earnings report analysis is the process of critically examining a company's quarterly financial disclosures, including press releases, SEC filings, and earnings call transcripts, to assess true business performance beyond headline figures. It matters because earnings press releases are editorially constructed documents designed to present results favourably, and investors who read only the headline risk missing material weaknesses buried later in the document.
GAAP figures are audited, standardised, and must meet SEC requirements, while non-GAAP figures are management-defined, unaudited, and exclude items such as stock-based compensation, restructuring charges, and litigation costs. The gap between the two can widen significantly over time, and investors should use the reconciliation table every company is legally required to publish to understand what adjustments have been made.
Key red flags include accounts receivable growing faster than revenue, operating cash flow consistently diverging from reported net income, a widening gap between GAAP and non-GAAP EPS, and sudden changes in accounting policies. All of these signals can be found using free tools such as SEC EDGAR and the reconciliation tables companies are required to include in their earnings releases.
Look for whether management provides specific numerical targets and concrete timeline commitments rather than vague directional language, and pay close attention to the analyst Q&A section where questions receiving unusually brief answers or recurring across multiple calls often signal topics the company prefers not to elaborate on.
Compare the current release side by side with the prior quarter's release and note any metrics that have disappeared without explanation, then read the final third of the document with the same attention you give the opening paragraph, as softer results are commonly placed there surrounded by positive context to reduce their impact on casual readers.