
Why Your ETF Portfolio May Be Less Diversified Than You Think
20 mins ago

Flight Centre trades at A$10.56 as of 11 May 2026, roughly 36% below the average analyst target of A$15.89. One prominent Australian investment platform points to the stock’s price-to-sales ratio of 0.78x, barely a quarter of its 3.42x historical reference, as a meaningful indicator of undervaluation. The gap is real. Whether it means what retail investors think it means is a different question entirely.
Fair value estimates for Flight Centre (ASX: FLT) range from A$16.93 to A$25.41 depending on methodology. The stock sits below both its 50-day and 200-day moving averages. Four distinct stock valuation methods, applied to the same company on the same day, produce four different answers. This guide uses FLT as a live case study to explain why, walking through the P/S ratio, P/E and PEG ratios, discounted cash flow analysis, and the dividend discount model. The goal is not to land on a single number. It is to build a repeatable framework Australian retail investors can apply to any recovery-stage cyclical on the ASX.
The P/S ratio makes a compelling headline. At 0.78x, FLT’s current multiple is less than half the 10-year median of 1.65x tracked by GuruFocus and a fraction of the 3.42x historical reference cited in Rask Media’s April 2026 coverage. For an investor scanning for undervalued stocks, the gap looks like opportunity.
The price-to-sales ratio divides a company’s market capitalisation by its annual revenue. It is a legitimate screening tool for pre-profit or early-stage companies where earnings data is unavailable. For a margin-recovery story like FLT, it serves as a starting signal for deeper analysis, not a valuation conclusion.
Three structural limitations explain why P/S fails as a standalone metric for cyclical stocks:
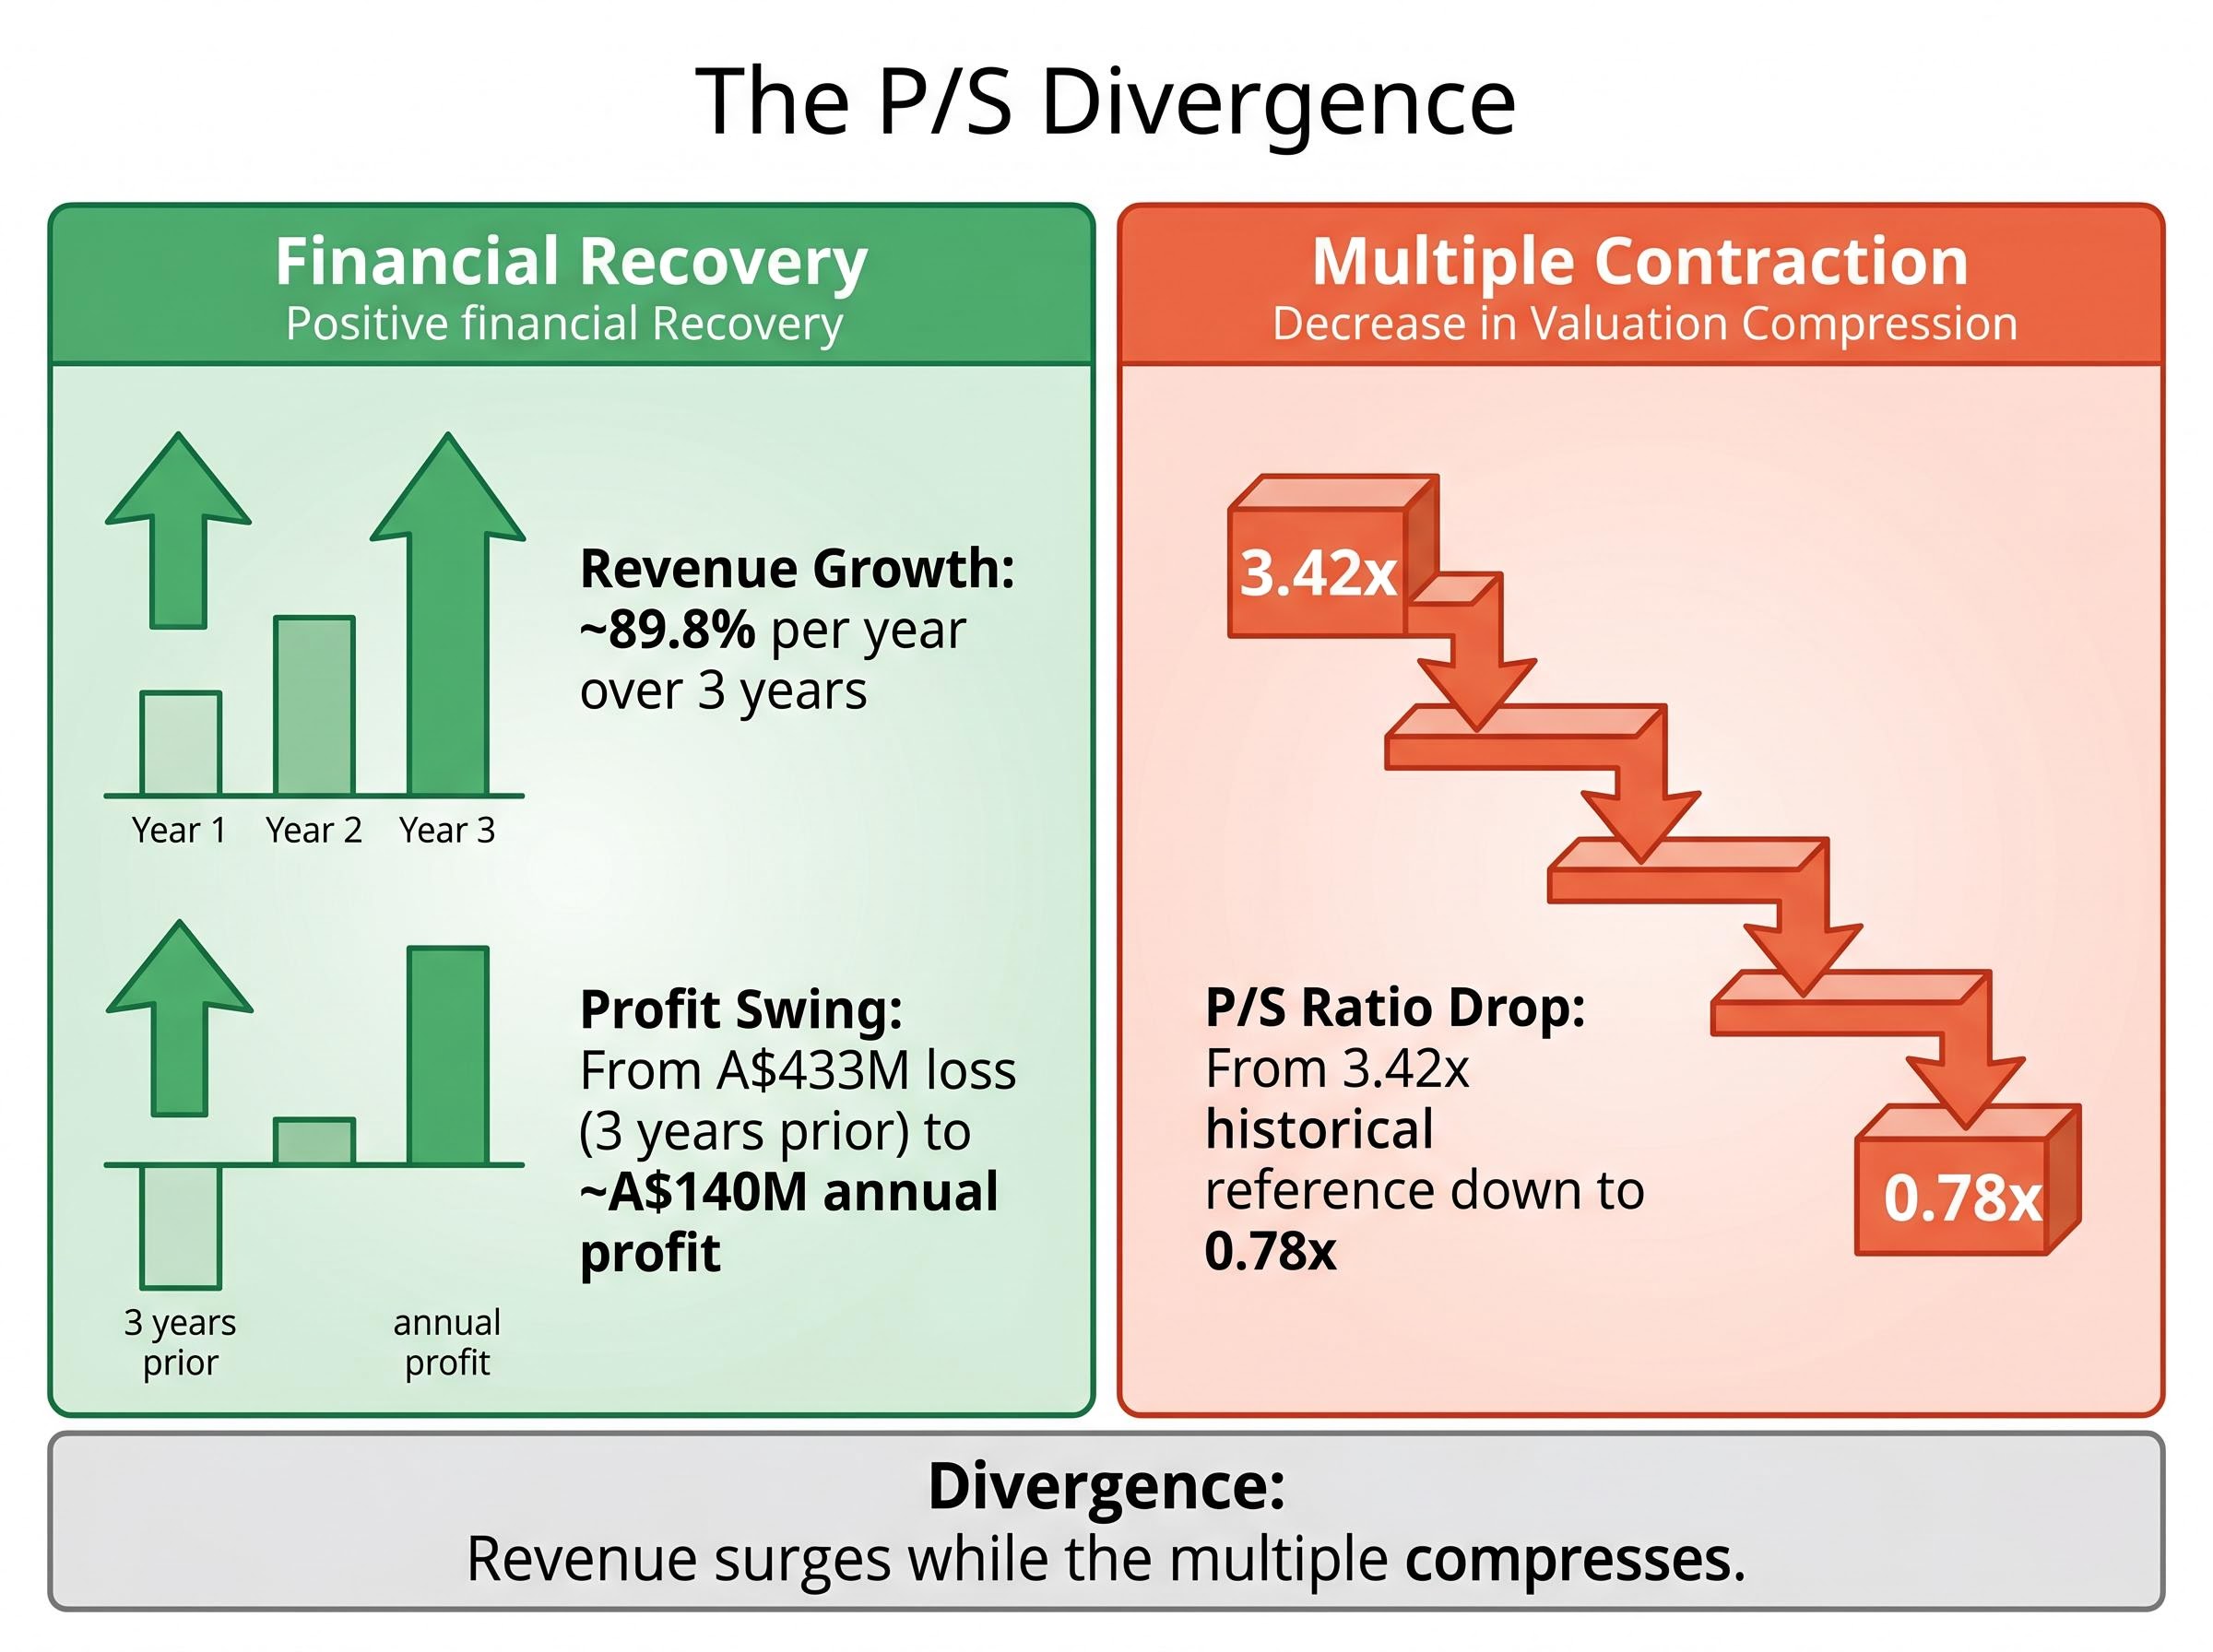
“FLT grew revenue at approximately 89.8% per year over three years, yet its P/S ratio fell sharply, meaning investors need to look elsewhere to understand what the market is actually pricing in.”
FLT recorded a net loss of approximately A$433 million three years prior. It now returns roughly A$140 million in annual profit. Revenue surged; the multiple compressed. That divergence, where revenue growth and multiple contraction happen simultaneously, is the clearest evidence that P/S alone cannot capture what matters in a recovery.
Multiple compression is the dynamic that explains why FLT’s revenue surging at nearly 90% per year coincided with a contracting P/S ratio: when investors revise their expectations for future profitability or discount rates rise, multiples fall even as underlying revenue grows, separating price performance from operational progress.
The metric most investors encounter first is the price-to-earnings ratio, and for FLT it reads 21.87x on a trailing basis according to Yahoo Finance. That is not a low-multiple entry point. It signals that the market is already embedding expectations of continued earnings improvement into the share price.
The distortion at cycle inflection points is the issue. When earnings sit at a trough, the denominator in the P/E calculation is depressed, inflating the ratio. A trailing P/E of 21.87x at this stage of FLT’s recovery tells investors the market expects earnings to grow into the multiple, not that the stock is expensive in perpetuity.
| Metric | Value | What it signals | Key limitation |
|---|---|---|---|
| Trailing P/E | 21.87x | Market pricing in earnings recovery | Inflated by trough-level earnings |
| PEG (5-year expected) | 1.18x | Moderate growth-adjusted valuation | Sensitive to growth rate assumption |
| PEG (alternative) | 0.62x | Potentially attractive on higher growth input | Different growth estimate changes signal entirely |
The PEG ratio divides the P/E by the expected earnings growth rate. It exists to answer a question P/E alone cannot: is the multiple justified by how fast earnings are growing?
FLT illustrates why the growth input is the variable that matters most. Yahoo Finance’s 5-year expected growth rate produces a PEG of 1.18x, suggesting moderate valuation. Stock Analysis, using a different growth assumption, produces 0.62x, implying the stock is attractively priced. Two credible sources, the same company, the same day, and a 90% gap in implied attractiveness. The lesson is not that one source is right. It is that investors must interrogate the growth rate assumption before accepting any PEG output at face value.
FLT’s gross margin of 42.4% versus its net margin of approximately 4.8% reveals the operational leverage available if overheads are controlled. Return on equity of 11.9% in FY24 adds a supporting data point on earnings quality. The P/E and PEG framework captures these dynamics in ways the P/S ratio structurally cannot.
The DCF is the most theoretically rigorous approach available to retail investors. It answers a direct question: what is the present value of all the cash this business will generate in the future?
The mechanics follow three steps:
The method is sound. The problem is the inputs. For a recovery-stage cyclical like FLT, small changes in margin assumptions produce enormous swings in output.
“For a recovery-stage cyclical like FLT, a 1-2 percentage point difference in assumed net margin recovery produces a fair value output that can shift the intrinsic value estimate by A$5-8 per share.”
Simply Wall St’s fair value estimates range from A$16.93 to A$25.41. Analyst consensus sits at approximately A$15.89, with individual targets spanning A$12.60 to A$19.14. That dispersion is not noise. It is analyst disagreement about margin recovery timing made explicit through the DCF framework.
FLT’s proprietary platforms, including the Melon booking system and FCM Travel’s SAM chatbot, represent productivity investments whose return on investment is genuinely unquantified in public disclosures. These tools sit at the centre of the company’s margin expansion thesis, yet no verifiable data exists on their financial contribution.
This creates a legitimate uncertainty layer in any DCF model. Retail investors approaching FLT with a DCF framework should consider running bull, base, and bear scenarios rather than relying on a single-point estimate. The bull case assumes technology investment accelerates margin recovery toward 6-7% net margins. The bear case assumes productivity gains are marginal and the 4.8% net margin persists. The gap between those scenarios is where the real investment decision lives.
The DDM is the simplest valuation concept in theory. A stock is worth the present value of its expected future dividend stream. If a company pays dividends reliably and grows them at a predictable rate, the model produces a clean estimate of intrinsic value. The critical variable is yield sustainability.
The Gordon Growth Model formula, P = D1 divided by (r minus g), makes the sensitivity explicit: a small upward revision to the assumed growth rate (g) compresses the denominator and inflates the implied intrinsic value significantly, which is why assumption quality matters more than the arithmetic itself.
FLT’s current numbers look reasonable on the surface. The annual dividend stands at A$0.41 per share, producing a yield of 3.76% at the A$10.56 share price. For income-seeking investors, that yield compares favourably with many ASX large caps.
The COVID-era suspension is the complication. FLT halted dividends for multiple years during the pandemic, a data point that forces a more conservative estimate of payout reliability for any forward-looking DDM calculation. A debt-to-equity ratio of 84.1% and net debt of approximately A$283 million add further context about the balance sheet capacity to sustain payments through the next downturn.
Before relying on DDM for a cyclical stock, retail investors should ask three questions:
“FLT’s 3.76% yield is real today, but the DDM’s reliability depends on whether dividends continue through the next downturn. The COVID suspension is evidence that they may not.”
The DDM provides a useful floor valuation check for FLT. It cannot, however, anchor a full valuation for a cyclical business with a demonstrated willingness to suspend payments when conditions deteriorate.
Each method examined so far answers a different question and carries different blind spots. The P/S ratio ignores margins. The P/E inflates at cycle troughs. The DCF requires high-conviction assumptions on variables that are genuinely uncertain. The DDM depends on payout continuity that history does not guarantee. A disciplined framework layers these methods sequentially, with cycle positioning and qualitative context preceding the quantitative analysis.
The following six-step process converts conflicting signals into a structured decision:
| Step | Element | FLT application | Key signal |
|---|---|---|---|
| 1 | Cycle positioning | 52-week range A$9.99-A$16.56; near cycle low | Below moving averages; recovery incomplete |
| 2 | Relative multiples | P/S 0.78x; P/E 21.87x | P/S compressed; P/E embeds recovery expectations |
| 3 | DCF scenario analysis | Fair value range A$16.93-A$25.41 | Wide dispersion; margin assumption is the swing variable |
| 4 | Dividend analysis | Yield 3.76%; COVID suspension on record | Yield attractive; sustainability unproven through cycle |
| 5 | Qualitative layer | A$200M buyback (April 2026); 80+ country operations | Management confidence signal; scale and diversification |
| 6 | Macro overlay | RBA rate ~4.35%; beta ~0.626 | Rate environment pressures consumer discretionary demand |
Where signals align, FLT’s A$200 million buyback (repurchasing over 16 million shares, approximately 7% of shares on issue) and analyst consensus implying roughly 50% upside both point toward management and market conviction in recovery. Where they diverge, DCF uncertainty and the margin vulnerability at 4.8% net margin, the framework identifies exactly which assumptions require a view before committing capital.
The macro overlay matters for FLT specifically because consumer discretionary travel demand is sensitive to household disposable income, and the pathway and pace of RBA rate cuts will shape the demand environment through which FLT’s margin recovery is expected to play out.
Four valuation methods applied to the same stock on the same day produce this dashboard:
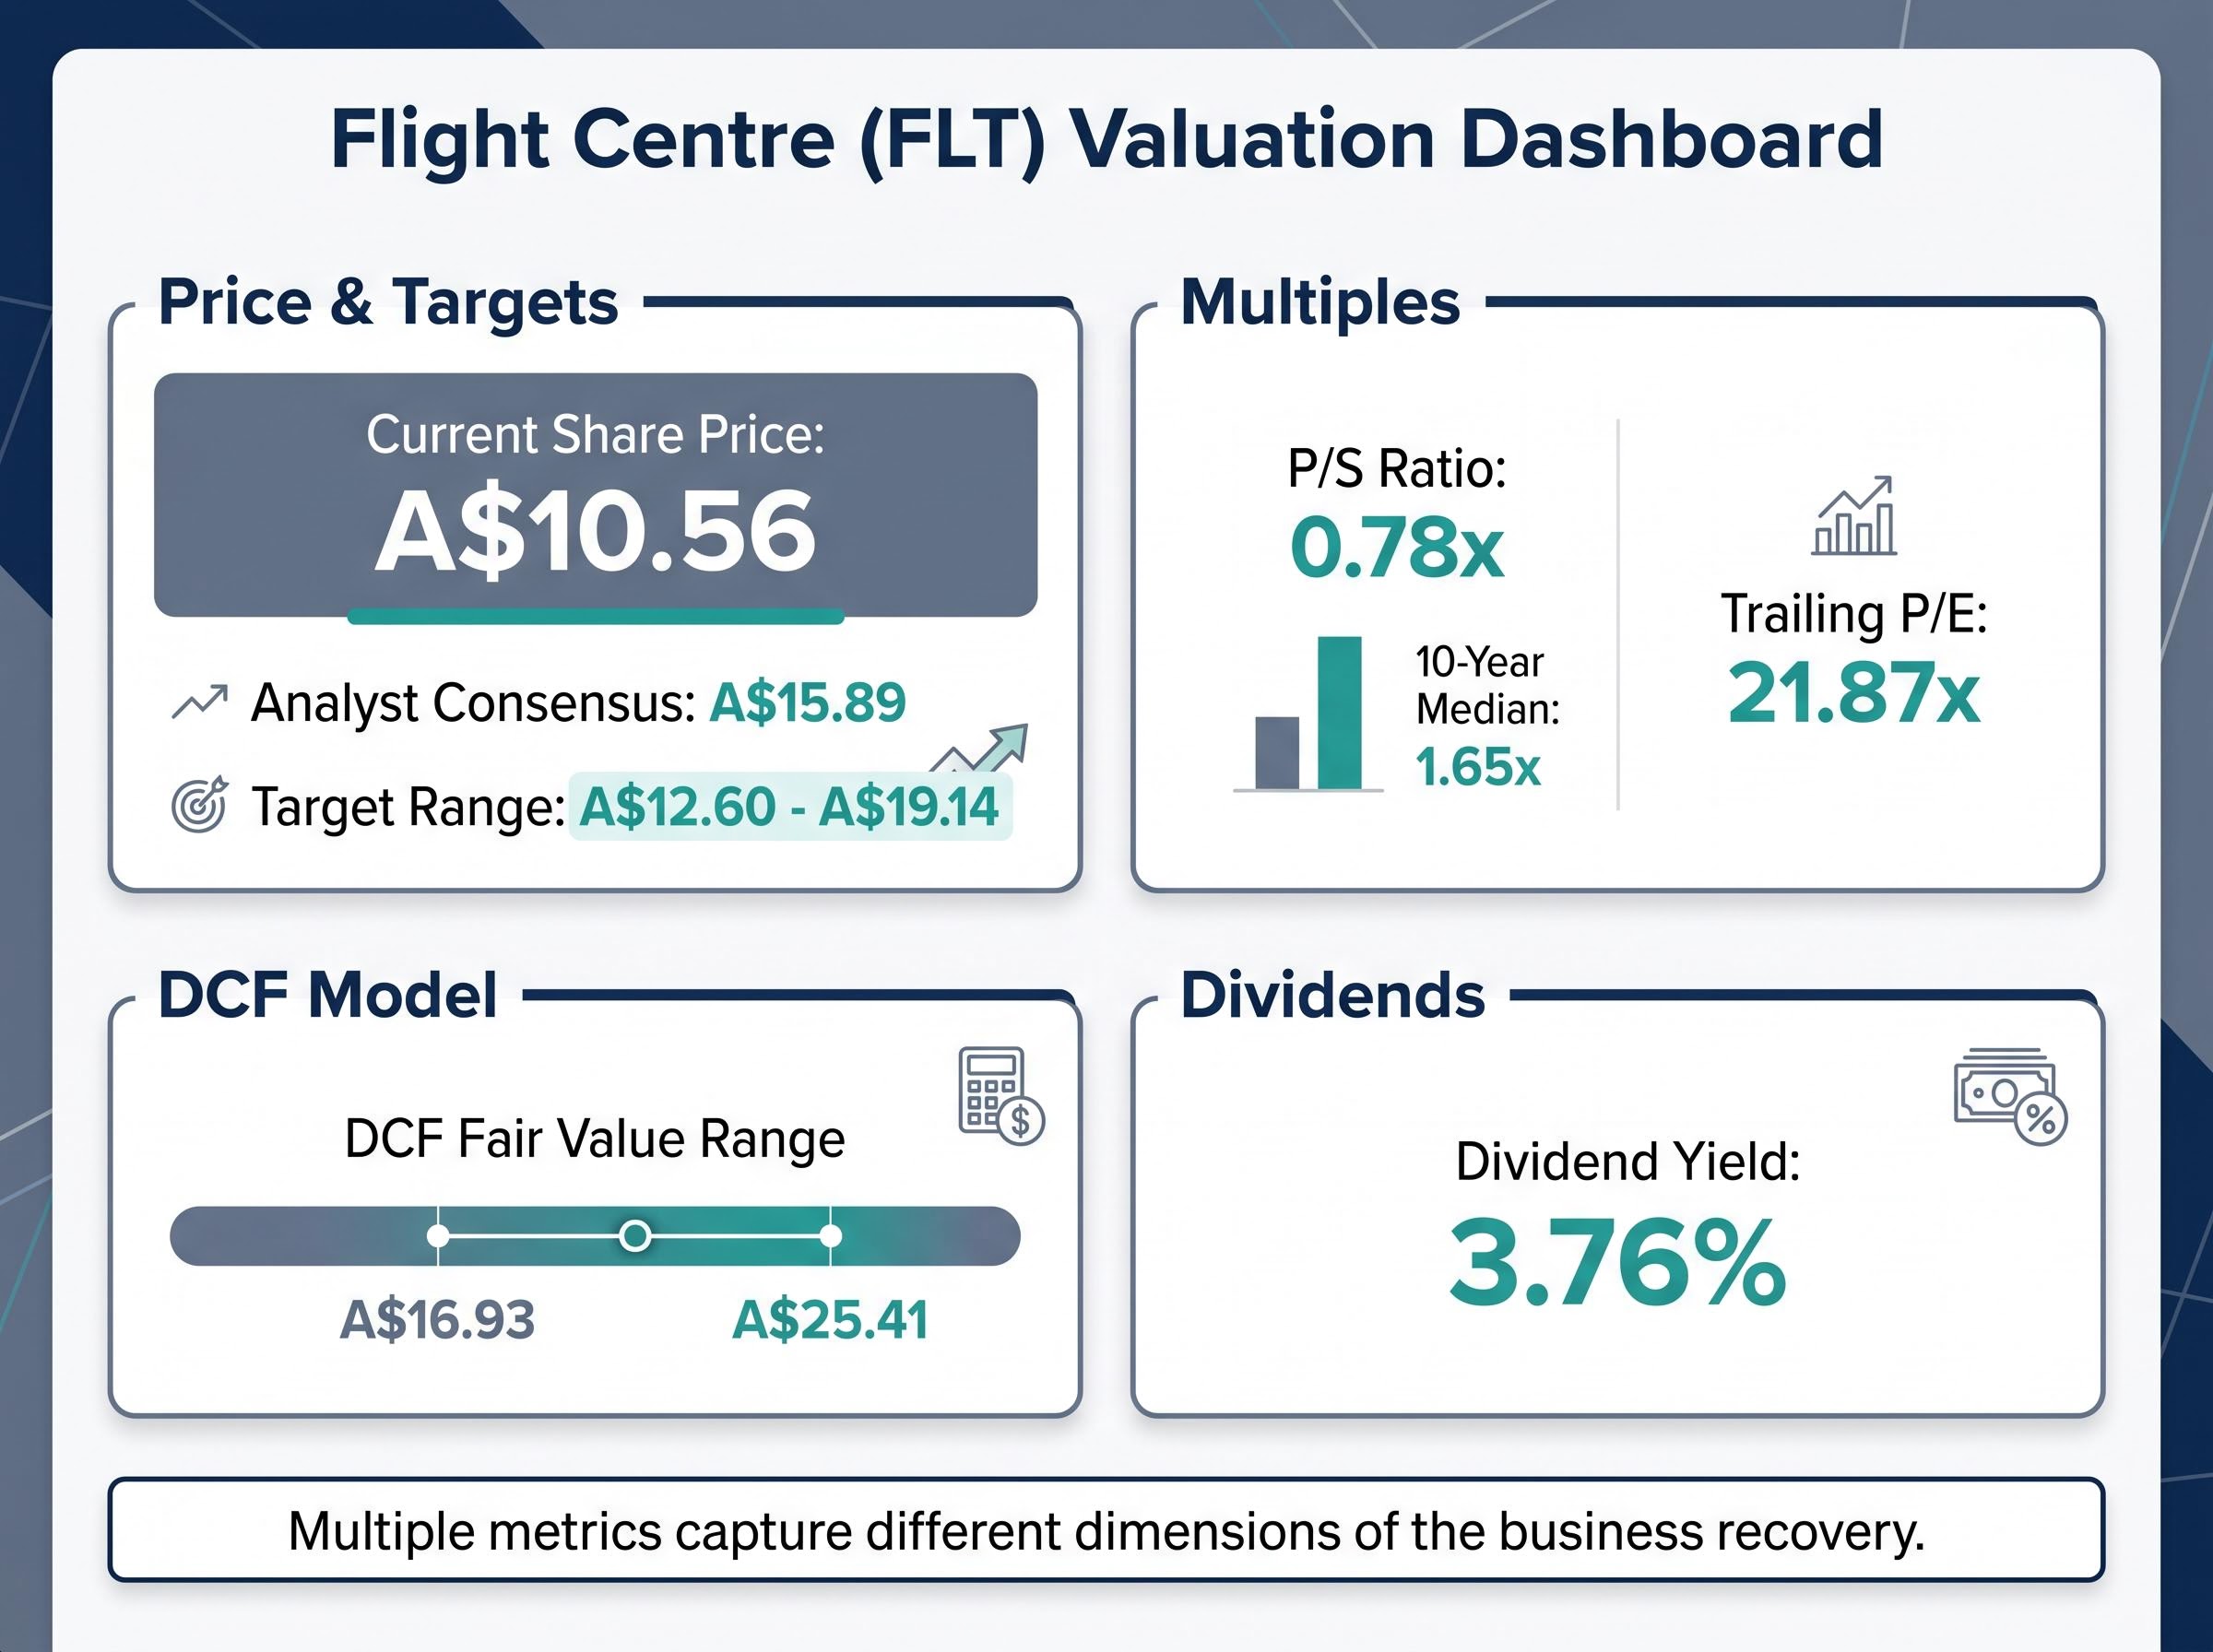
The P/S ratio suggests potential undervaluation. The trailing P/E signals the market already expects recovery. DCF outputs span A$16.93 to A$25.41 depending on margin assumptions. DDM reliability is constrained by a payout history that includes a multi-year suspension. Each metric tells a different story because each metric captures a different dimension of the business.
The dispersion of analyst targets, from A$12.60 to A$19.14, is not disagreement about the facts. It is disagreement about two variables: the net margin trajectory from the current 4.8% base, and corporate travel budget allocation trends through 2026. A 1-2 percentage point shift in net margin assumptions is enough to move a DCF output by A$5-8 per share. That single variable explains most of the analytical divergence.
“When your valuation methods disagree, the gap between them is not a problem to resolve. It is a map of the assumptions you need to test.”
The analytical discipline that clarifies FLT applies identically to any recovery-stage cyclical on the ASX. The metrics change. The process does not.
This article is for informational purposes only and should not be considered financial advice. Investors should conduct their own research and consult with financial professionals before making investment decisions. Past performance does not guarantee future results. Financial projections are subject to market conditions and various risk factors.
The multi-method framework applied here works for any ASX cyclical where earnings are recovering and single metrics are sending conflicting signals. FLT’s next quarterly result will update the inputs. The technology productivity ROI from Melon and SAM remains unquantified. Net margin pace and corporate travel demand through the second half of 2026 are genuinely uncertain.
None of that changes the process. Identify where the stock sits in its cycle. Layer relative multiples, DCF scenarios, and dividend analysis sequentially. Interrogate the qualitative narrative. Overlay the macro environment. The next step is to apply the same framework to at least one other ASX recovery-stage stock on a current watchlist. The value is not in the answer the framework produces for any single company. It is in the habit of asking the right questions before committing capital.
The ASX guidance on share investment risks specifically identifies capital loss, price volatility, and timing as structural exposures that apply across all listed equities, a baseline that recovery-stage cyclicals like FLT amplify through their sensitivity to margin and demand cycle inflection points.
The four main stock valuation methods are the price-to-sales ratio, the price-to-earnings and PEG ratio, discounted cash flow analysis, and the dividend discount model, each capturing a different dimension of a company's value and carrying its own limitations.
Each method relies on different inputs and assumptions, such as margin recovery rates, earnings growth forecasts, or dividend sustainability, so even small differences in those assumptions can produce dramatically different intrinsic value outputs for the same company on the same day.
The PEG ratio divides a company's price-to-earnings ratio by its expected earnings growth rate to assess whether the multiple is justified by growth; for Flight Centre, two sources using different growth assumptions produced PEG values of 1.18x and 0.62x on the same day, illustrating how sensitive the output is to the growth rate input.
Rather than relying on a single-point estimate, investors should run bull, base, and bear scenario models with explicit margin recovery assumptions, since a 1-2 percentage point difference in assumed net margin can shift the DCF fair value output by as much as A$5-8 per share.
The dividend discount model assumes predictable and sustained dividend payments, but cyclical companies like Flight Centre have demonstrated a willingness to suspend dividends during downturns, as occurred during COVID, making the model useful only as a floor valuation check rather than a primary methodology.


