
Why a BoJ Rate Hike Hasn’t Stopped the Yen Carry Trade
1 hr ago

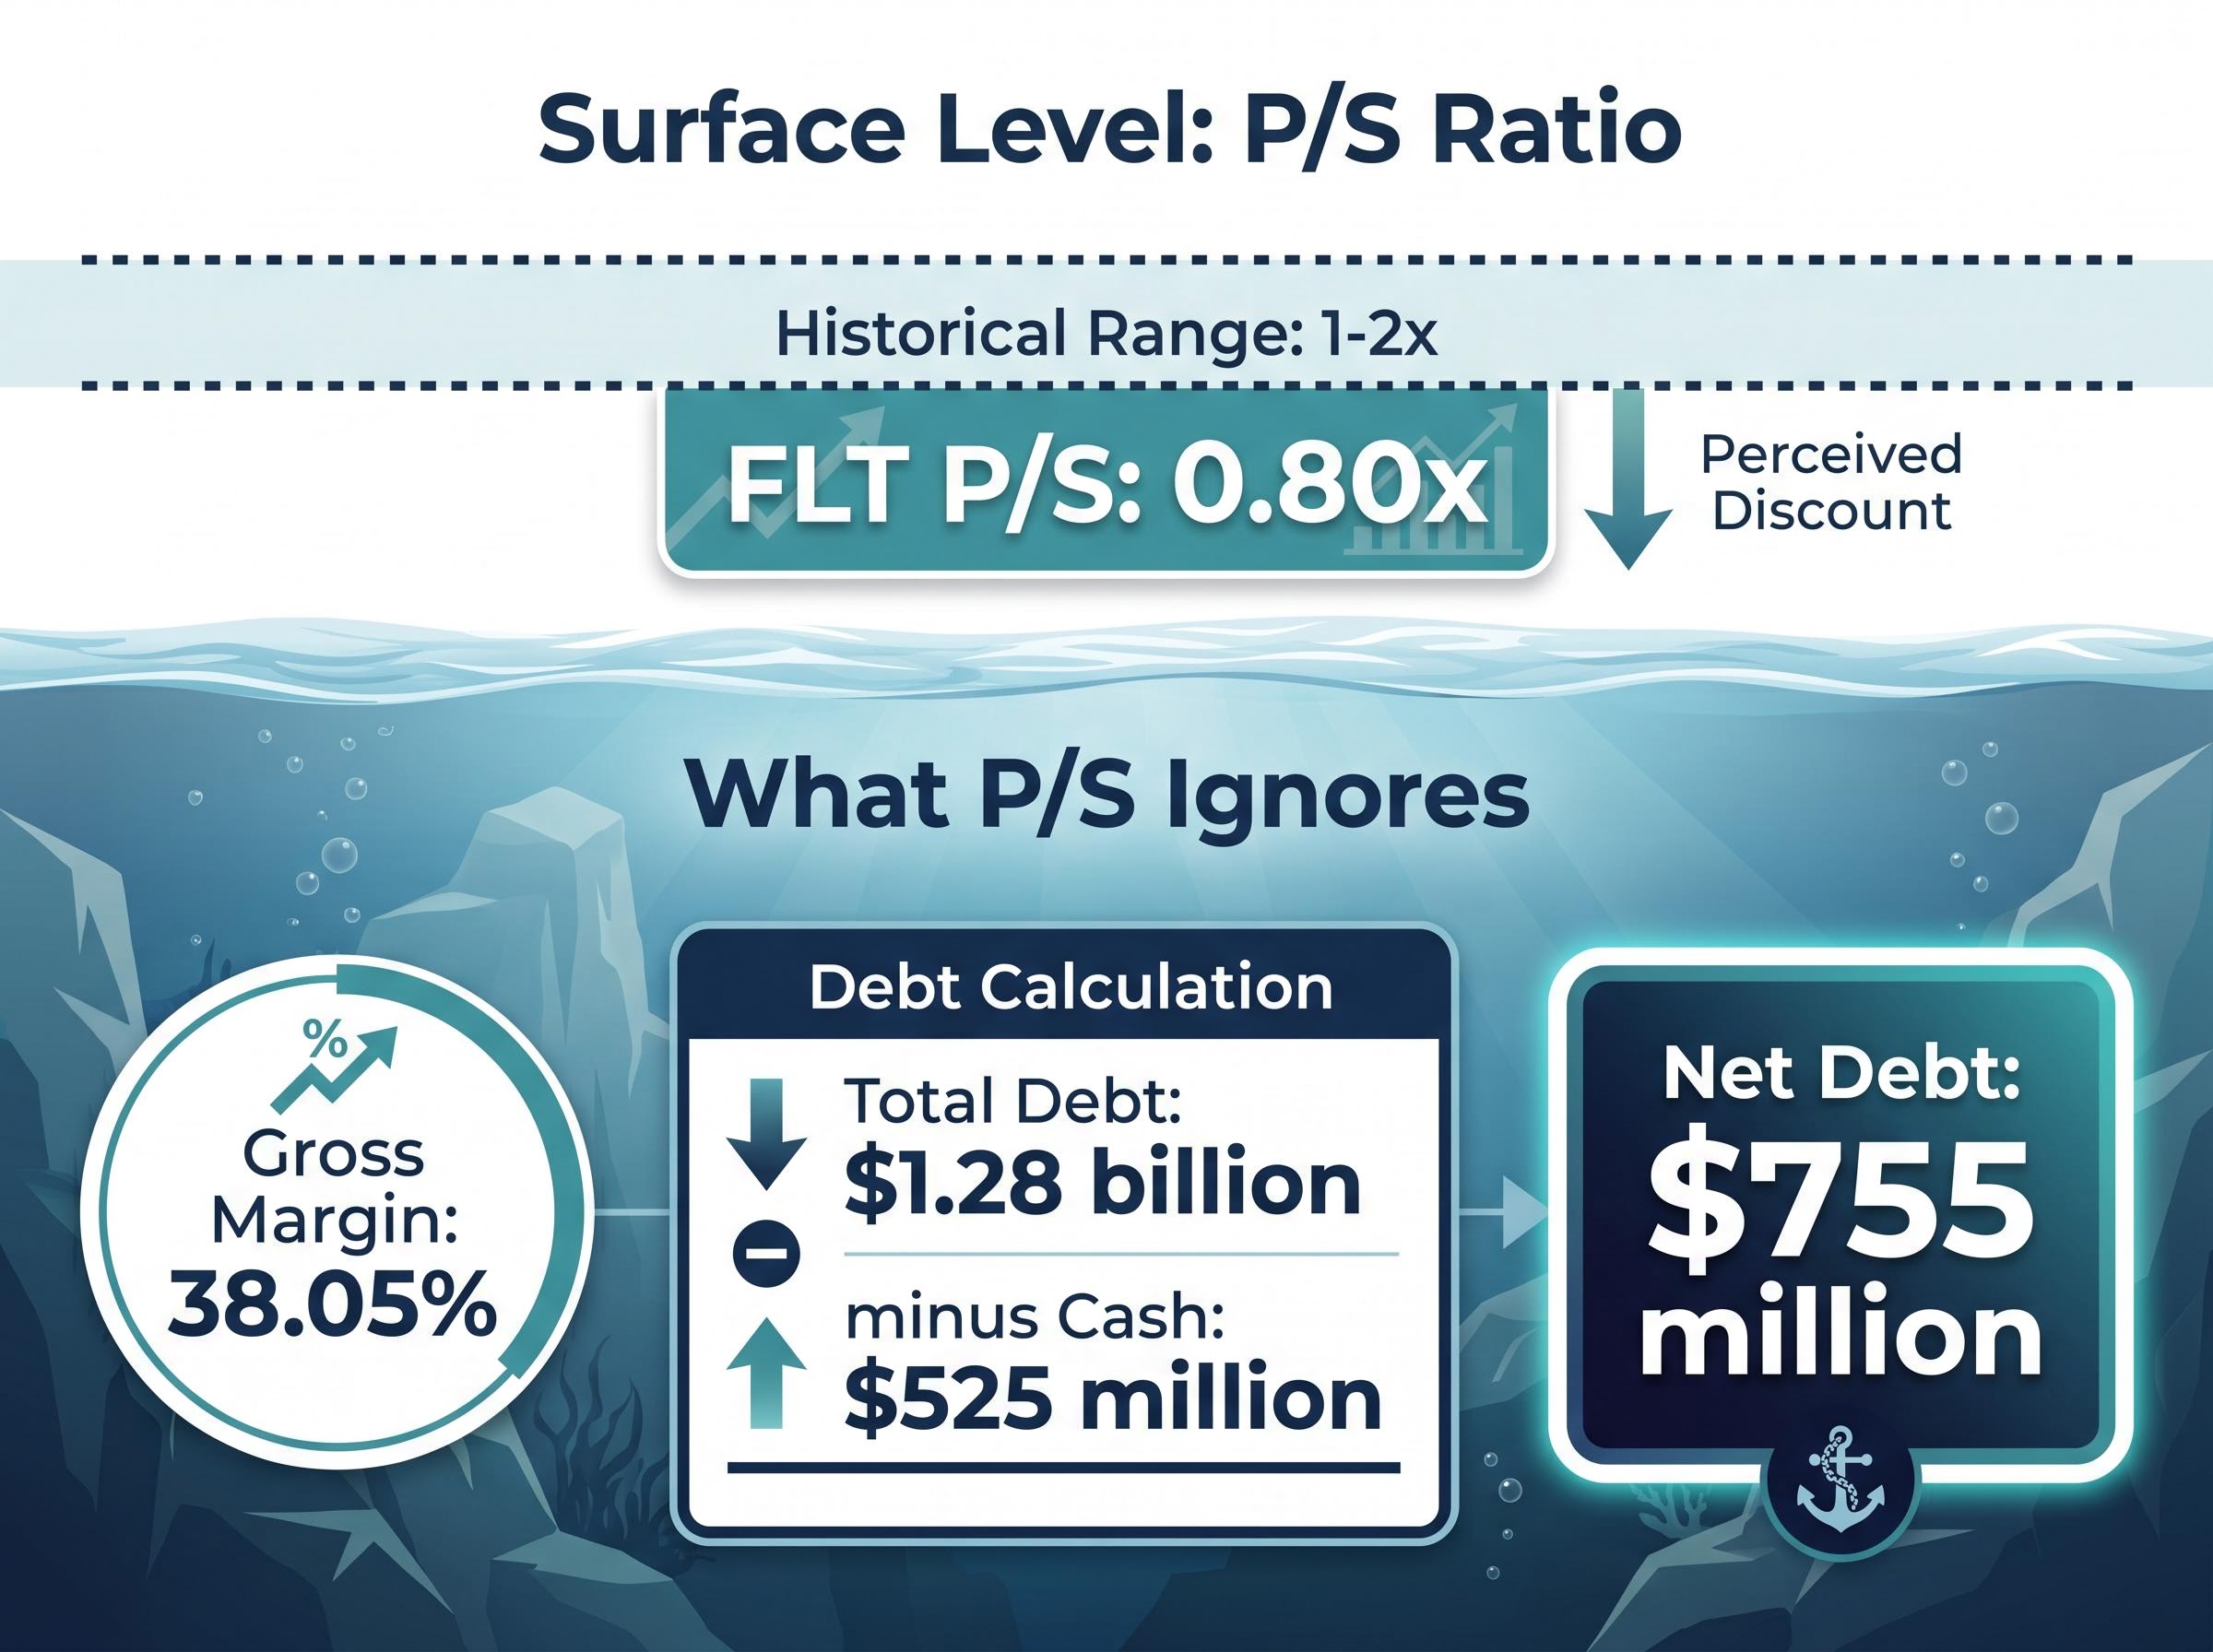
A single metric can make a cyclical stock look like a bargain at precisely the moment it deserves the most scrutiny. Flight Centre (ASX: FLT), with a price-to-sales ratio of approximately 0.80x against a historical average closer to 1-2x, appears cheap on the surface. Yet that apparent discount sits alongside $755 million in net debt and gross margins of 38.05%, neither of which the P/S ratio captures. For self-directed Australian investors evaluating share valuation methods in a market where the ASX 200 trades near elevated levels in mid-2026, the question is not whether a stock screens as cheap, but whether the method doing the screening is fit for the job. This article works through how P/S, Discounted Cash Flow (DCF) models, the Dividend Discount Model (DDM), and EV/EBITDA each function, where each one earns its credibility and where it misleads, and how to combine them into a structured multi-method framework suited to ASX stocks.
The P/S ratio divides a company’s market capitalisation by its total revenue. Its appeal is obvious: it requires only two inputs, both publicly available, and it works even when a company has no earnings. As an initial screening tool, it surfaces names that the market may be undervaluing relative to their top line.
The problem is what it leaves out. A low P/S tells an investor nothing about:
The IMF disclosure standards for ASX-listed companies, developed through technical assessment of Australia’s regulatory framework, establish the baseline expectations for quality financial reporting that self-directed investors rely on when sourcing revenue, debt, and earnings data as inputs to any valuation method.
FLT illustrates the gap. Its P/S of approximately 0.80x sits below the historical range of 1-2x, which looks like a discount. But P/S ignores the 38.05% gross margin that determines how much of that revenue reaches the bottom line. It also ignores net debt of approximately $755 million (total debt of $1.28 billion minus cash of $525 million), which represents a substantial claim on enterprise value that equity holders sit behind.
“In cyclical sectors, a low P/S ratio often reflects distress, not value.”
In travel and leisure, where gross margins compress during disruptions and fuel cost spikes, a depressed P/S can signal deteriorating fundamentals rather than an attractive entry point. Treating it as an automatic buy signal is one of the most common errors in cyclical recovery investing.
DCF analysis takes a fundamentally different approach. Rather than comparing price to a single financial metric, it attempts to estimate what a business is worth based on the cash it will generate in the future. The logic moves through four steps:
For net-debt-heavy businesses, this final step is where DCF earns its advantage over P/S. FLT’s $755 million in net debt is an explicit input to the DCF bridge. P/S ignores it entirely.
The honest caveat is that DCF output is only as good as the assumptions feeding it. The most influential assumption is rarely the near-term cash flow projection; it is the terminal value, which captures all cash flows beyond the explicit forecast period.
Terminal value typically represents 60-70% of a DCF’s total enterprise value. That means the choice of terminal growth rate, usually 2-3% for cyclicals in a higher-rate environment, and the WACC together drive the majority of the output. A sensitivity table testing both variables is not optional. It is the only way to understand the range of plausible outcomes rather than anchoring to a single point estimate.
For investors who want to take the sensitivity table discipline further, our full explainer on probability-weighted scenario modelling uses Tesla’s $575 analyst price target gap as a live framework to show how assigning explicit probability weights to bull, base, and bear scenarios produces a blended intrinsic value that can be compared directly to the current market price.
The DDM is a specialist instrument, not a universal one. It values a stock based solely on its expected future dividends, making it the right tool for consistent dividend payers and the wrong tool for everything else.
The core formula is the Gordon Growth Model:
P₀ = D₁ / (r – g)
Where P₀ is the intrinsic value, D₁ is the expected dividend next period, r is the required rate of return, and g is the sustainable dividend growth rate.
For Australian investors, the model carries a feature that international equivalents lack: franking credits. A $0.70 fully franked dividend carries a $0.30 franking credit, making the grossed-up dividend $1.00 for an investor on the full company tax rate. Ignoring this gross-up systematically undervalues fully franked dividend payers, which means DDM outputs for the major banks and mature yield stocks are more favourable than their headline yields suggest.
The franking credit calculation follows the 30/70 formula: a fully franked cash dividend is multiplied by 30 and divided by 70 to derive the credit, which means a $1,000 fully franked dividend carries a $428.57 credit that an SMSF in pension phase or eligible low-income retiree receives as a direct ATO cash refund.
The boundaries are equally clear. DDM is not appropriate for FLT in its current form, given an inconsistent dividend history. The following table maps where DDM fits and where it does not.
| DDM-suitable | DDM-unsuitable |
|---|---|
| Major banks with consistent dividend histories | Cyclical companies with volatile or suspended dividends |
| Mature yield payers with stable payout ratios | Growth companies reinvesting earnings |
| Fully franked dividend stocks (enhanced by gross-up) | Companies with inconsistent dividend policies |
For ASX income investors building a yield-focused portfolio, DDM is a precision tool that complements rather than replaces DCF.
Investors who want to move from the framework described here to a fully worked ASX bank valuation will find our dedicated guide to DDM valuation for ASX banks useful; it applies the Gordon Growth Model to Bank of Queensland’s live figures, anchors the cost-of-equity to the current RBA cash rate, and produces a sensitivity table showing how a two-percentage-point shift in the discount rate moves estimated fair value by more than $3 per share.
EV/EBITDA occupies the space between P/S and DCF. It is faster than building a full discounted cash flow model but captures the profitability and capital structure dimensions that P/S ignores.
The calculation has two components. Enterprise value equals market capitalisation plus total debt minus cash. For FLT, that means adding $1.28 billion in total debt and subtracting $525 million in cash to arrive at an enterprise value that reflects the full claim on the business, not just the equity slice. EBITDA (Earnings Before Interest, Tax, Depreciation and Amortisation) should be normalised, stripping out one-off items such as restructuring charges or asset sale gains to produce a figure that reflects ongoing operating performance.
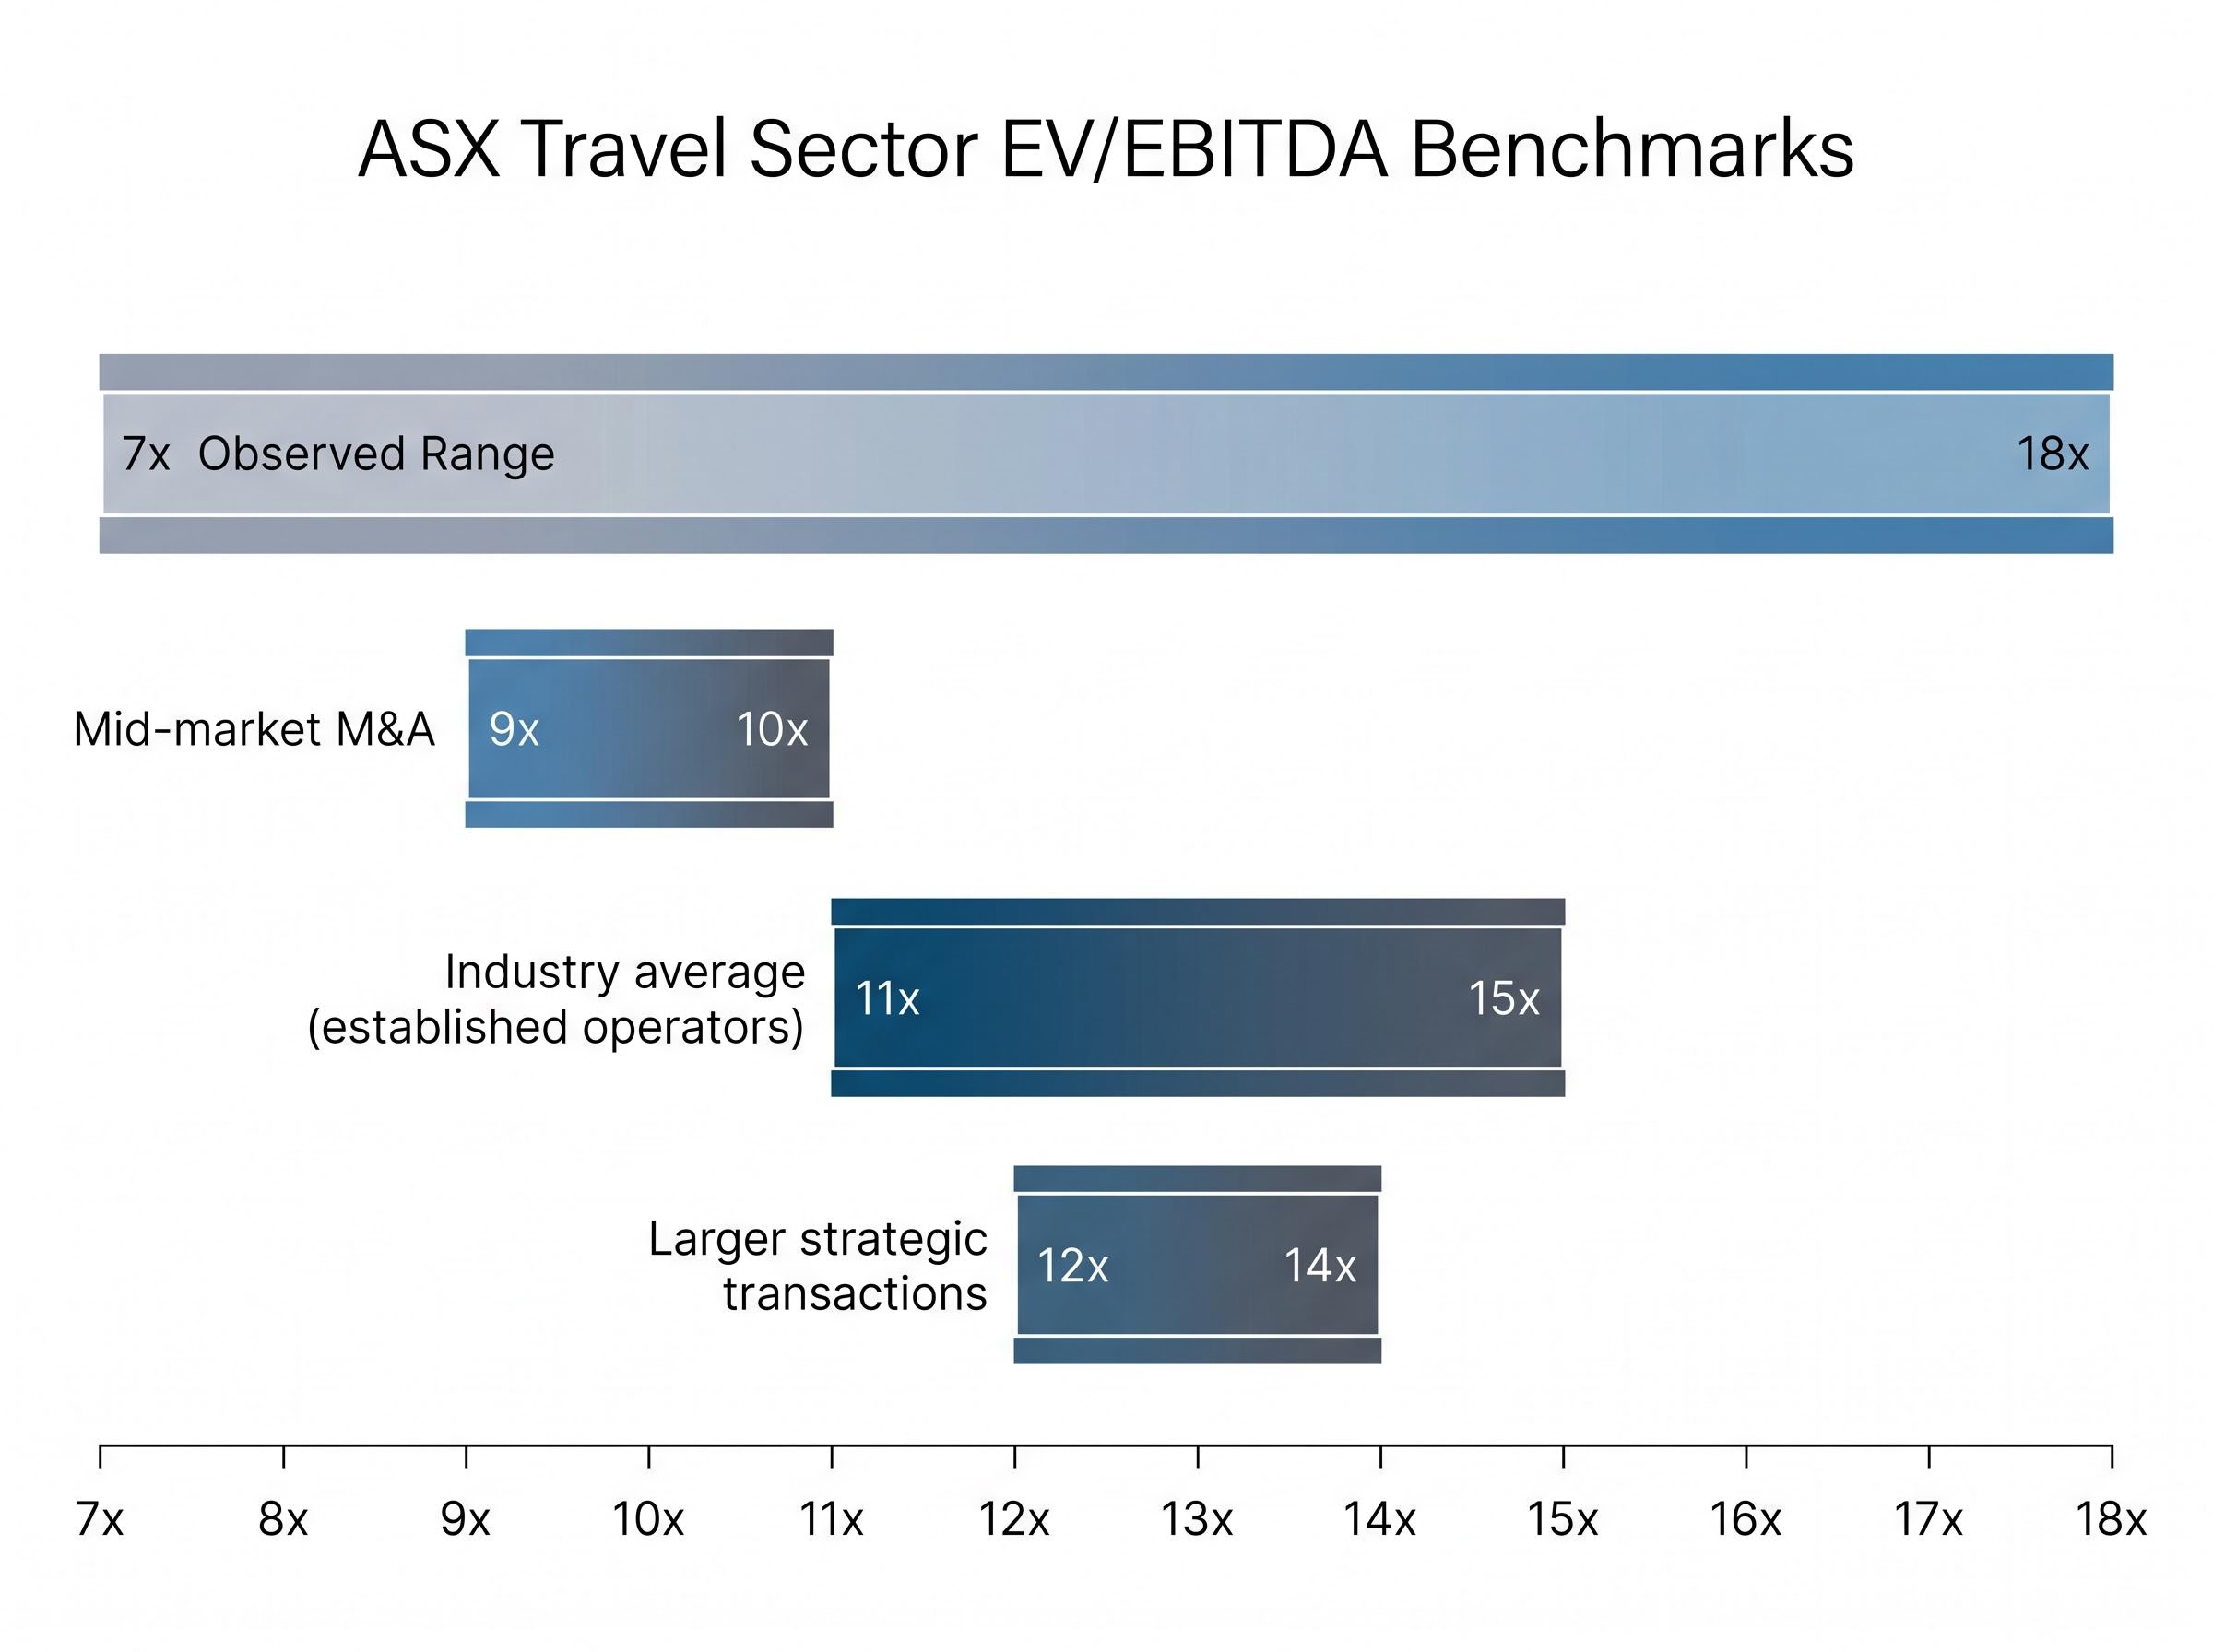
The resulting multiple is the market’s standard for sector comparison and M&A context. ASX travel sector data shows an observed range of 7-18x, with the industry average closer to 11-15x for established operators. Mid-market M&A benchmarks sit at approximately 9-10x, while larger strategic transactions command 12-14x.
Where EV/EBITDA adds the most value is as a sanity check on DCF outputs. If a DCF model implies an EV/EBITDA above 18x for a company whose peers trade at 10-15x, the DCF assumptions are likely too optimistic, regardless of how internally consistent the model appears.
| Method | What it measures | Best use case | Key limitation |
|---|---|---|---|
| P/S ratio | Price relative to revenue | Quick screen for revenue-stage or cyclical candidates | Ignores profitability, leverage, and margin quality |
| EV/EBITDA | Enterprise value relative to operating earnings | Sector benchmarking; M&A comparisons | Requires normalised EBITDA; less useful for pre-profit companies |
| DCF | Intrinsic value from projected future cash flows | FCF-generating businesses; debt-heavy balance sheets | Terminal value drives 60-70% of output; assumption-sensitive |
Understanding each tool in isolation is the foundation. Applying them in sequence is where the value compounds. The following five-step process moves from quick screen to final judgement:
For multi-segment businesses, Sum-of-Parts (SOTP) analysis, applying DCF or peer multiples to each division separately, is a further extension worth noting as an advanced tool.
FLT threads through this sequence clearly. P/S flags it as potentially cheap at 0.80x. The DCF must then account for $755 million in net debt and stress-test terminal value in a higher-rate environment. EV/EBITDA against the 11-15x sector average provides the reality check on whether the DCF output is grounded in what comparable businesses actually trade at.
Disagreement between methods is normal and informative. A P/S ratio that says “cheap” while a DCF says “fairly valued” or “overvalued” is not a broken framework. It is the framework doing its job by surfacing the tension.
The question to ask is which method’s assumptions are less defensible given the specific company’s characteristics. For cyclicals with volatile earnings and meaningful debt loads, DCF and EV/EBITDA carry more interpretive weight than P/S when they diverge. P/S lacks the inputs to reflect the balance sheet and profitability dynamics that drive value in these businesses.
Each method answers a different question. P/S asks whether the market is discounting revenue. DCF asks what the business is worth on a cash flow basis. EV/EBITDA asks how the market prices operating earnings relative to peers. DDM asks what a stream of dividends is worth today. Using multiple methods reveals the tension points that single-metric analysis hides.
Dividend trap warning signs are easy to miss when screening by yield alone: a rising dividend yield driven by a falling share price can indicate the market is already pricing in a cut, and a payout ratio above 100% is mathematically unsustainable regardless of how attractive the stated income looks on a screener.
Self-directed investors face a practical constraint: time and data access are finite. When only one method can be applied deeply, DCF is the recommended anchor for businesses generating free cash flow. EV/EBITDA is the recommended anchor for situations where sector comparison matters most. Platforms such as Rask Media, Simply Wall St, and Livewire Markets publish DCF-based fair value estimates that can serve as starting points for further analysis.
The when-to-reach-for-each summary:
In a market where the ASX 200 trades near elevated levels in mid-2026 and cyclical recovery names present depressed revenue multiples, the temptation to rely on a single screen is highest precisely when doing so carries the most risk. Independent valuation discipline is not about eliminating uncertainty. It is about reducing the probability of errors that were detectable before capital was committed.
The cheapness signal from a low P/S ratio in a cyclical stock is most persuasive precisely when the underlying risk is highest. Depressed revenue multiples coincide with margin compression, elevated debt, and uncertain recovery timelines, all factors that P/S is structurally blind to. Multi-method valuation is a form of discipline, not complexity for its own sake.
The practical sequence holds: P/S opens the door, DCF estimates intrinsic value, EV/EBITDA provides the cross-check, and DDM applies to income positions with consistent dividend histories. When these methods agree, conviction strengthens. When they disagree, the tension itself is the insight.
Before acting on any single metric that drives conviction in a position, building a sensitivity table and verifying that the implied EV/EBITDA sits within the sector’s observed range is the minimum threshold for informed decision-making.
This article is for informational purposes only and should not be considered financial advice. Investors should conduct their own research and consult with financial professionals before making investment decisions.
The four main share valuation methods used by ASX investors are the price-to-sales ratio (P/S), Discounted Cash Flow (DCF) analysis, the Dividend Discount Model (DDM), and EV/EBITDA. Each method answers a different question about a company's value, so combining them produces a more complete picture than relying on any single metric.
The P/S ratio only compares market capitalisation to revenue, so it ignores profitability, leverage, and margin quality. For cyclical stocks like those in the travel sector, a low P/S can reflect deteriorating fundamentals rather than a genuine bargain, particularly when the company carries significant net debt that the ratio does not capture.
After building a DCF model, calculate the EV/EBITDA multiple implied by your DCF output and compare it against the sector's observed range. For ASX travel stocks, for example, established operators trade at roughly 11-15x; if your DCF implies a multiple above 18x, the underlying assumptions are likely too optimistic and should be revisited.
The DDM is best suited to consistent dividend payers with stable payout ratios, such as the major ASX banks, particularly because Australian investors can gross up fully franked dividends to include their franking credits, which makes DDM outputs more favourable than headline yields suggest. It is not appropriate for cyclical companies with volatile or suspended dividend histories.
For ASX cyclical stocks, the Weighted Average Cost of Capital (WACC) used as the DCF discount rate typically falls in the 8-12% range, and a terminal growth rate of 2-3% is generally appropriate in a higher-rate environment. Running a sensitivity table across both variables is essential because terminal value drives approximately 60-70% of the total DCF enterprise value estimate.