Stock-Bond Correlation Hits 30-Year Extreme, Rattling 60/40 Investors
4 hrs ago
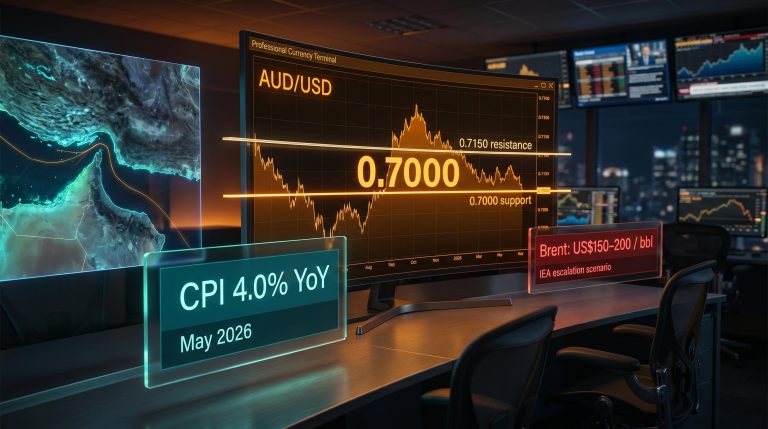
A single Truth Social post from Donald Trump on 11 May 2026 was enough to push Brent crude above US$105 per barrel and send shockwaves across six ASX sectors simultaneously. Trump’s rejection of Iran’s diplomatic overture reignited Strait of Hormuz supply fears, triggering a 3.8% single-session spike in ICE Brent crude futures. The ripple effects were immediate and paradoxical: energy and uranium stocks surged while gold fell, lithium stirred on electric vehicle themes, and banks slipped on dividend mechanics compounded by inflation anxiety.
The oil price impact on the stock market played out in real time across the ASX on 11 May, creating simultaneous winners, losers, and speculative themes from a single geopolitical catalyst. What follows maps the full chain of consequences, explaining not just what moved but why, and what the pattern tells investors about how commodity shocks transmit across unrelated sectors in a single session.
Trump rejected Iran’s “confidence-building” proposal on 9 May 2026, describing it on Truth Social as a deal that was never going to fly. Iran had offered a partial reopening of the Strait of Hormuz in exchange for lifting the US naval blockade on Iranian ports. By 11 May, traders had translated the diplomatic collapse into a specific supply-risk calculation.
Trump characterised Iran’s proposal as “a non-starter,” closing the door on the most concrete de-escalation framework either side had offered since April.
The market response was not sentiment noise. It was a structured repricing of disruption probability. JPMorgan’s Natasha Kaneva had already flagged Hormuz closure risks pricing into futures, and Control Risks assessed escalation probability at “medium-high.” The Australian Strategic Policy Institute (ASPI) warned separately of proxy tanker attack risks that could reduce Hormuz flows.
The repricing mechanism on 11 May sits within a broader supply architecture that traders had been pricing since late April: the Hormuz triple lock, combining US naval blockade operations, Iranian toll enforcement on non-US vessels, and the near-total withdrawal of commercial war risk insurance, created a structural supply floor that made any diplomatic rejection immediately consequential for futures markets.
The timeline tells the story:
That 3.8% move represented a confirmed Hormuz risk premium being priced into the forward curve, not a speculative overshoot but a calculated bet on supply vulnerability.
The Strait of Hormuz is the world’s most significant oil transit chokepoint. Even a partial disruption carries outsized pricing effects because traders price in disruption probability, not just current physical supply. A diplomatic rejection alone can move prices because the futures market reflects the expected cost of potential scarcity, not only barrels already lost.
This is the mechanism that connects a Truth Social post to the price Australian motorists pay at the pump.
Rising Brent prices feed into Australian import costs, petrol prices, and the Reserve Bank of Australia’s (RBA) inflation calculations. The transmission chain operates in a specific sequence:
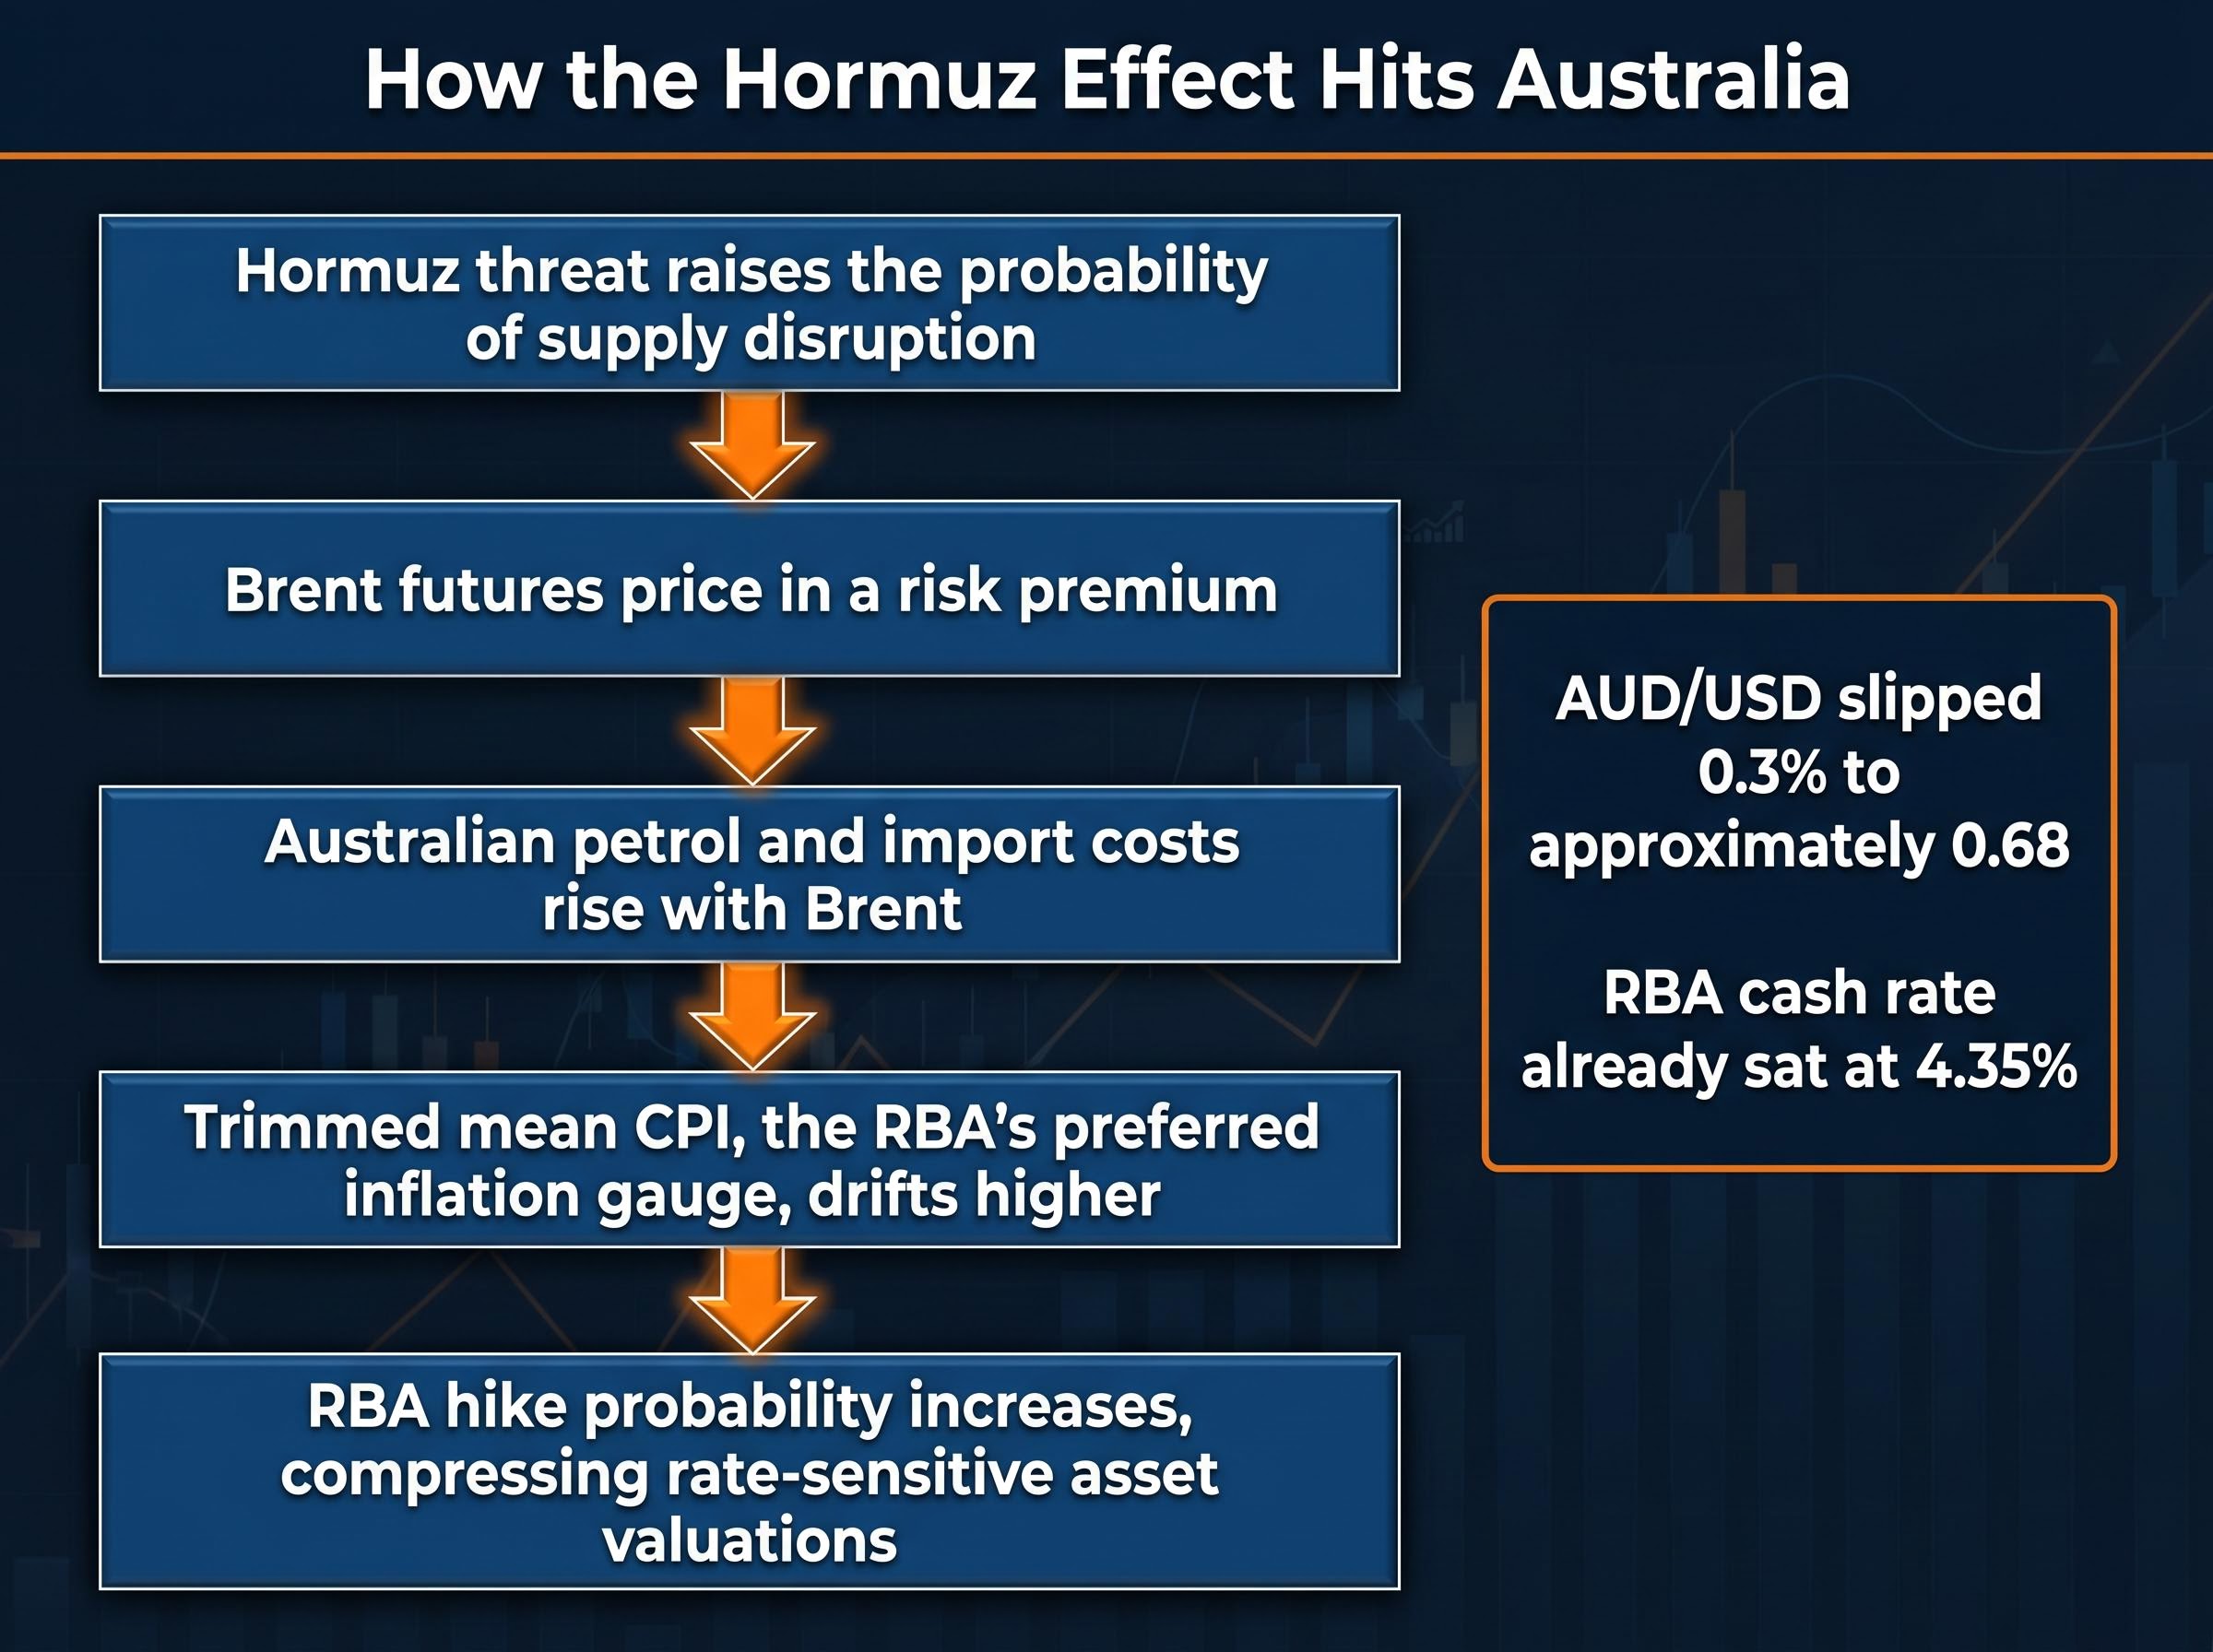
On 11 May, the AUD/USD slipped 0.3% to approximately 0.68, partially reflecting these oil-driven inflation expectations. The RBA cash rate already sat at 4.35% following the 5 May hike, making markets acutely sensitive to any additional inflation signal. Compounding the pressure, China’s April Producer Price Index (PPI) came in at +2.8% year-on-year, significantly above the 1.5% forecast, representing the strongest upstream inflation signal from Australia’s largest trading partner in over three years.
The RBA’s May 2026 Statement on Monetary Policy includes a dedicated section on the impact of higher global energy prices on the Australian economy, providing the official framework for how Brent-driven import cost pressures translate into trimmed mean CPI and influence the Board’s rate deliberations.
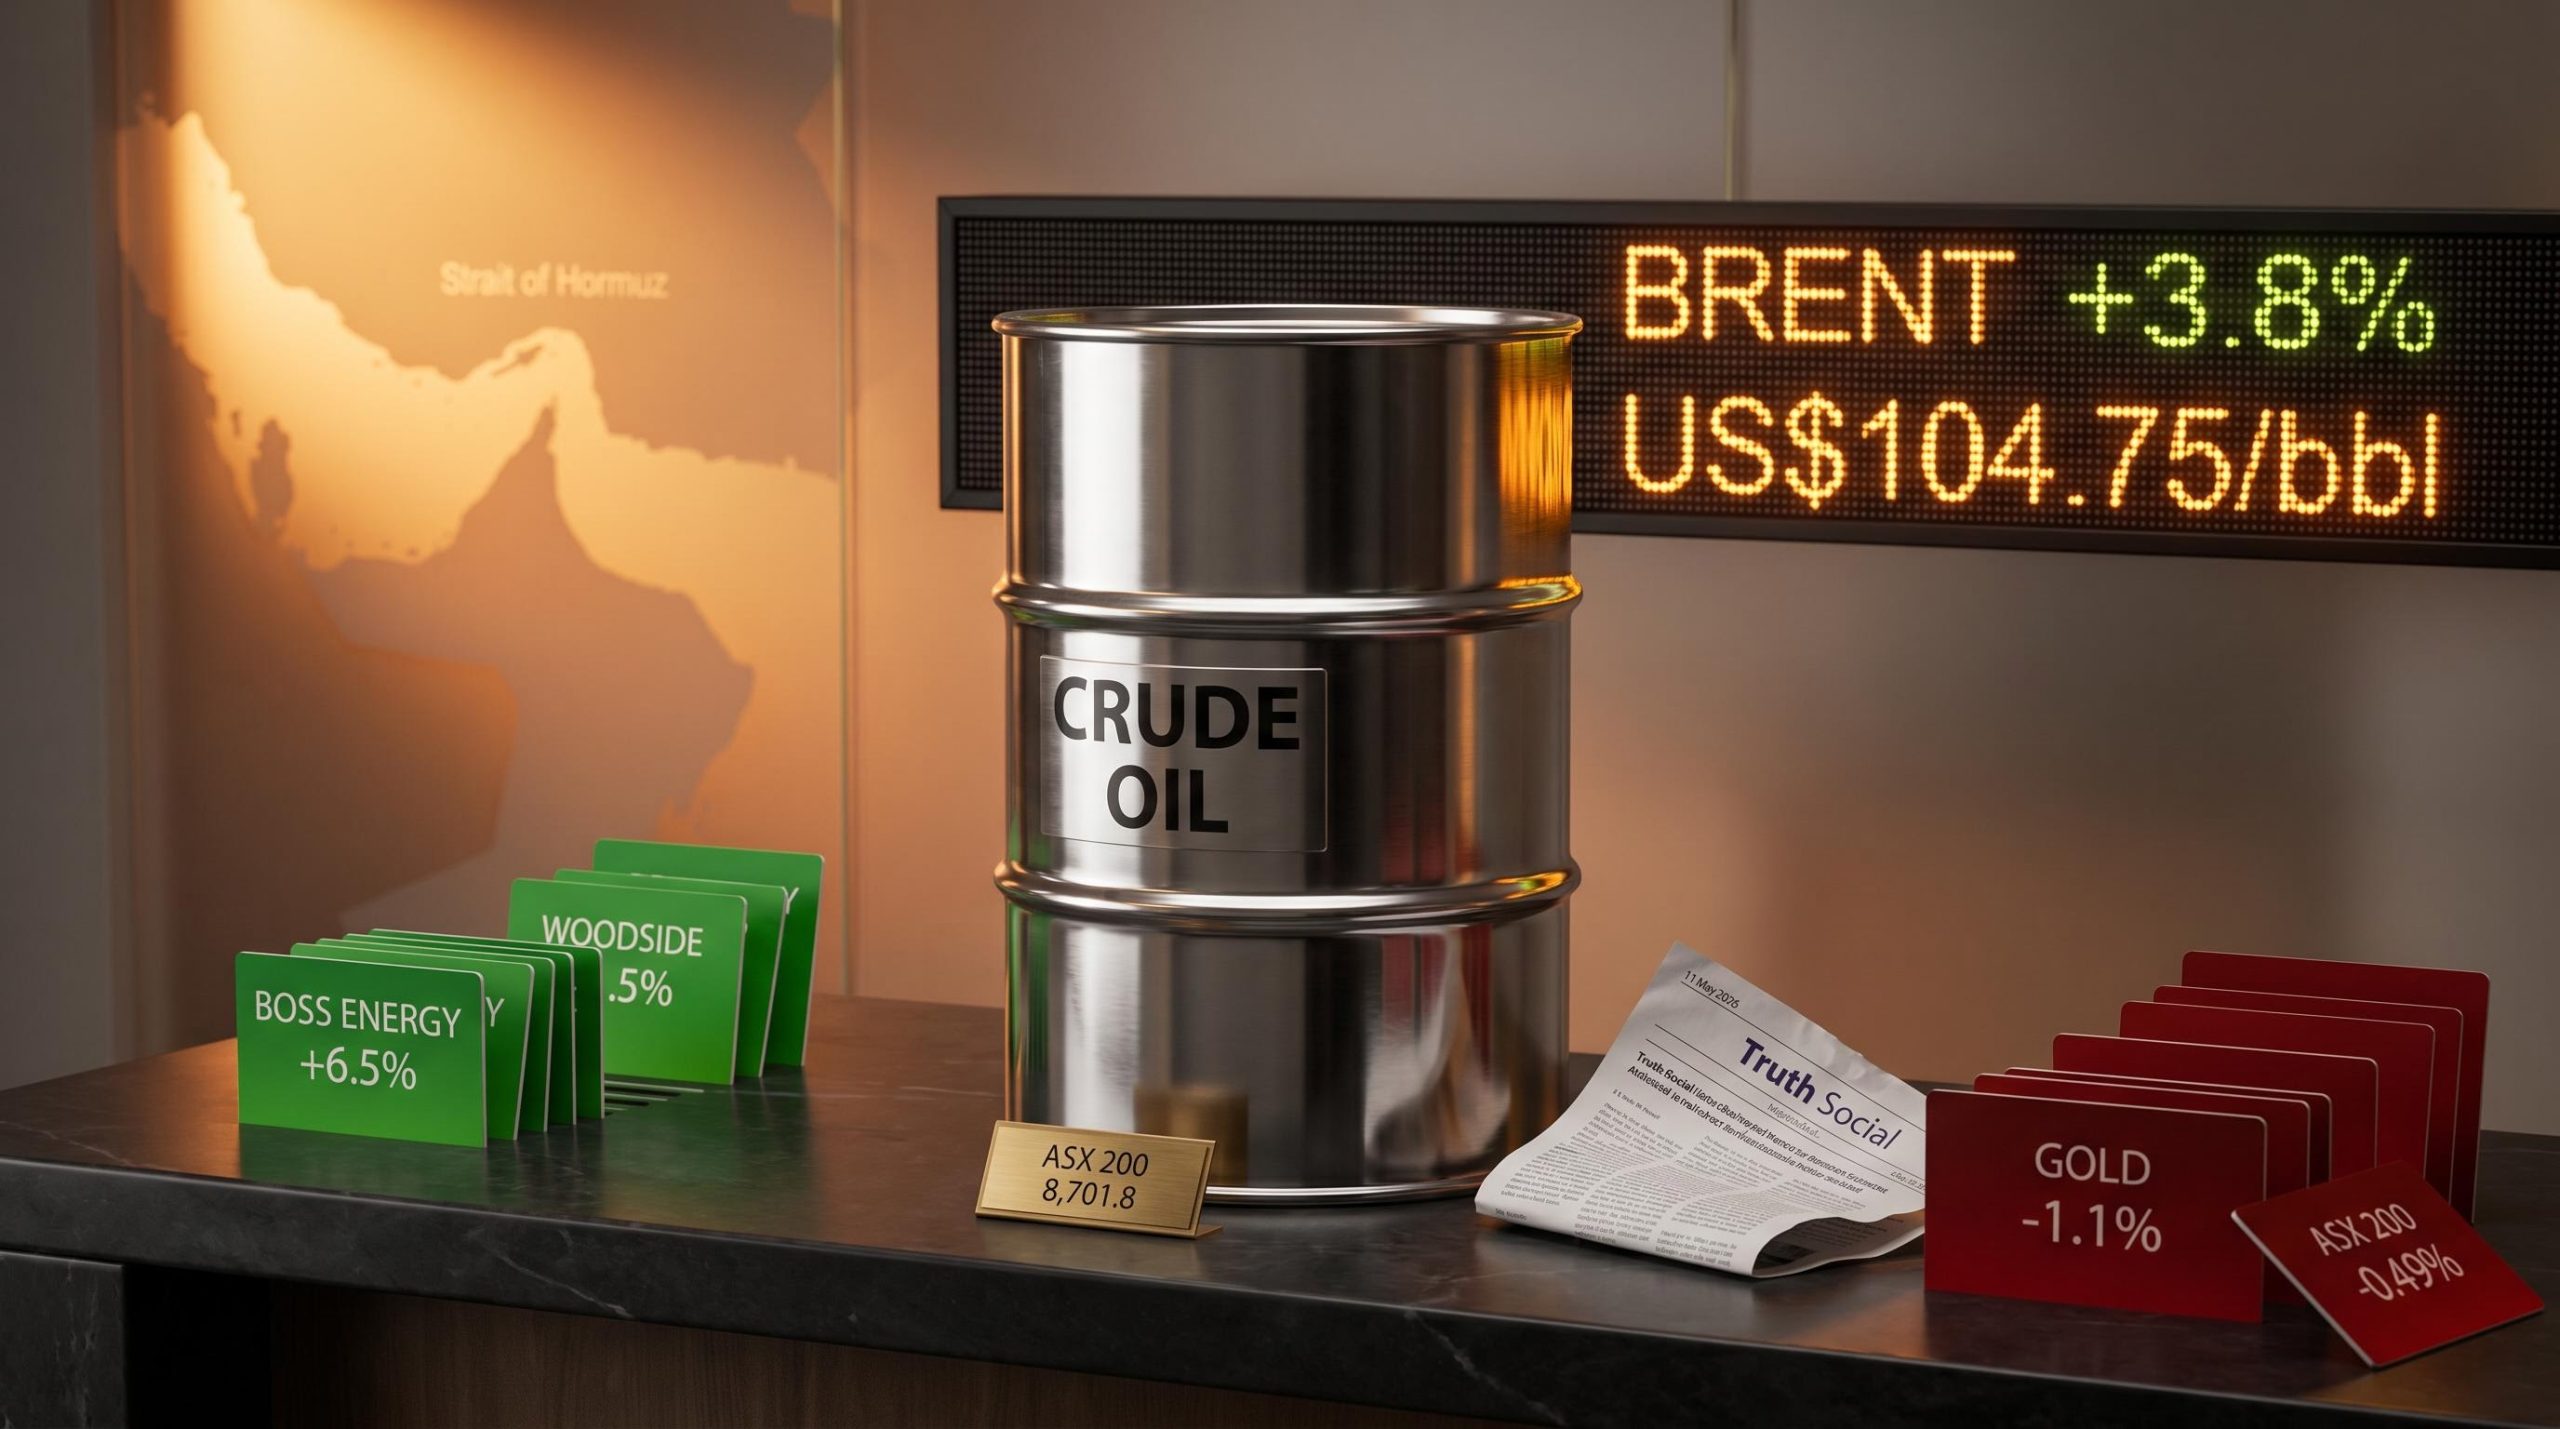
The ASX energy sector gained 1.09% to 10,334.8 on 11 May. Against the ASX 200’s 0.49% decline, the outperformance was stark. The more interesting story sat within the sector itself: the gap between oil and gas names and uranium equities.
| Stock | Sector | 11 May move (%) | Primary driver |
|---|---|---|---|
| Woodside Energy | Oil/Gas | +1.5% | Expanding LNG margins at higher Brent |
| Boss Energy | Uranium | +6.5% | Energy security narrative plus supply crunch |
| Paladin Energy | Uranium | +5.8% | Kazatomprom cuts, nuclear buildout demand |
| Deep Yellow | Uranium | +4.6% | Structural supply constraints |
Woodside’s gain was mechanically linked to higher Brent lifting LNG margins. Uranium names delivered multiples of that move. The reason lies in a structural argument analysts at Macquarie Equities and Bell Potter have advanced: uranium benefits from both the energy security narrative activated by Hormuz risk and its own independent supply crunch via Kazatomprom production cuts and growing nuclear buildout interest in Japan and Australia.
Macquarie Equities has argued uranium offers greater upside than oil and gas at current price levels, with the supply crunch providing a stronger structural tailwind than LNG margin expansion alone.
The performance gap on a single oil-shock session encapsulates a broader investment thesis. Energy security narratives lift all energy names, but structural supply constraints create a second-order premium that separates sector leaders from followers.
The commodity moves were real. GFEX lithium carbonate futures surged 3.5% to CNY 205,000/t, on course for the first close above that level since August 2023. Australian spodumene concentrate prices rose 2.5% to US$2,900/t.
| Commodity | 11 May move (%) | Analyst characterisation |
|---|---|---|
| GFEX lithium carbonate | +3.5% to CNY 205,000/t | Technically meaningful level break; first close above CNY 200,000 since August 2023 |
| Australian spodumene concentrate | +2.5% to US$2,900/t | Oversupply headwinds limit equity follow-through |
The bull case holds logic: higher oil prices make EVs relatively more cost-competitive at the pump, which supports lithium demand narratives. ASX lithium names reflected the theme modestly:
The equity gains were muted relative to the commodity moves. Fund managers including representatives at BlackRock have characterised the lithium move as a short-term theme against a backdrop of spodumene oversupply. BetaShares ETF flow data showed minimal shift toward lithium ETFs relative to energy ETFs. The more substantive driver of lithium demand remains China EV subsidies and policy, not oil price levels. Investors should treat the session as a data point worth monitoring rather than a confirmed rotation signal.
Oil spiked. Commodity sector strength broadened. Gold fell 1.1% to US$4,679.60/oz on COMEX. The Gold Sub-Index dropped 1.3%.
The contradiction dissolves once the rate-expectations mechanism comes into view.
The two-part mechanism: first, elevated oil prices stoke inflation expectations, which lift rate expectations, which increase the opportunity cost of holding non-yielding gold. Second, higher diesel and energy costs create a direct operational margin headwind for gold producers.
The gold equity declines reflected both forces:
With the RBA cash rate already at 4.35% following the 5 May hike, any additional inflation signal carries disproportionate weight. China’s PPI beat (+2.8% versus 1.5% forecast) compounded the pressure by providing an independent upstream inflation signal from Australia’s largest trading partner.
Shane Oliver of AMP Capital noted the Hormuz premium in oil prices, combined with rising China PPI, could add 1-2% to Australian import cost pressures. Markets repriced the probability of a July or August 2026 RBA hike upward, and gold absorbed the cost. The selloff is the clearest illustration of how oil price shocks create non-obvious losers through the rate-expectations channel.
The ASX 200 closed at 8,701.8, down 0.49%. Beneath the headline number, a single supply-risk event transmitted simultaneously across six sectors with distinct and sometimes opposing outcomes.
ASX sector rotation under sustained oil shocks follows a more durable pattern than single-session moves suggest: Woodside, Santos, and Karoon Energy accumulated gains of approximately 40% year-to-date in the 2026 oil shock, while airlines absorbed an estimated A$800 million in additional fuel costs, illustrating the asymmetric and compounding nature of the sector divergence that was previewed in miniature on 11 May.
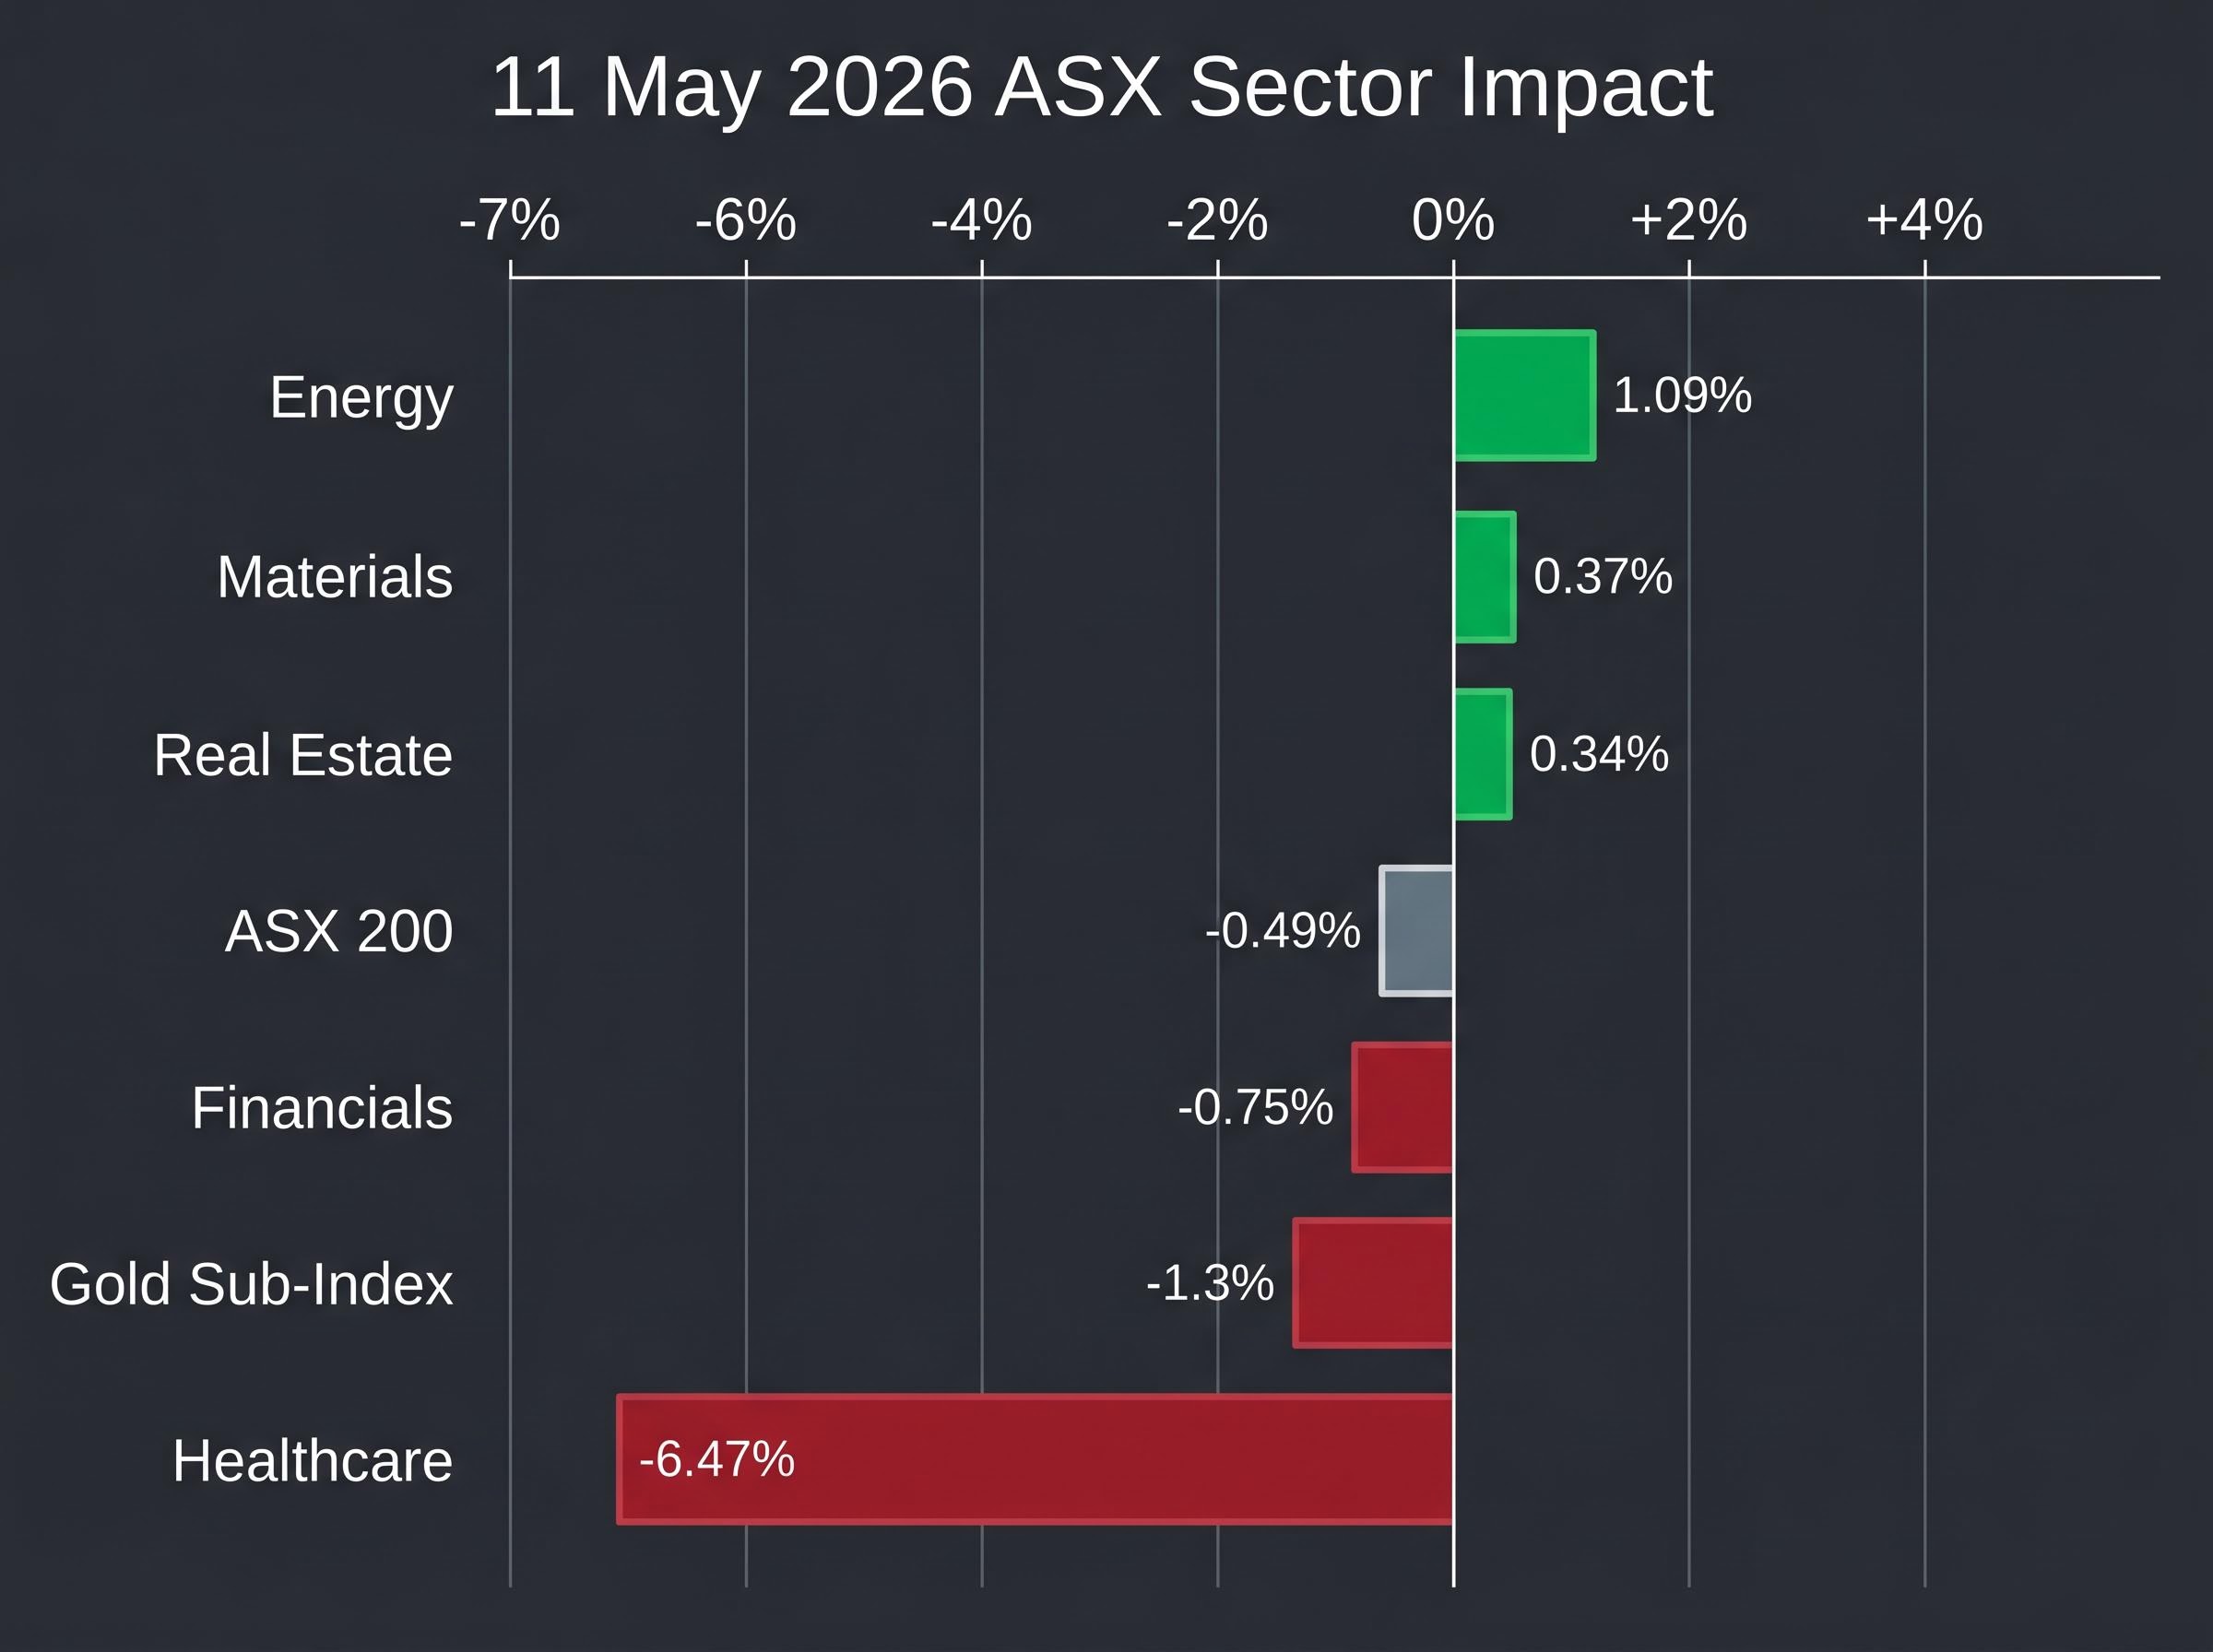
| ASX sector | 11 May move (%) | Primary driver | Oil price impact direction |
|---|---|---|---|
| Energy | +1.09% | Direct commodity price uplift | Positive |
| Materials | +0.37% | Mixed commodity tailwinds | Mixed |
| Gold Sub-Index | -1.3% | Rate expectations, cost inflation | Negative |
| Financials | -0.75% | Inflation anxiety, dividend mechanics | Negative |
| Real Estate | +0.34% | Selective positioning | Mixed |
| Healthcare | -6.47% | CSL-specific event (not oil-driven) | Neutral |
The forward-looking variables that determine whether the Hormuz premium persists are bounded and trackable:
Carl Capolingua of Market Index identifies ASX 200 support at 8,621 as the floor for the current rally originating from 8,262. A sustained Brent above US$100 combined with a CPI upside surprise could test that level. The AUD/USD at approximately 0.68 serves as a real-time barometer of how markets are pricing the inflation and policy outlook.
Two scenarios frame the week ahead.
The 7 May commodity repricing, when Brent fell approximately 7.6% on US-Iran deal framework reports while gold, copper, and uranium ETFs surged simultaneously, provided a live demonstration of how quickly the Hormuz risk premium can reverse and which sectors lead the rotation in both directions.
Scenario one: The Hormuz premium fades as Iran-US diplomatic contact resumes, normalising Brent toward the pre-event range. Energy outperformance narrows, gold stabilises, and rate-sensitive sectors recover. Scenario two: The premium becomes embedded if tanker incidents occur or a formal Hormuz restriction is announced. Energy and uranium outperformance extends, gold remains pressured, and the RBA’s July meeting becomes a live hike event.
The RBA is the critical domestic variable. A combination of sustained Brent above US$100 and a CPI upside surprise on 13 May would materially increase the probability of a July 2026 hike, with direct consequences for rate-sensitive ASX sectors including real estate and financials. The RBA cash rate sits at 4.35%, with July and August 2026 as the next risk windows.
China’s PPI at +2.8% year-on-year, exceeding the forecast by 130 basis points, provides an independent inflation signal that compounds the RBA risk even if oil prices moderate. Investors should track both variables separately.
The specific watch-list variables for the week:
The session on 11 May 2026 demonstrated that geopolitical commodity shocks do not produce uniform sector outcomes. They create simultaneous winners, losers, and speculative themes, each requiring a different analytical lens. The durable framework for investors: track the source catalyst (Hormuz diplomatic status), the primary commodity variable (Brent above or below US$100), the rate-expectations channel (RBA meeting calendar and CPI data), and the sector-specific secondary effects that determine which names lead and which absorb the cost.
Investors tracking the week’s data releases, including US CPI on 13 May and the Australian federal budget on 13 May, should monitor the ASX 200’s 8,621 support level as the technical indicator of whether the session’s broader market weakness extends or stabilises.
This article is for informational purposes only and should not be considered financial advice. Investors should conduct their own research and consult with financial professionals before making investment decisions. Past performance does not guarantee future results. Financial projections and forward-looking statements referenced are subject to market conditions and various risk factors.
A geopolitical event that threatens oil supply, such as a Strait of Hormuz disruption risk, causes Brent crude futures to spike, which lifts energy and uranium stocks while simultaneously pressuring gold, banks, and rate-sensitive sectors through higher inflation expectations.
Higher oil prices stoke inflation expectations, which in turn raise rate expectations and increase the opportunity cost of holding non-yielding gold; rising diesel and energy costs also create a direct margin headwind for gold producers, pushing gold equities lower.
Rising Brent crude increases Australian import and petrol costs, pushing trimmed mean CPI higher, which raises the probability of an RBA rate hike; on 11 May the RBA cash rate already sat at 4.35% following a 5 May hike, making markets acutely sensitive to any additional inflation signal.
Uranium benefited from both the energy security narrative activated by Hormuz risk and an independent supply crunch driven by Kazatomprom production cuts and growing nuclear buildout demand, with Boss Energy gaining 6.5% compared to Woodside's 1.5% gain.
Investors should monitor US April CPI, the Australian Wage Price Index, RBA forward guidance, and Brent crude relative to the US$100 per barrel level, as these variables determine whether the Hormuz risk premium persists and which ASX sectors continue to lead or lag.