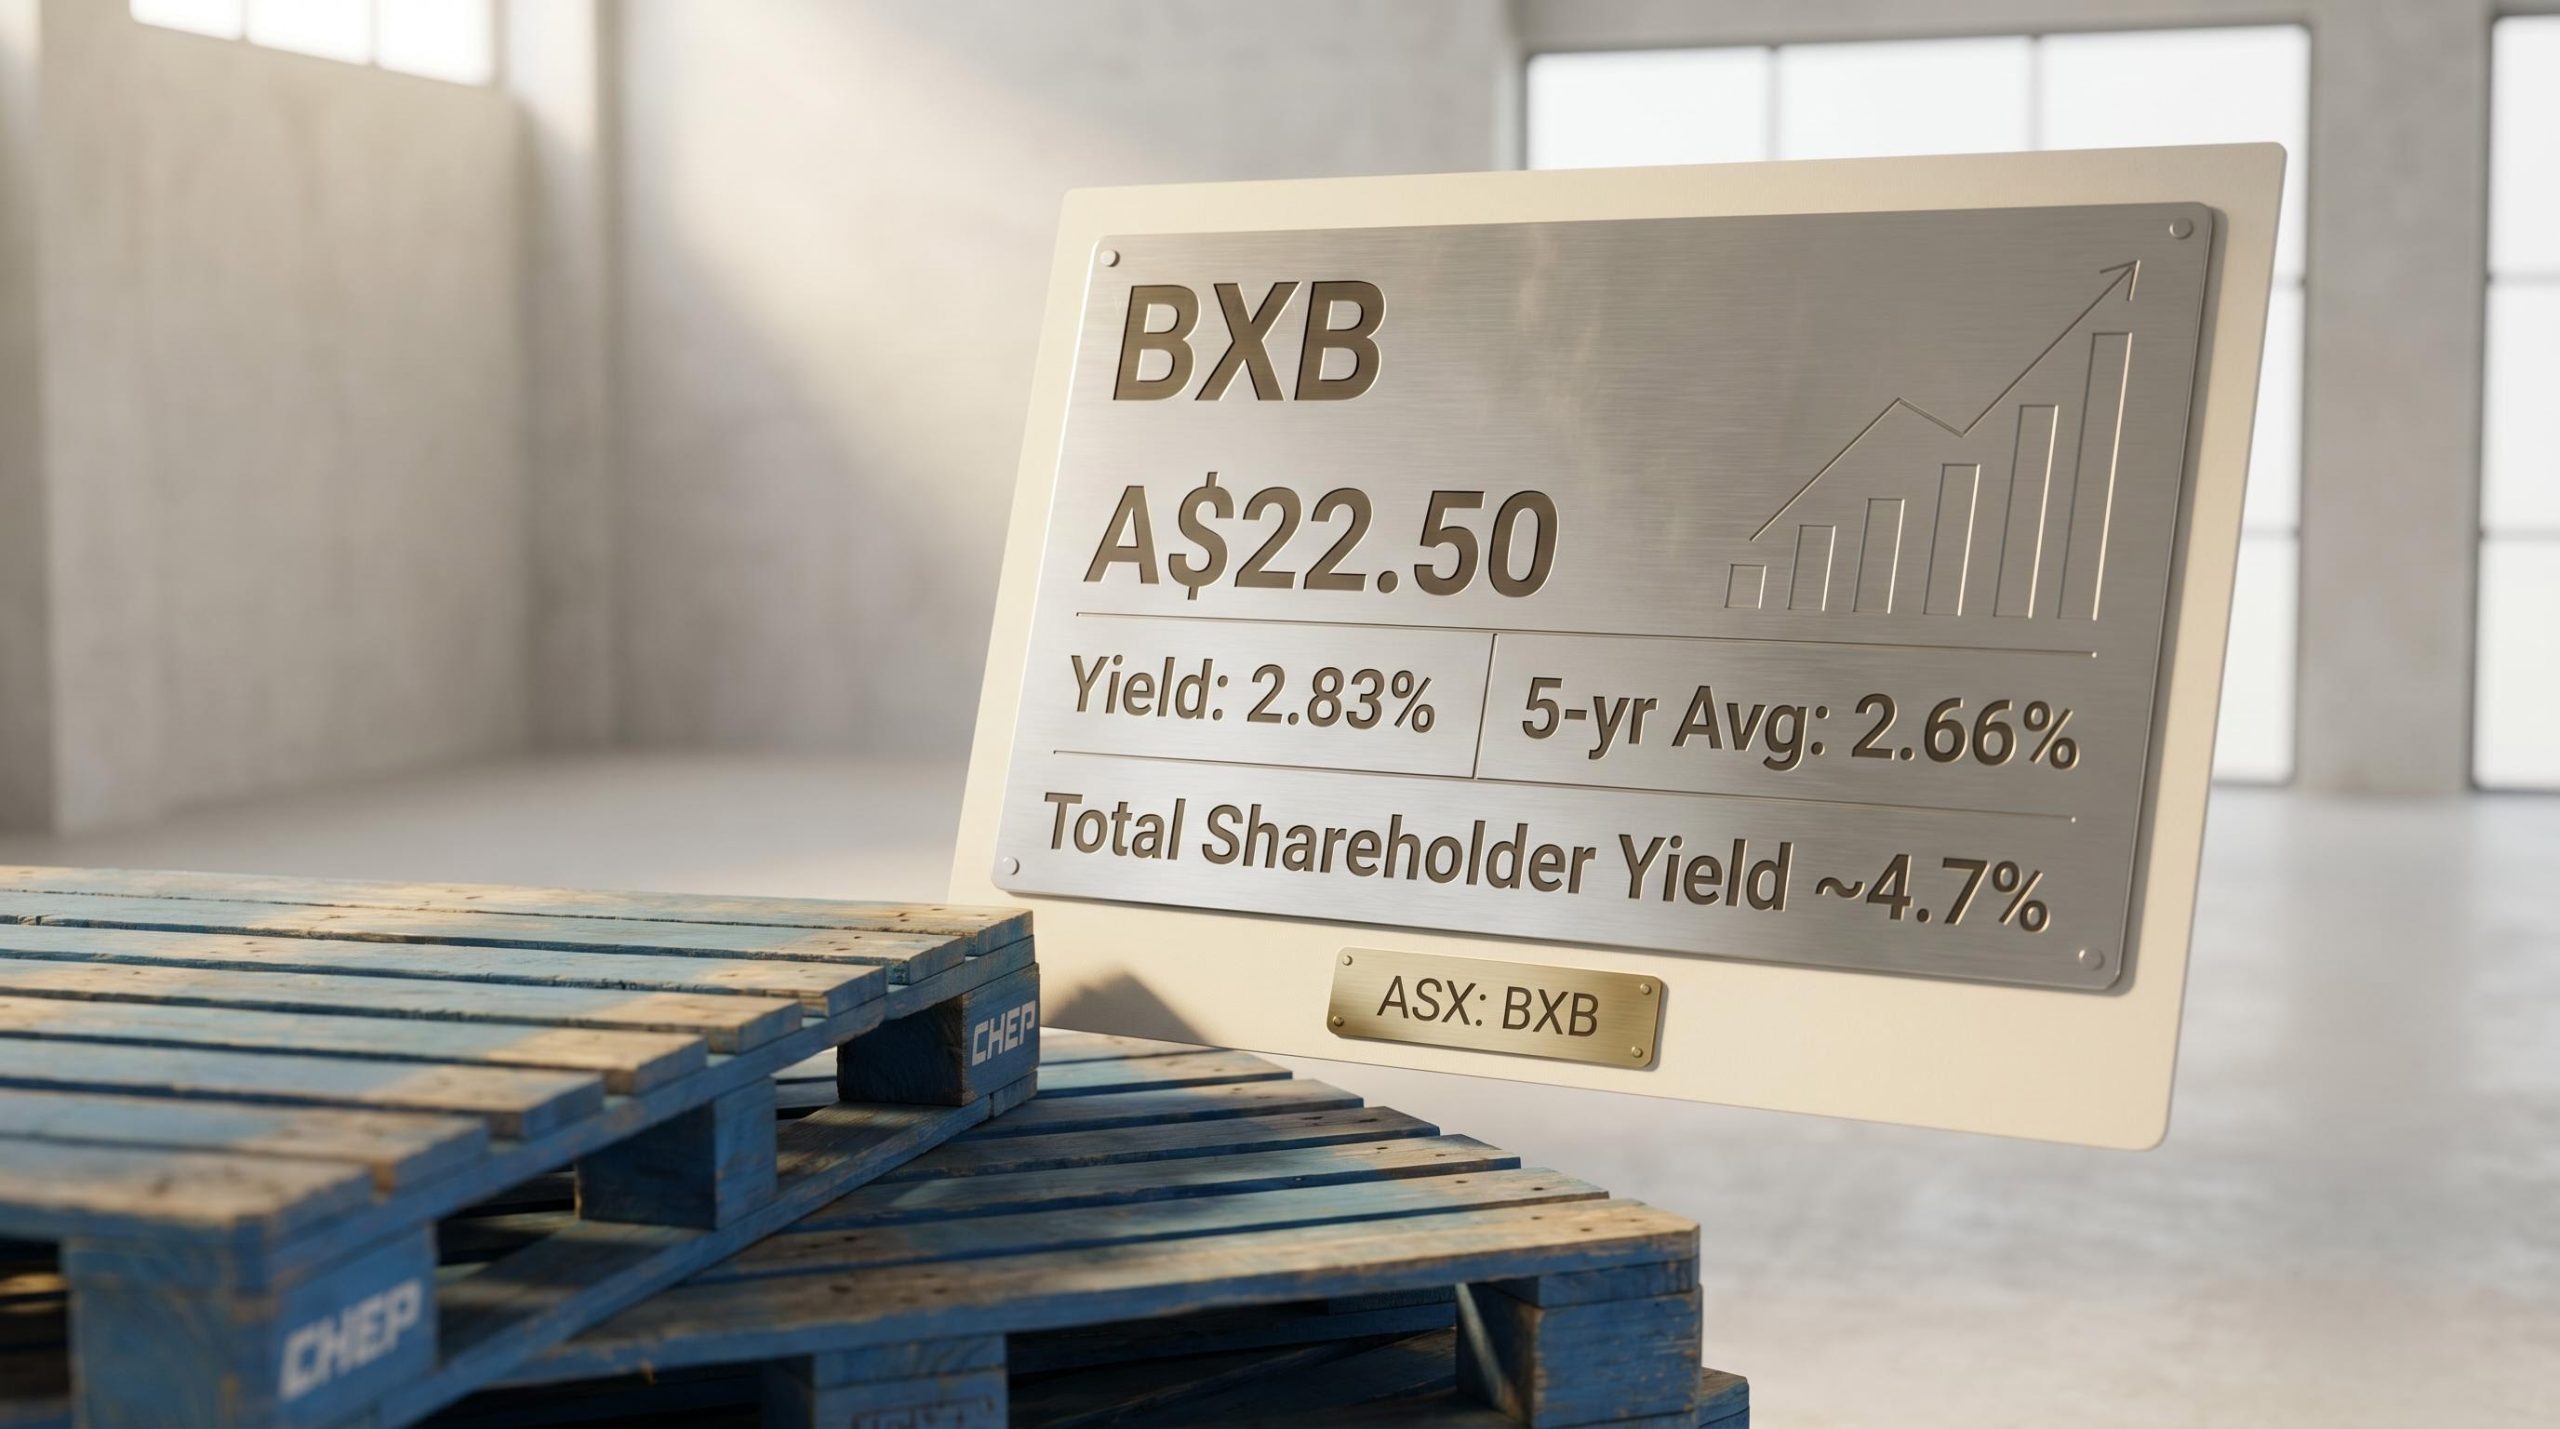
At roughly A$22.50, Brambles Limited (ASX: BXB) shares are yielding approximately 2.83%. That figure sits above the stock’s 5-year historical average yield of 2.66%, a relationship that has historically flagged better-than-usual value for income-focused investors. The share price has drifted modestly lower since early 2025, yet the underlying business has continued paying and growing dividends, shifting the yield calculation in buyers’ favour. For ASX investors screening quality industrials with a defensible income stream, that divergence between price softness and dividend consistency is precisely the kind of signal worth examining. What follows unpacks what the BXB share price yield signal actually means, explains the business mechanics behind dividend sustainability, walks through the risks that could disrupt the income case, and presents the total capital return picture beyond the headline yield number.
What the dividend yield signal is actually telling investors right now
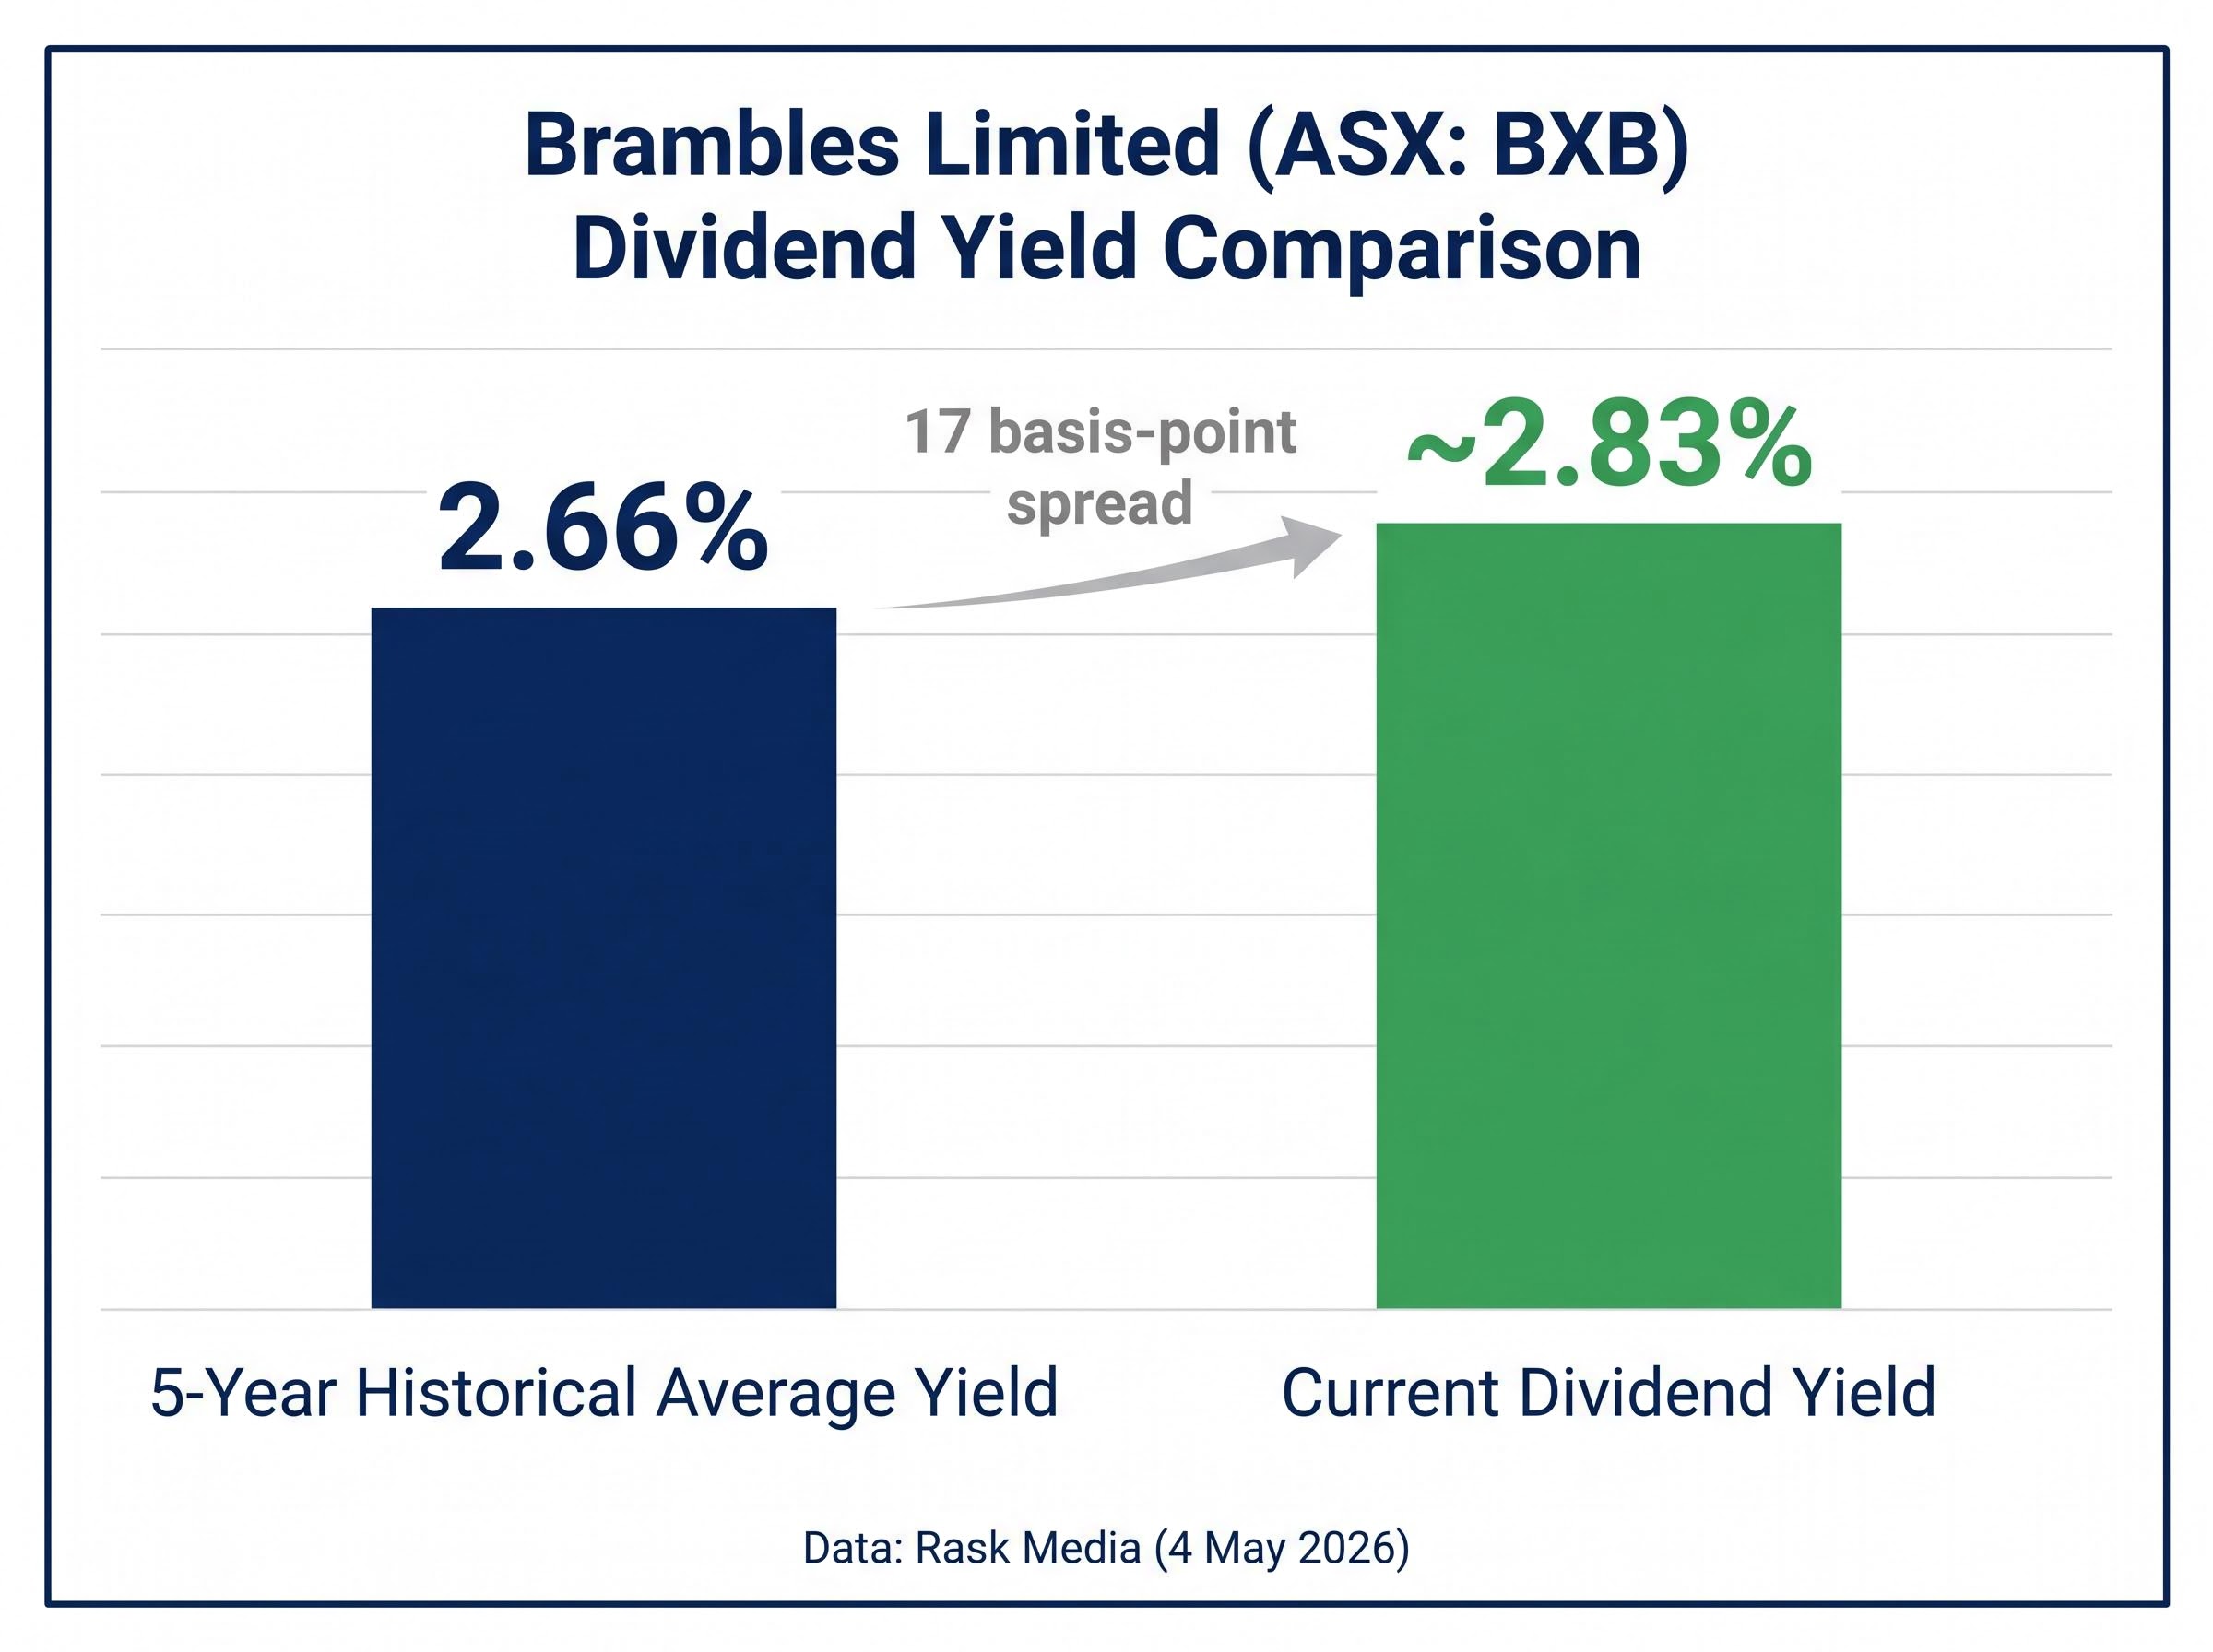
The numbers first. Brambles currently yields approximately 2.83% on a trailing annual dividend of roughly A$0.64 per share. The 5-year historical average, as reported by Rask Media on 4 May 2026, is 2.66%.
That 17 basis-point spread is not large in isolation. But yield comparisons to a stock’s own history carry a specific implication: when the current yield exceeds the average, the share price is trading below the level at which the market has historically been willing to hold the stock. Investors are getting more income per dollar invested than they have, on average, over the past five years.
A precise reading of dividend yield mechanics clarifies the core dynamic here: when a share price falls while the dividend remains constant, yield rises not because the company is becoming more generous but because investors are paying less per unit of income, a distinction that separates genuine value signals from value traps.
The driver is price, not dividends. BXB has been roughly flat to slightly negative year-to-date, with shares trading in the A$22.45-A$22.66 range as at 8-10 May 2026. The most recent interim dividend of A$0.3274, paid 9 April 2026 at 20% franking, confirmed the payout remains intact. Yield expanded because the share price softened, not because the income stream deteriorated.
At approximately 2.83%, BXB’s current yield sits above its 5-year average of 2.66%, a spread that suggests the share price has drifted below its historical income-value anchor.
| Metric | Value |
|---|---|
| Current dividend yield | ~2.83% |
| 5-year historical average yield | 2.66% |
| Total shareholder yield (Simply Wall St) | ~4.7% |
When big ASX news breaks, our subscribers know first
How Brambles actually makes money, and why that matters for dividend reliability
A yield signal is only as useful as the income stream behind it. For Brambles, that income stream originates from one of the most structurally recurring revenue models on the ASX.
How the CHEP hire model generates recurring cash
Brambles operates the world’s largest reusable pallet, crate, and container pooling business under the CHEP brand. The model works by charging manufacturers and retailers a daily hire fee at each point in the supply chain where a pallet is in use. Revenue does not depend on a single transaction or customer cycle. It accrues continuously as pallets circulate through logistics networks across APAC, the Americas, and EMEA.
The structural implication for dividend reliability is direct. Recurring hire fee revenue, generated by physical assets moving through supply chains every day, produces predictable cash flows at scale. Switching costs are high; replacing a pooling arrangement requires renegotiating logistics across an entire supply chain. This is not lumpy project income or cyclical commodity revenue. It is a daily-fee model with contractual stickiness, and it is what funds consistent dividend payments over time.
Unpacking BXB’s dividend: payout ratio, franking credits, and what the numbers confirm
Start with the payout ratio. Brambles’ H1 FY26 interim dividend represented a payout of approximately 60.5% of Underlying Profit, confirmed in the company’s 1H26 results. That sits squarely within the stated 50-70% policy range introduced from FY24 onward. There is headroom in both directions before the income case is threatened.
| Period | Dividend per share | Franking | Pay date |
|---|---|---|---|
| H1 FY25 (interim) | A$0.3027 | 30% | 10 April 2025 |
| H2 FY25 (final) | A$0.3196 | 30% | 8 October 2025 |
| H1 FY26 (interim) | A$0.3274 | 20% | 9 April 2026 |
For Australian retail investors, particularly those holding through self-managed super funds, the franking credit detail matters. The most recent interim dividend carried 20% franking, down from 30% on the prior two payments. Partial franking still adds after-tax value for investors with refundable franking credit entitlements, though the trend warrants monitoring.
For SMSF trustees in pension phase wanting to model the precise after-tax value of partially franked dividends, our full explainer on franking credit calculations for SMSFs walks through the grossed-up dividend formula with worked examples for common retirement income structures, including the scenarios where a 20% franked dividend still generates a refundable credit offset.
The growth trajectory adds further context. Year-on-year dividend growth came in at approximately 2.44%, while Simply Wall St’s forward estimates point to roughly 6.7% per annum growth ahead. Over the longer term, Alpha Spread data shows dividends per share have increased 271% across five years.
271% growth in dividends per share over five years. The payout ratio of 60.5% confirms the dividend is not being stretched to achieve it.
A payout ratio comfortably within policy range, supported by a growth trajectory that is accelerating rather than decelerating, confirms the income stream is being funded sustainably rather than manufactured through unsustainable distributions.
The risks that could disrupt the income case
Three specific mechanisms could erode Brambles’ dividend capacity, and each deserves its full weight rather than a passing mention.
- Currency risk: Brambles reports in USD but pays AUD dividends. The H1 FY26 interim dividend was equivalent to approximately US$0.23 per share, illustrating the translation layer. A materially stronger Australian dollar compresses the AUD value of overseas earnings and could reduce future dividend capacity in local currency terms, regardless of operational performance.
- Competitive pressure: Alternative pallet formats, including plastic pallets and one-way options, along with regional pooling operators, create pricing pressure in certain geographies. If sustained, margin erosion would flow through to the earnings base that funds the dividend.
- Earnings-linked payout risk: Unlike a fixed dividend policy, the 50-70% payout ratio ties dividend quantum directly to Underlying Profit. Any material earnings decline does not merely threaten the dividend; it mechanically reduces it. The buffer within the range provides some cushion, but it is not unlimited.
Supply chain disruption and geopolitical volatility add a further layer of operational demand risk. Brambles’ revenue depends on global trade flows continuing to move goods through its logistics networks. Sustained disruption to those flows would compress the earnings that the payout ratio is applied to.
The class action judgment handed down on 10 April 2026 adds a further layer of uncertainty not captured in the operational risk factors above: while the Federal Court dismissed the majority of claims, liability was upheld for a narrow two-month window in late 2016, leaving the total financial impact unquantified pending the damages process and any potential appeal.
Beyond the dividend: what total shareholder return adds to the valuation picture
The headline yield of 2.83% understates the full capital return that Brambles is delivering to shareholders.
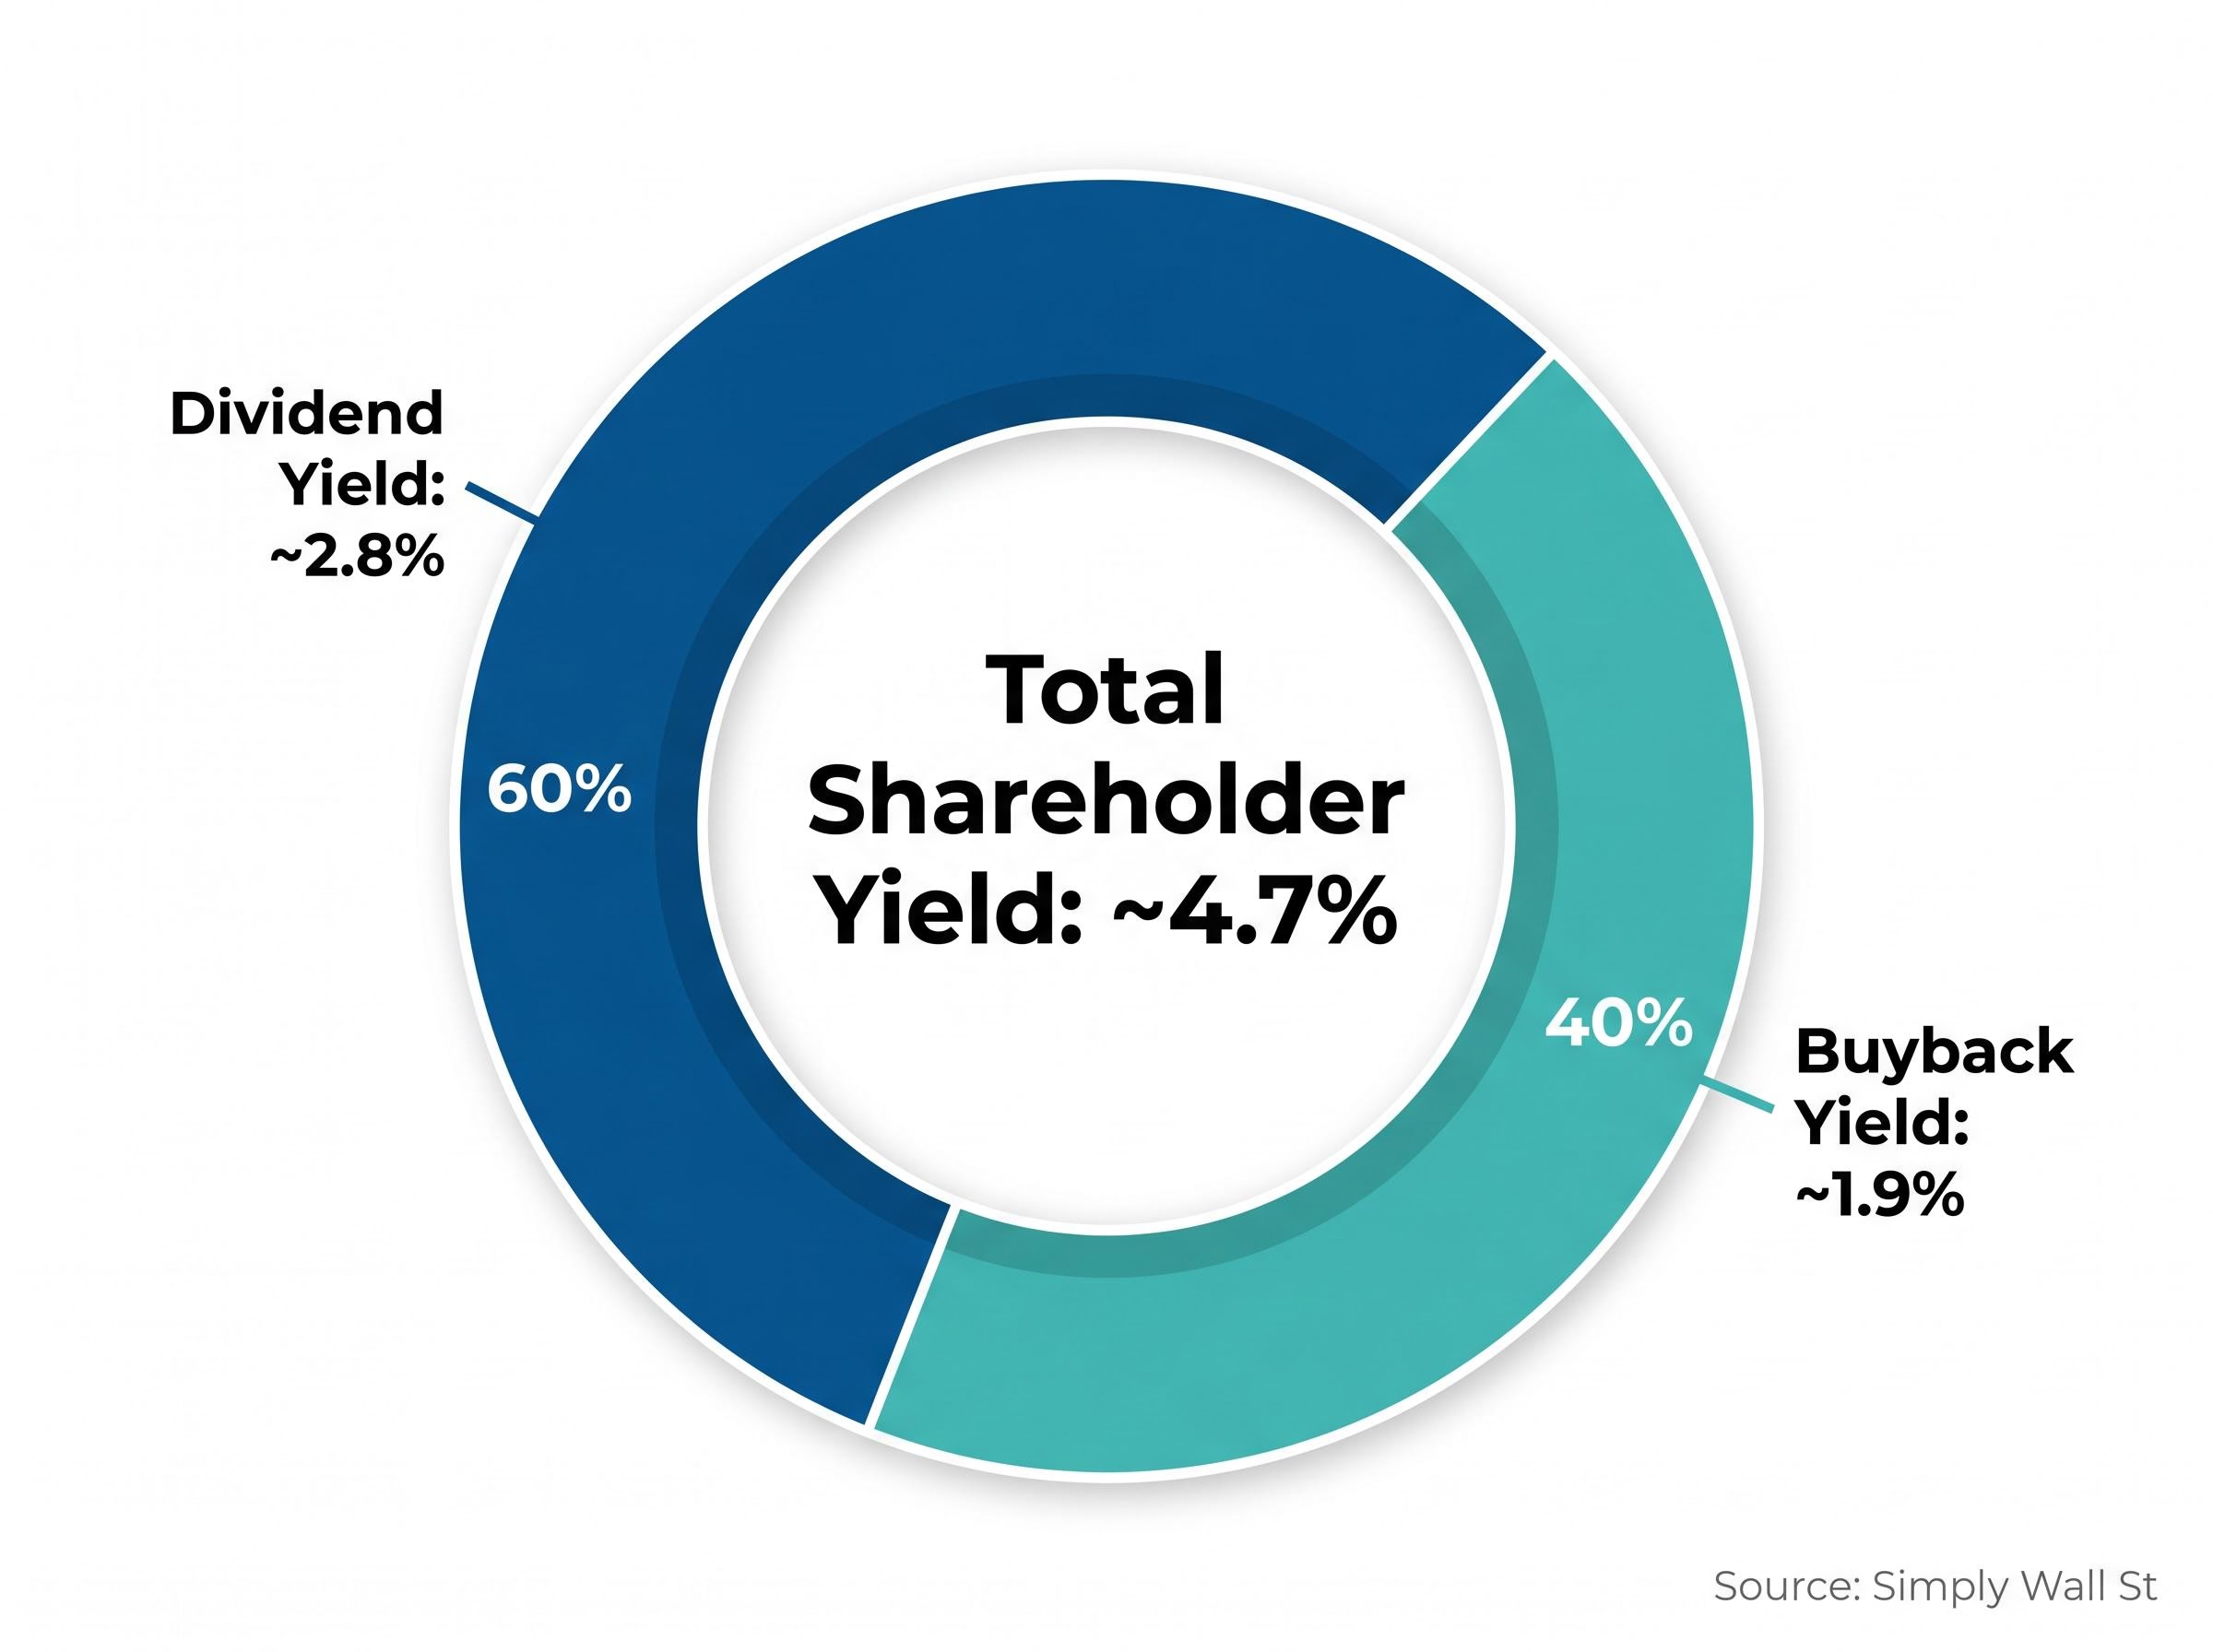
Simply Wall St estimates a total shareholder yield of approximately 4.7%, comprising roughly 2.8% from dividends and approximately 1.9% from ongoing share buyback activity. Buybacks reduce the share count over time, increasing each remaining shareholder’s claim on future earnings and dividends.
The capital appreciation component adds a further layer. Consensus analyst price targets sit at A$24.81-A$26.01 on average, with a high target of A$29.02. Simply Wall St’s independent DCF-based valuation arrives at A$25.84-A$26.06, closely aligning with the broker consensus. From a current price of approximately A$22.50, the midpoint of the consensus range implies 10-16% capital upside.
- Dividend yield: approximately 2.8%
- Buyback yield: approximately 1.9%
- Potential capital appreciation to consensus midpoint: 10-16%
Simply Wall St estimates BXB’s total shareholder yield at approximately 4.7% when share buybacks are factored alongside the dividend, materially above the headline income yield.
Liquidity supports the thesis at retail scale. Average daily volume of approximately 3 million shares and a market capitalisation of roughly A$30.26 billion mean position sizing and exit are unlikely to present execution challenges for individual investors.
Yield as a screening signal, not a verdict: how to use this data properly
A yield above its historical average is a screening tool, not a buy signal. It identifies candidates for closer examination. The distinction matters for how investors act on the data presented in this article.
Yield can rise for two reasons: a falling share price or a rising dividend. The first may indicate deterioration; the second is unambiguously positive. In Brambles’ case, the evidence points to price softness alongside continued dividend growth. The payout ratio of approximately 60.5% confirms the dividend is not the source of yield expansion. The price is.
Constructing a durable ASX dividend income portfolio requires screening not just for yield level but for the conditions under which yield has risen, because a payout ratio still within policy range is meaningfully different from one that has been stretched to sustain distributions through an earnings downturn.
- Identify whether yield is above the historical average (in BXB’s case, 2.83% versus the 5-year average of 2.66%).
- Determine whether a price decline or dividend growth is the dominant driver.
- Run supplementary valuation models, such as discounted cash flow or dividend discount modelling, before making an investment decision.
When yield signals can mislead
Rask Media’s analysis noted that simple valuation ratios should be supplemented with comprehensive approaches such as DCF and Dividend Discount Models. A yield above average can reflect a structural de-rating rather than a temporary dip; investors who rely solely on yield comparisons risk confusing value with a value trap. The screening signal opens the door. The deeper analysis is what determines whether the opportunity behind it is genuine.
BXB’s income case in context: what patient investors are looking at in May 2026
The investment picture as it stands in May 2026 presents a specific combination of factors:
- Current yield of approximately 2.83%, above the 5-year historical average of 2.66%
- Payout ratio of 60.5%, comfortably within the stated 50-70% policy range
- Total shareholder yield of approximately 4.7% when buybacks are included
- Analyst consensus price targets of A$24.81-A$26.01, implying double-digit capital upside
- A recurring-revenue business model with high switching costs and global diversification
The conditions under which this case weakens are equally specific:
- A materially stronger Australian dollar compressing translated earnings
- An earnings decline that mechanically reduces the payout through the ratio-linked policy
- Sustained loss of market share to alternative pallet formats eroding the margin base
The profile suits patient, income-oriented ASX investors with a medium-to-long term horizon who are comfortable with partial franking rather than fully franked income. The data presented here does not constitute a recommendation; it provides the specific figures, risk factors, and analytical framework for investors to form their own view on whether Brambles represents a credible entry point at current prices.
This article is for informational purposes only and should not be considered financial advice. Investors should conduct their own research and consult with financial professionals before making investment decisions. Past performance does not guarantee future results. Financial projections are subject to market conditions and various risk factors.