
Why a BoJ Rate Hike Hasn’t Stopped the Yen Carry Trade
2 hrs ago

Bank of Queensland shares closed at $6.34 on 10 May 2026, yet a straightforward Dividend Discount Model produces a base fair value estimate of $7.19 and a franking-adjusted estimate of $10.57. That gap is not an anomaly. It is a direct consequence of which inputs an investor selects and how Australia’s unique dividend imputation system is treated within the model. With the RBA cash rate now sitting at 4.35% following the 25 basis point increase on 5 May 2026, the cost of equity for Australian bank stocks has shifted materially, and the discount rates retail investors used two or three years ago produce systematically different valuations today. BOQ, as a fully franked ASX regional bank with a publicly disclosed Common Equity Tier 1 (CET1) ratio of 11.18% and a recently confirmed dividend, provides an ideal live case study for working through every DDM input from scratch. This guide walks through each assumption using BOQ’s actual published figures, explains where Australian-specific adjustments apply, and concludes with a replicable framework readers can adapt for CBA, NAB, Westpac, and ANZ.
At its simplest, the Dividend Discount Model treats a share as a claim on a stream of future income. The price an investor should pay today equals the present value of every dividend that share is expected to generate, discounted back at the rate of return the investor requires to hold it. If the dividend stream is predictable, the model works well. If it is erratic or non-existent, the model breaks down.
The origins of the dividend discount model trace back to John Burr Williams, who formalised the present-value-of-dividends framework in 1938 as a direct intellectual response to the speculative pricing that preceded the 1929 crash; the core discipline he established, that investment value derives from income yield rather than resale price, is precisely what makes the Gordon Growth Model appropriate for a regulated, dividend-paying regional bank like BOQ.
This guide uses a specific DDM variant known as the Gordon Growth Model:
P = D1 / (r – g)
P = estimated fair value per share D1 = forecast annual dividend per share (next year) r = required rate of return (cost of equity) g = expected long-term dividend growth rate
Banks are particularly well suited to this approach. BOQ’s lending-derived income represents approximately 93% of total revenue, providing the kind of earnings predictability that underpins a reliable dividend forecast. According to KPMG’s half-year 2026 analysis, Australian major banks currently average payout ratios of approximately 78.5%, confirming that dividend distributions are structural features of the sector, not discretionary one-offs.
The distinction matters when choosing a valuation tool:
Growth stocks that retain all earnings and reinvest for expansion offer no dividend stream to discount. A regional bank paying fully franked dividends from a regulated balance sheet offers precisely the income certainty the model requires.
The discount rate is the single most common source of error in retail DDM models. Building it from its components, one layer at a time, removes much of the guesswork.
The starting point is the risk-free rate. As of 10 May 2026, the RBA cash rate target stands at 4.35%, following a 25 basis point increase on 5 May 2026. This rate represents the theoretical return an investor could earn with zero risk, and it anchors the entire cost-of-equity calculation.
The second layer is the equity risk premium (ERP), the additional return investors require for holding equities rather than risk-free assets. For Australian bank stocks, this premium typically sits in the 5-6% range, reflecting both systemic market risk and sector-specific exposures such as credit cycle sensitivity and regulatory capital requirements.
Beta measures how sensitive a stock’s returns are to the broader market. For the Big Four banks, betas generally sit close to 1.0 because their size, diversification, and market weighting mean they effectively move with the index. BOQ, as a regional bank with a narrower geographic footprint and less product diversification, carries higher earnings concentration risk. A beta range of 1.0-1.2 is appropriate for BOQ in a CAPM framework.
Investors who apply a beta of 1.0 (as commonly used for CBA) to BOQ may be underpricing the required return and, consequently, overstating fair value.
The assembled CAPM inputs produce the following cost-of-equity range:
| Component | Low Estimate | High Estimate |
|---|---|---|
| Risk-Free Rate | 4.35% | 4.35% |
| Equity Risk Premium | 5.0% | 6.0% |
| Beta | 1.0 | 1.2 |
| Resulting Cost of Equity | 9.35% | 11.55% |
Readers who last modelled Australian bank stocks in 2021 using a 6-7% discount rate will find that the current rate environment compresses DDM valuations considerably. The cost-of-equity range has widened, and the risk-free rate alone has nearly doubled relative to pre-2022 levels.
Most DDM tutorials available online are built for US markets, where dividends carry no imputation credits. In Australia, the treatment of franking credits is one of the most consequential assumptions in any bank valuation model.
Fully franked dividends, such as those paid by BOQ, come with attached tax credits. These credits represent corporate tax already paid by the company, and eligible Australian resident investors can use them to offset their personal tax liability. The economic value of a fully franked dividend therefore exceeds its cash amount because the tax credit delivers additional value at tax time.
There are two approaches to incorporating franking credits into a DDM:
The choice between these methods produces dramatically different fair value estimates. According to analysis published by Rask Media on 4 May 2026, BOQ’s DDM base-case fair value (without franking adjustment) is $7.19 per share, while the franking-adjusted estimate is $10.57 per share.
| Scenario | D1 Input | Fair Value Estimate | Premium to $6.34 Price |
|---|---|---|---|
| Cash Dividend Only | $0.35 | $7.19 | 13.4% |
| Grossed-Up Dividend | $0.5005 ($0.35 x 1.43) | $10.57 | 66.7% |
The gap between these two estimates, $3.38 per share or approximately 47% of the base-case value, illustrates why this single assumption matters so much for Australian investors.
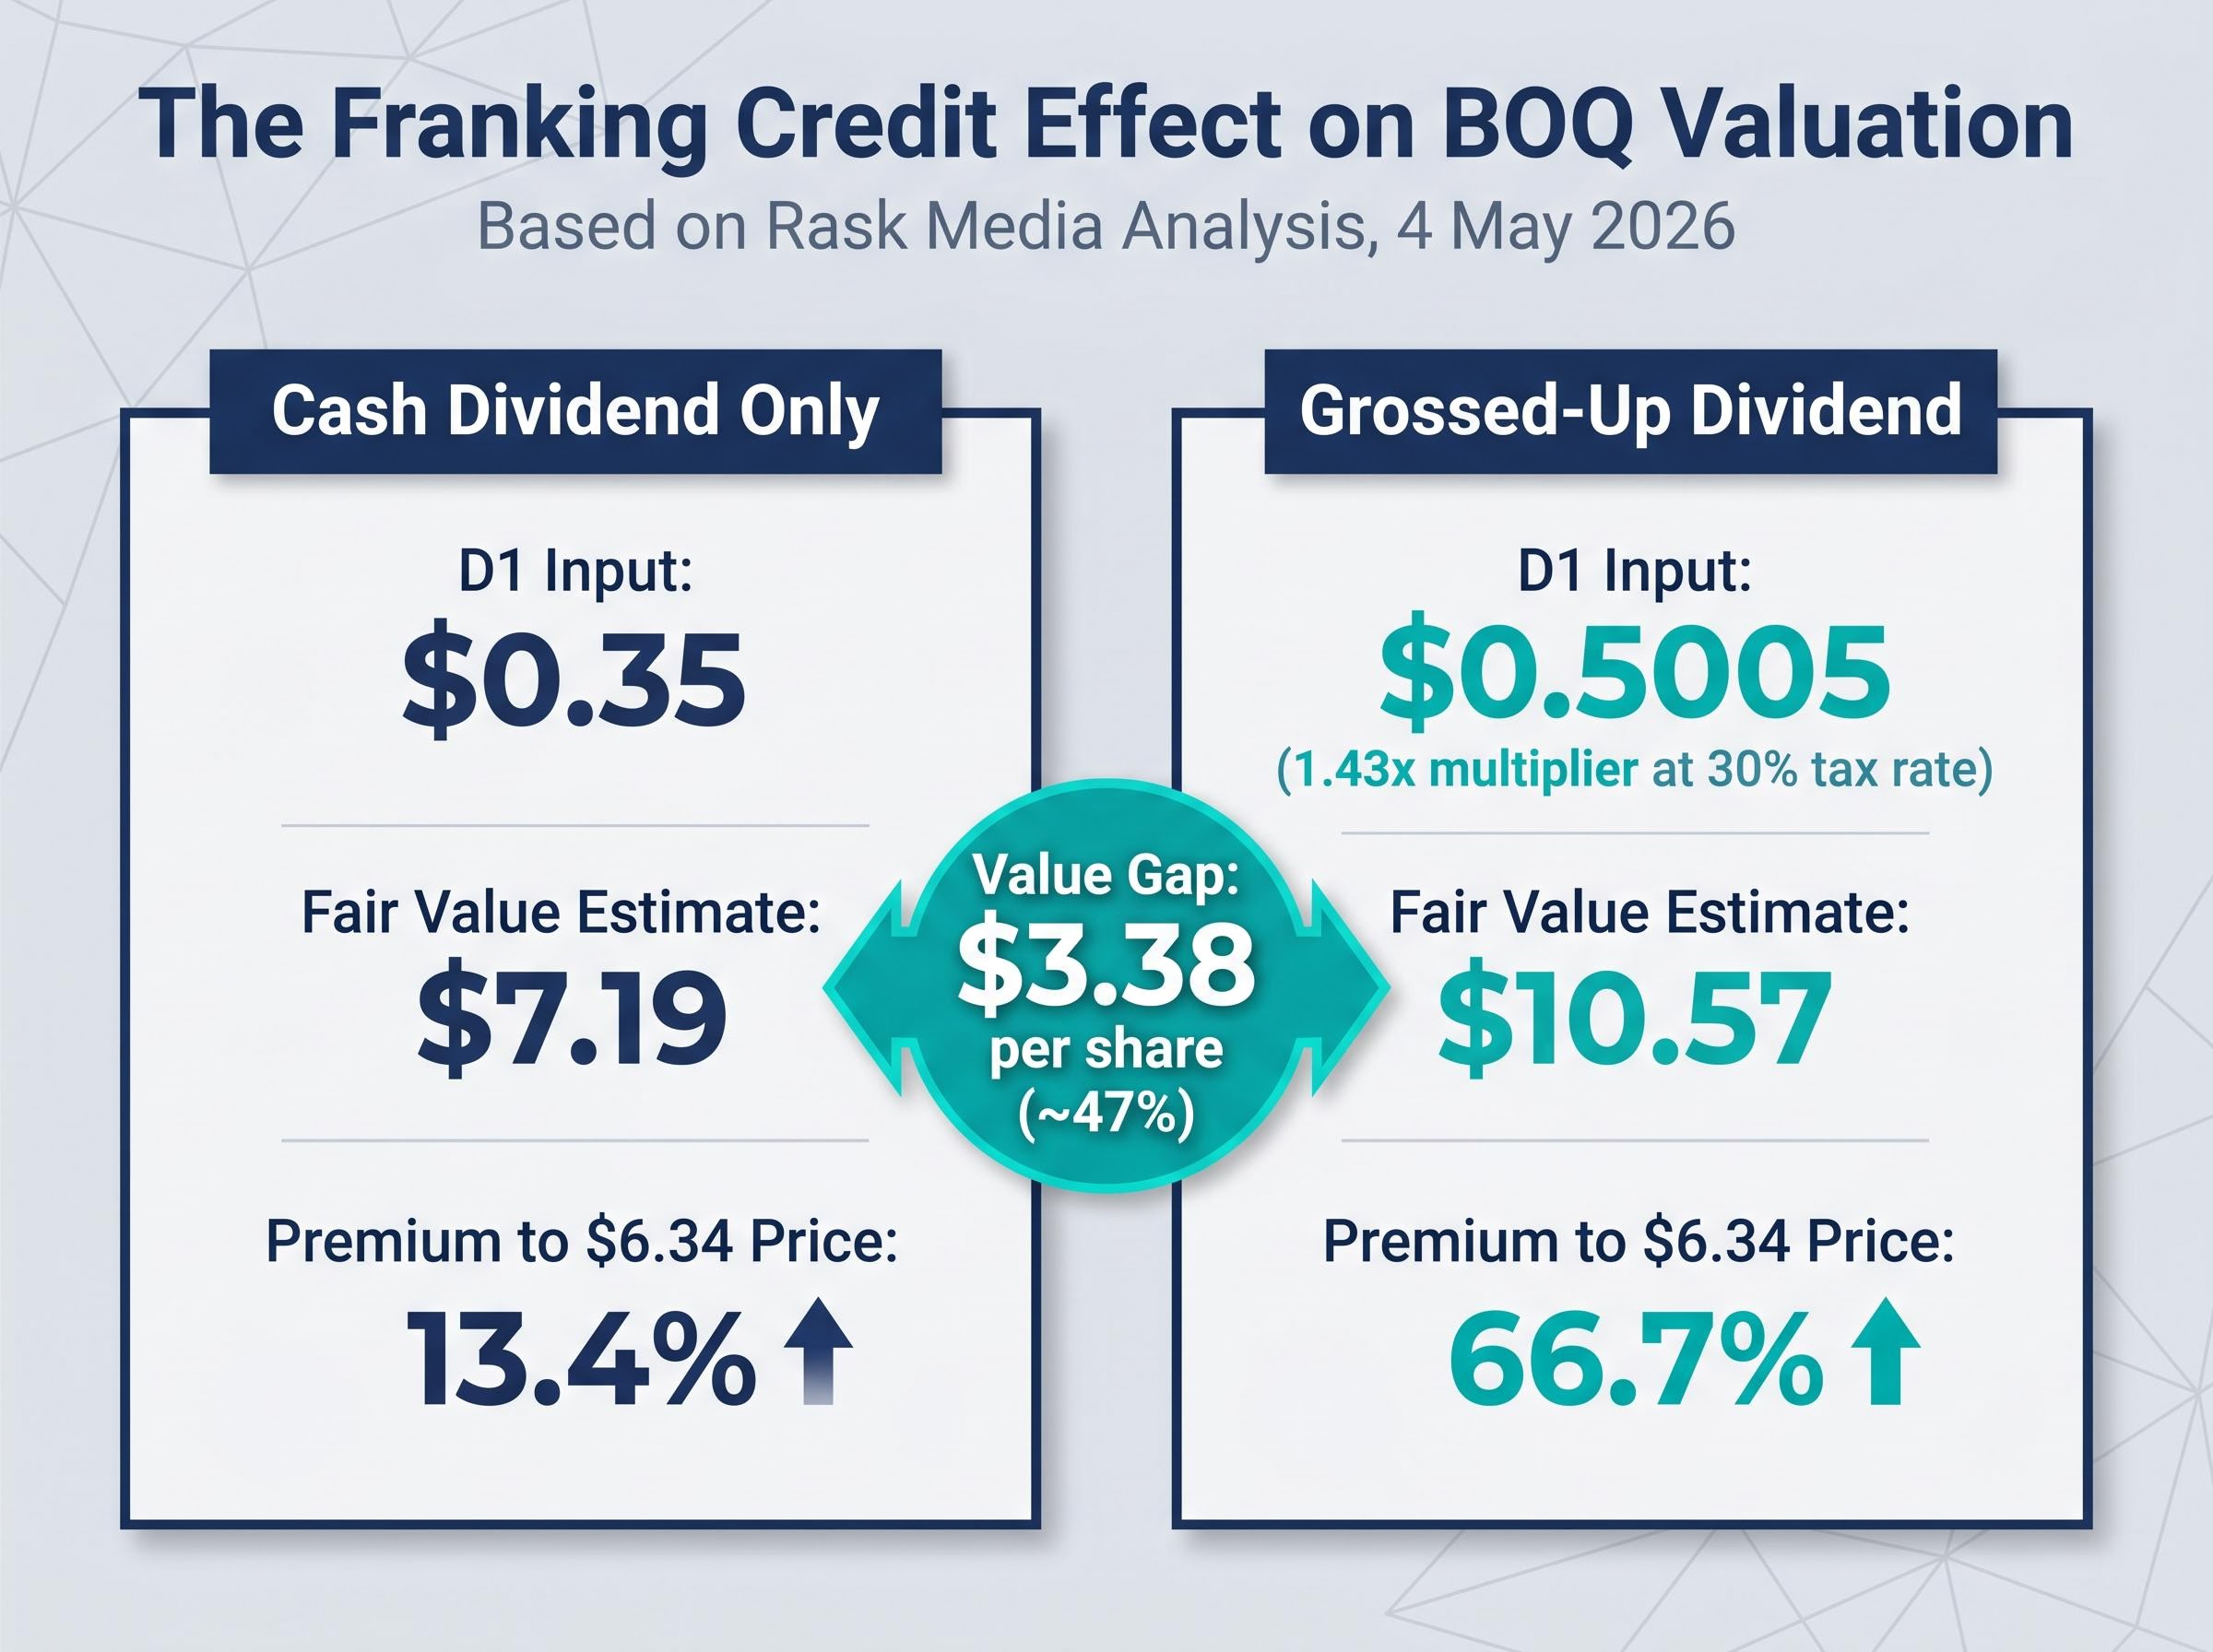
“The $7.19 to $10.57 range is not a forecasting disagreement. It is the same model, the same dividend, the same discount rate, and a single decision about franking credit treatment.”
Whichever approach investors choose, consistency is what matters. Mixing a grossed-up dividend with a post-tax discount rate, or vice versa, produces a mathematically incoherent output.
A DDM is only as reliable as the dividend assumptions that feed it. For banks, those assumptions must be tested against the balance sheet’s capacity to support distributions.
The binding constraint is the CET1 ratio, the measure of a bank’s core equity capital relative to its risk-weighted assets. A bank cannot distribute dividends if doing so would push CET1 below the minimum set by the Australian Prudential Regulation Authority (APRA). The analytical framework is sequential:
BOQ’s position as of the half-year ended February 2026 is supportive. The CET1 ratio of 11.18% sits above management’s target range of 10.25-10.75% by approximately 43 basis points. This buffer indicates meaningful headroom for maintaining or growing the dividend.
The dividend inputs used in the BOQ model reflect this capital position:
The distinction between dividend growth that is supported by capital headroom and growth that is constrained by capital pressure matters for the model’s credibility:
BOQ currently sits in the first category. Investors who skip this check and plug in optimistic growth rates risk producing fair value estimates the bank’s own balance sheet cannot sustain.
A single DDM output is a point estimate. Without context, it is misleading. The real value of the model emerges when multiple input combinations are tested side by side.
The following sensitivity grid shows estimated fair value for BOQ shares across a range of discount rate and dividend growth rate assumptions, using a D1 of $0.35 and the Gordon Growth Model formula, before franking adjustment:
| Growth Rate \ Discount Rate | 7% | 9% | 11% |
|---|---|---|---|
| 2% | $7.00 | $5.00 | $3.89 |
| 3% | $8.75 | $5.83 | $4.38 |
| 4% | $11.67 | $7.00 | $5.00 |
Note: franking-adjusted values would be approximately 43% higher at each cell.
The numbers are instructive. At a 9% discount rate and 3% growth, the model produces approximately $5.83. At 8% and 3%, approximately $8.75. A two-percentage-point shift in the discount rate moves estimated fair value by more than $3 per share. The discount rate, driven by the rate environment and beta choice, has a larger compressing effect on valuation than the growth rate assumption, which is counterintuitive to many retail investors.
Macro assumptions in ASX bank valuations can produce a valuation range for the same stock as wide as $19.00 to $85.50 per share, not from arithmetic errors but from legitimately different views on RBA rate trajectories, employment, and property prices, which is why the sensitivity grid in this article is a floor for analytical rigour rather than a ceiling.
The terminal growth rate represents what an investor believes a bank’s dividends will grow at indefinitely. This makes it the most consequential long-run assumption in the model.
Three reference points anchor the range for Australian banks:
“A terminal growth rate above 2.5% for an Australian regional bank requires explicit justification. Long-run GDP growth of 2.0% is the more defensible ceiling.”
Growth assumptions exceeding long-run nominal GDP growth in a terminal calculation represent a common retail modelling error. A mature regional bank operating in an economy forecast to grow at 2.0% annually cannot sustainably grow dividends faster than the economy it serves, at least not without a structural shift in market share or profitability that the model should account for explicitly.
The BOQ walkthrough is a training exercise. The real value lies in its portability across the ASX banking sector.
Four inputs transfer directly to any fully franked Australian bank DDM: the risk-free rate (identical for all), the equity risk premium plus beta (bank-specific), the CET1 check for dividend sustainability (bank-specific), and the franking credit treatment (consistent methodology). What changes between banks is the calibration of each input.
Replicating the framework requires four steps:
The key calibration differences between BOQ and the majors are quantifiable:
| Input | BOQ (Regional) | Major Banks (Indicative) | Notes |
|---|---|---|---|
| Beta | 1.0-1.2 | ~1.0 | Regional banks carry higher earnings concentration risk |
| NIM | 1.56% | 1.78% | Lower NIM constrains earnings growth assumptions |
| ROE | 4.7% | ~9.35% | Informs sustainable growth rate (g) in Gordon model |
| Payout Ratio | Within 60-78.5% range | Similar range | Check against CET1 buffer before assuming sustainability |
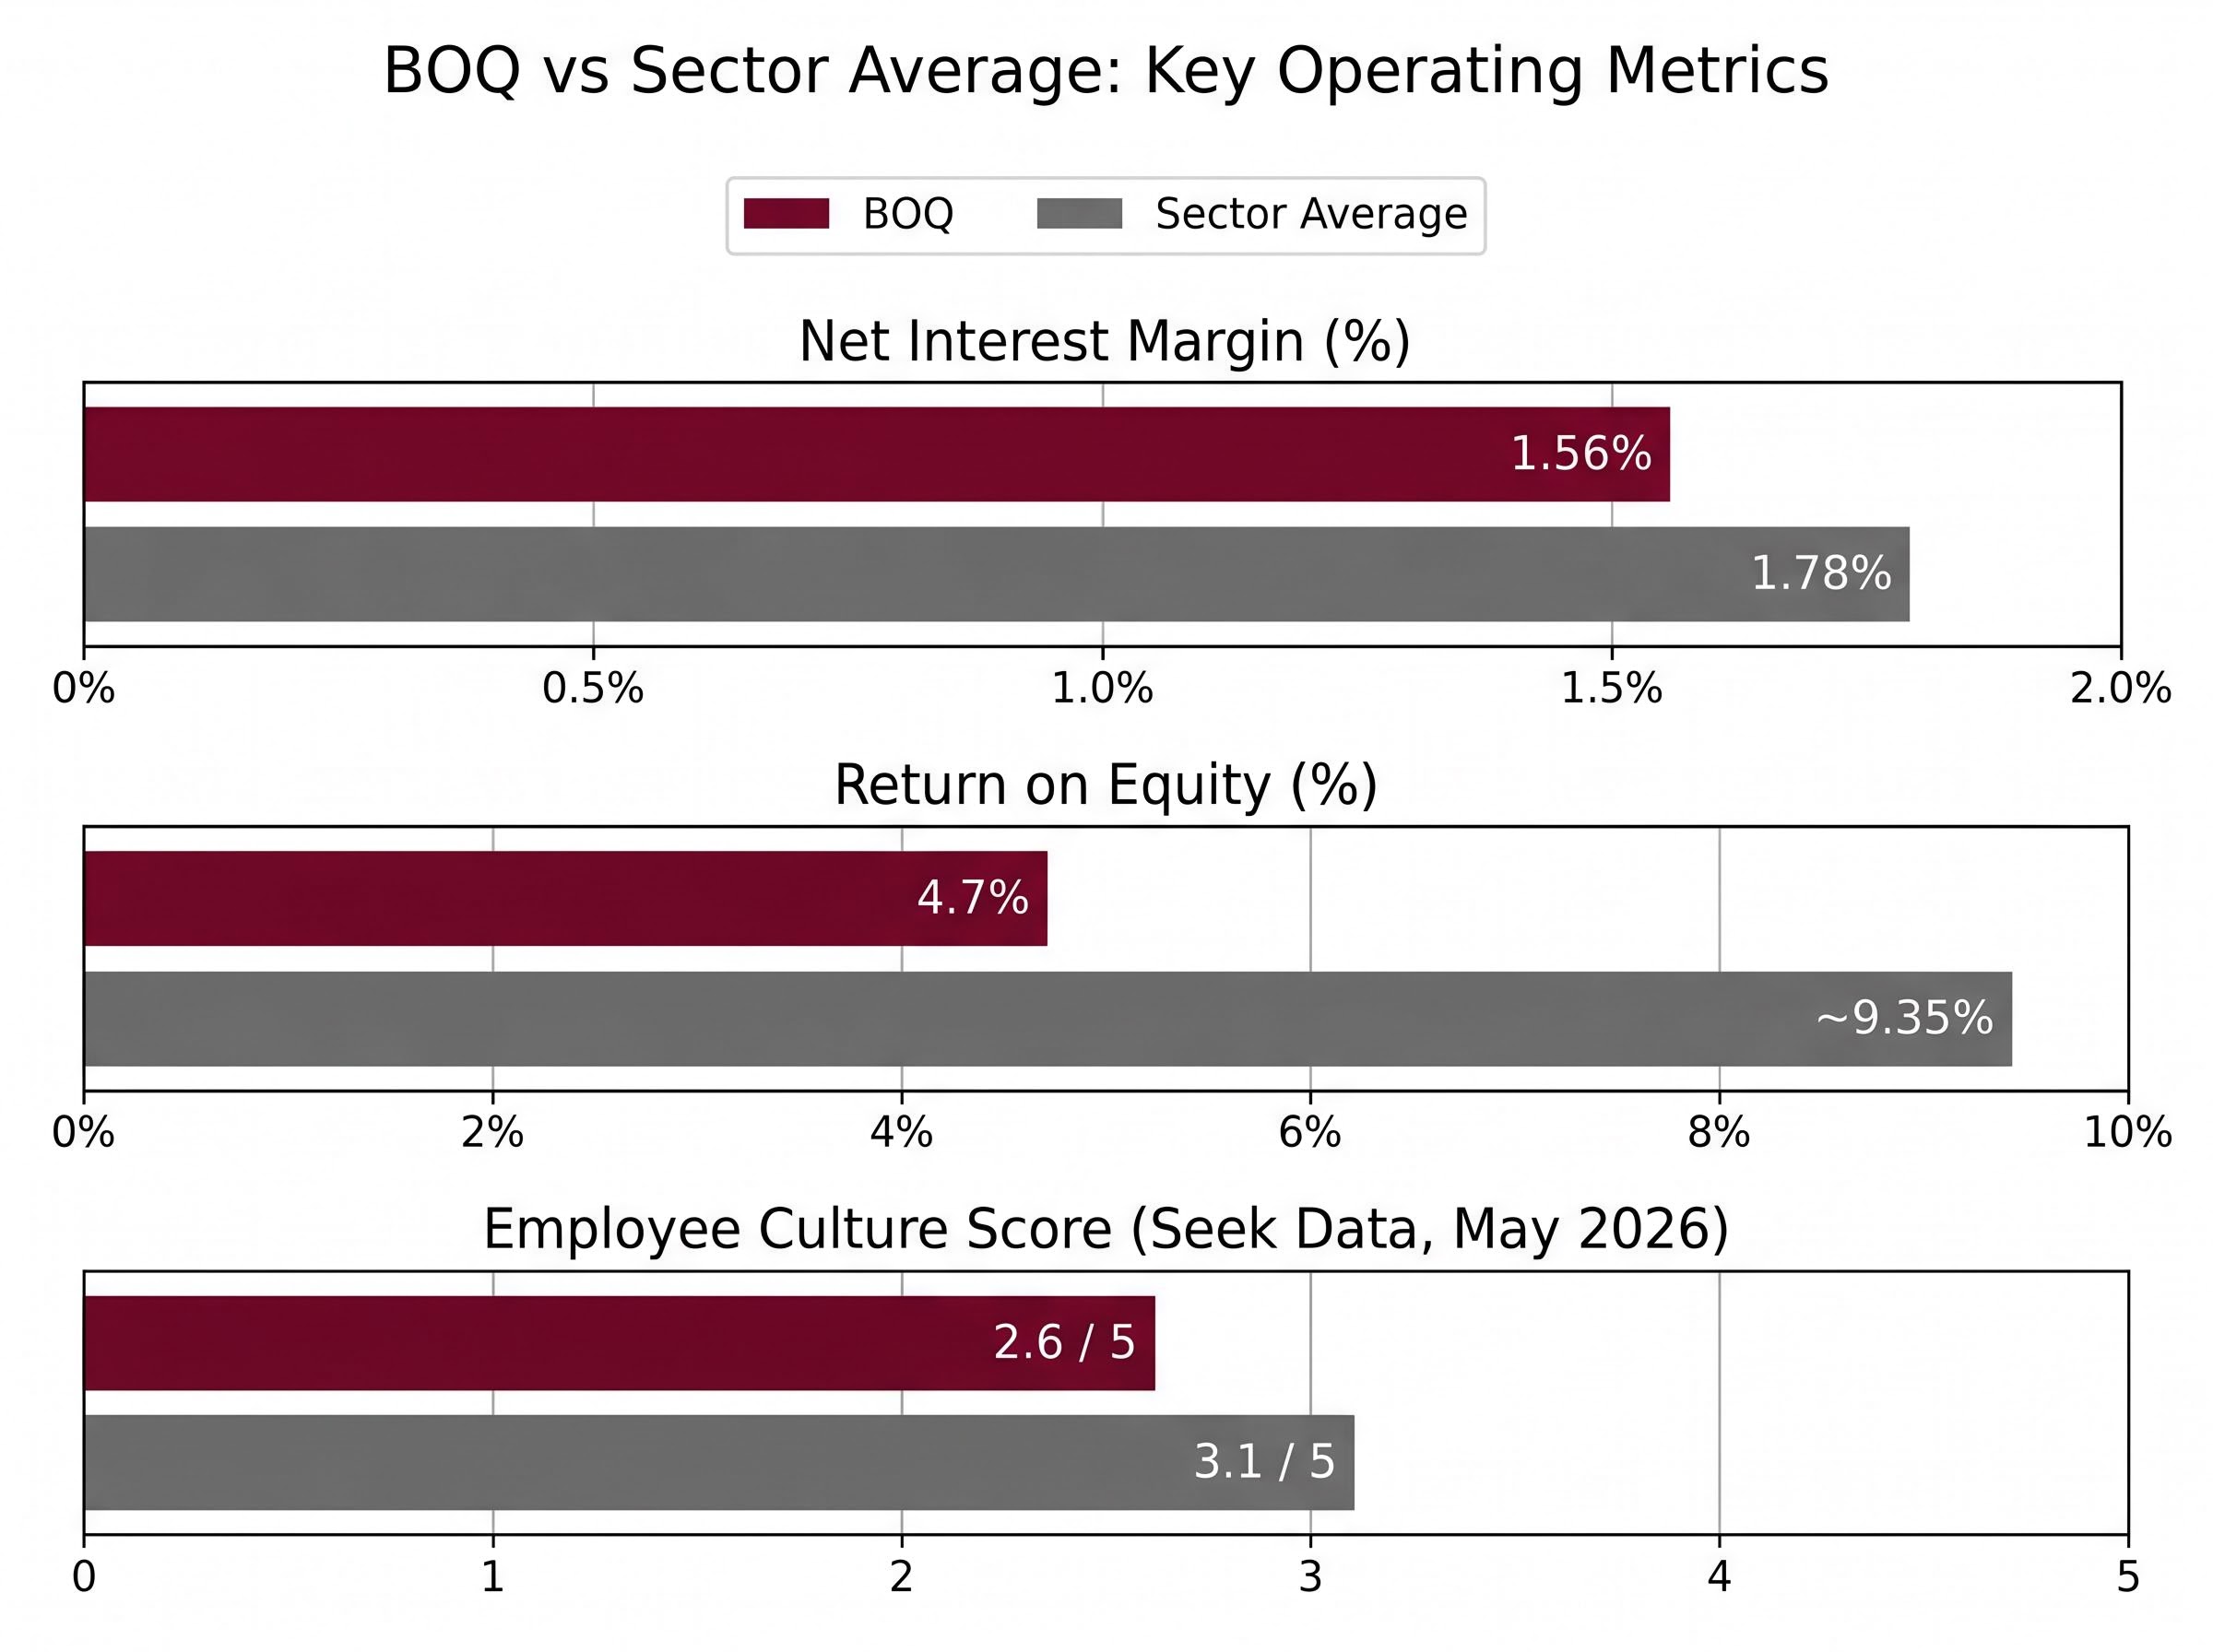
The ROE gap is particularly instructive. BOQ’s return on equity of 4.7% sits at roughly half the sector average of approximately 9.35%, according to Rask calculations. A lower-ROE bank requires a more conservative dividend growth assumption because it retains less capital per unit of earnings to fund future growth. Investors who apply the same growth rate to BOQ as to CBA without adjusting for this gap will overstate BOQ’s fair value relative to peers.
Net interest margin (NIM) tells a similar story. BOQ’s NIM of 1.56% versus the major bank peer average of 1.78% constrains the earnings base from which dividends are paid, reinforcing why the growth rate input should differ between a regional and a major bank model.
The DDM values dividend capacity. It does not value operating quality. A bank can appear undervalued on a DDM while suffering structural profitability problems that threaten future dividend sustainability.
BOQ illustrates the distinction clearly:
| Metric | BOQ | Sector Average | DDM Implication |
|---|---|---|---|
| NIM | 1.56% | 1.78% | Constrains earnings growth, pressures dividend growth assumptions |
| ROE | 4.7% | ~9.35% | Low ROE limits sustainable growth rate (g) in Gordon model |
| CET1 | 11.18% | Above sector minimum | Supports near-term dividend capacity |
| Payout Ratio | Within sector range | ~78.5% | Leaves limited buffer for earnings misses |
BOQ’s ROE of 4.7% is roughly half the sector benchmark. Its NIM of 1.56% trails the major bank average by 22 basis points. According to Seek data (most recent available as of May 2026), BOQ’s employee culture score of 2.6 out of 5 falls below the financial sector benchmark of 3.1 out of 5, a dimension of business quality entirely invisible to the DDM but relevant to long-term operational execution.
The CET1 ratio of 11.18% is the one metric that directly supports dividend sustainability in the near term. The capital buffer is real and meaningful.
“A DDM tells you what a dividend stream is worth. It does not tell you whether that dividend stream will continue. That is why operating metrics matter as the second check, not the first.”
The DDM fair value range of $7.19 to $10.57 against a current share price of $6.34 is interesting. It only remains compelling if the bank’s operating trajectory supports the dividend growth assumptions embedded in those estimates, and BOQ’s current NIM and ROE figures create legitimate questions about that trajectory.
Valuing bank shares with NIM and CET1 alongside a DDM produces a more complete picture than the dividend model alone, as Westpac’s H1 2026 data illustrates: a CET1 ratio of 12.53% sitting approximately 200 basis points above APRA’s effective minimum supports dividend sustainability through a moderate downturn in a way that BOQ’s tighter 43-basis-point buffer does not replicate.
The DDM walkthrough produces a defensible fair value range of $7.19 to $10.57 for BOQ, depending on franking credit treatment, against a current market price of $6.34. The gap may suggest the market is pricing in operational risk that the dividend model does not fully capture.
The four-step framework is replicable across the ASX banking sector:
With the RBA cash rate at 4.35% and inflation forecast to remain above target through mid-2027, the discount rate assumption is the single most sensitive input in any near-term Australian bank DDM. Modelling multiple rate scenarios, rather than anchoring to one cost of equity, produces a more honest range of outcomes.
The framework is genuinely useful for ASX bank investors, and BOQ’s publicly available figures make it a practical training ground. The model’s output, however, is only as reliable as the assumptions that drive it.
For investors who want to move beyond single-stock DDM valuation and apply these principles at the portfolio level, our comprehensive walkthrough of ASX dividend portfolio construction covers payout ratio analysis, ex-dividend timing, dividend reinvestment plan compounding, and the specific warning signs that distinguish a sustainable fully franked income stream from a dividend trap heading toward a cut.
This article is for informational purposes only and should not be considered financial advice. Investors should conduct their own research and consult with financial professionals before making investment decisions. Past performance does not guarantee future results. Financial projections are subject to market conditions and various risk factors.
The Dividend Discount Model estimates a share's fair value as the present value of all future dividends, discounted at the investor's required rate of return. Banks suit this model particularly well because their regulated earnings and high payout ratios produce the stable, predictable dividend streams the model requires.
Franking credits represent corporate tax already paid by the company, and eligible Australian resident investors can use them to offset personal tax liability. Grossing up BOQ's $0.35 dividend by the 1.43x franking multiplier raises the DDM fair value estimate from $7.19 to $10.57, a difference of more than 47%.
With the RBA cash rate at 4.35% as of May 2026, an equity risk premium of 5-6%, and a beta of 1.0-1.2 for regional banks like BOQ, the resulting cost-of-equity range is approximately 9.35% to 11.55%. Investors using older 6-7% discount rates will produce materially higher and potentially misleading fair value estimates.
A terminal growth rate above 2.5% requires explicit justification for an Australian regional bank, since Australia's 2026 GDP growth forecast is 2.0% and a mature bank cannot sustainably grow dividends faster than the economy it serves over the long run.
Check the bank's CET1 ratio against APRA's minimum requirement and management's target range. BOQ's CET1 ratio of 11.18% sits approximately 43 basis points above the top of its target range of 10.25-10.75%, indicating near-term dividend capacity, but metrics like ROE and NIM should also be assessed to evaluate longer-run sustainability.