Why the Mid-Cap Rotation Beat Mega-Cap Tech in June 2026
13 mins ago

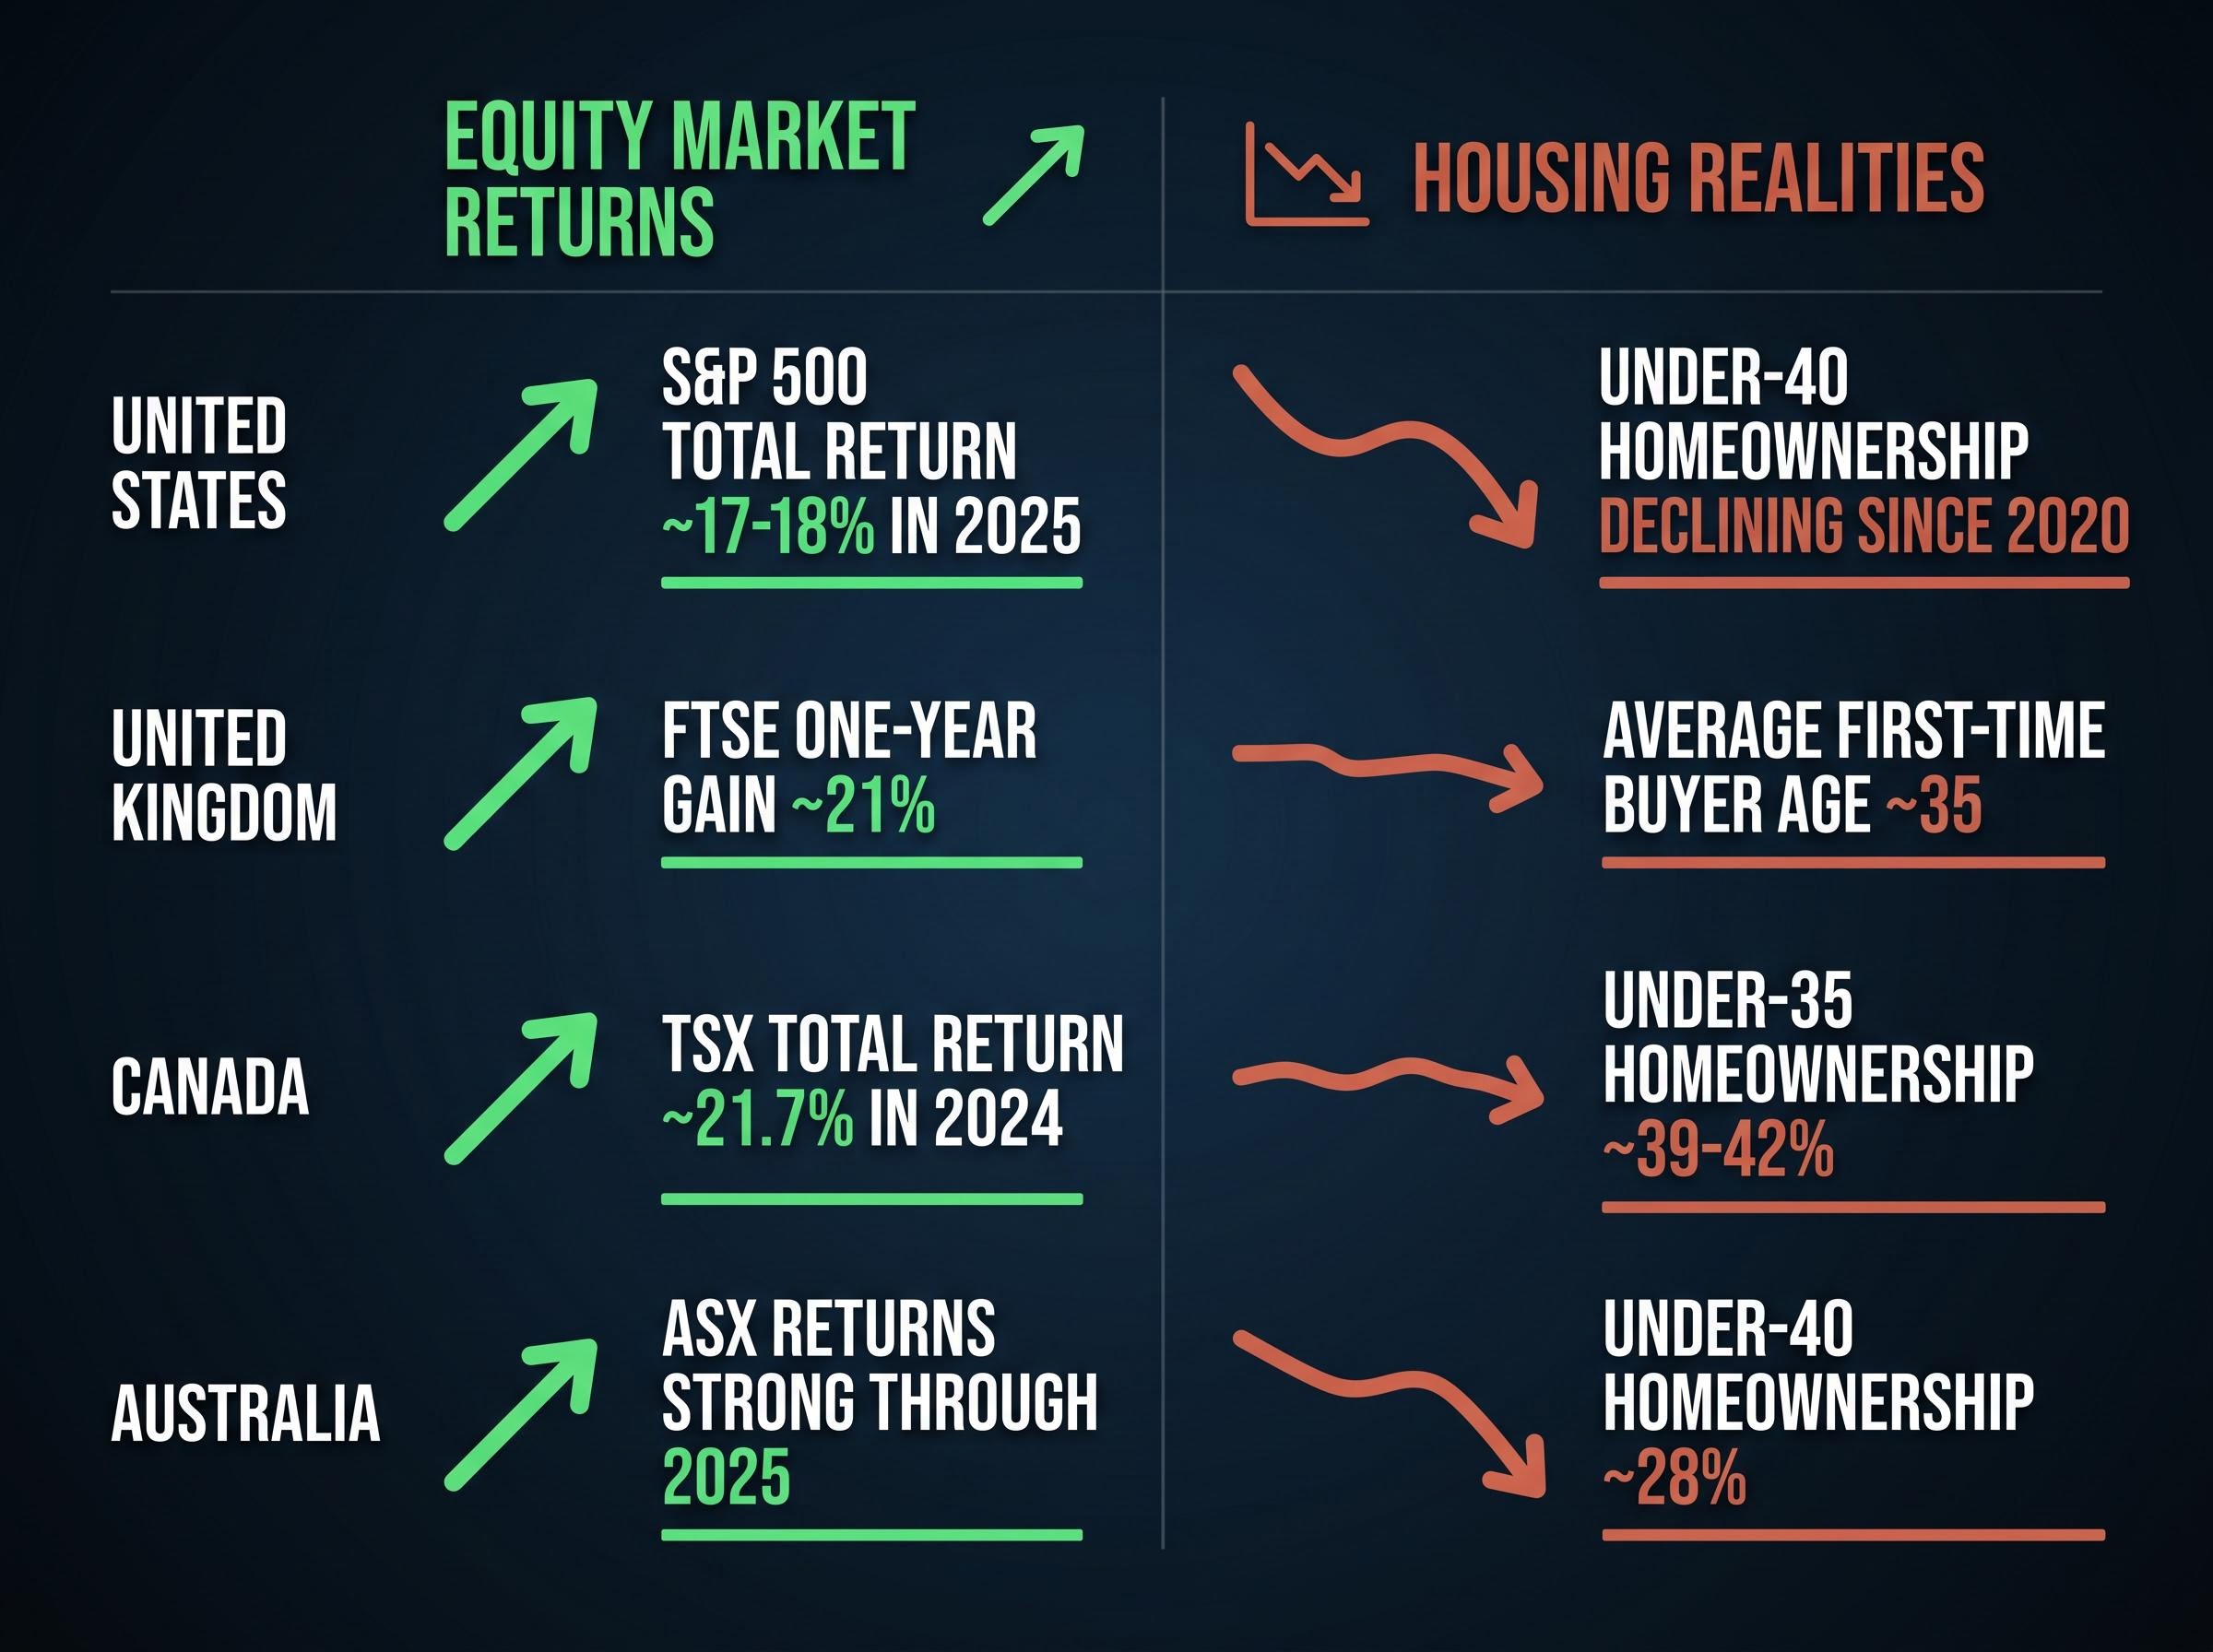
The S&P 500 delivered roughly 17-18% returns in 2025. The TSX Composite surged 21.7%. The UK FTSE rose more than 20% in a single year. Over the same period, homeownership among Canadians under 35 fell to 39%, the average UK first-time buyer turned 35, and Australians under 40 owned homes at a rate of just 28%. If markets are thriving, why are ordinary households being priced out of the assets those markets contain?
Political and media commentary routinely uses rising indices as shorthand for economic health. Two decades of data now complicate that framing. Asset price inflation and household living standards can move in sustained opposite directions, and the gap between the two has widened with every post-crisis recovery since 2008. What follows is a structural framework for understanding why the prosperity narrative fails, what is actually driving elevated valuations, and what the policy literature says about reversing the dynamic.
The assumption runs deep: booming markets signal a healthy economy. Politicians cite record equity indices as evidence of broad prosperity. Central banks point to wealth effects supporting consumption. The framing has persisted across multiple administrations and economic cycles, from the post-GFC recovery through the post-COVID asset surge. It has also been consistently wrong as a measure of who actually benefits.
Consider the cross-country snapshot:
These are not contradictory signals. They are features of the same structural moment. Equity indices at record levels and housing price-to-income ratios at generational highs coexist because the same capital flows produce both outcomes.
The observed divergence between the housing market and the broader economy, where new single-family home sales fell 17.6% in January 2026 while equity indices remained near record levels, is structurally consistent with the pattern this article describes: asset class performance has become an increasingly unreliable proxy for conditions facing the median household.
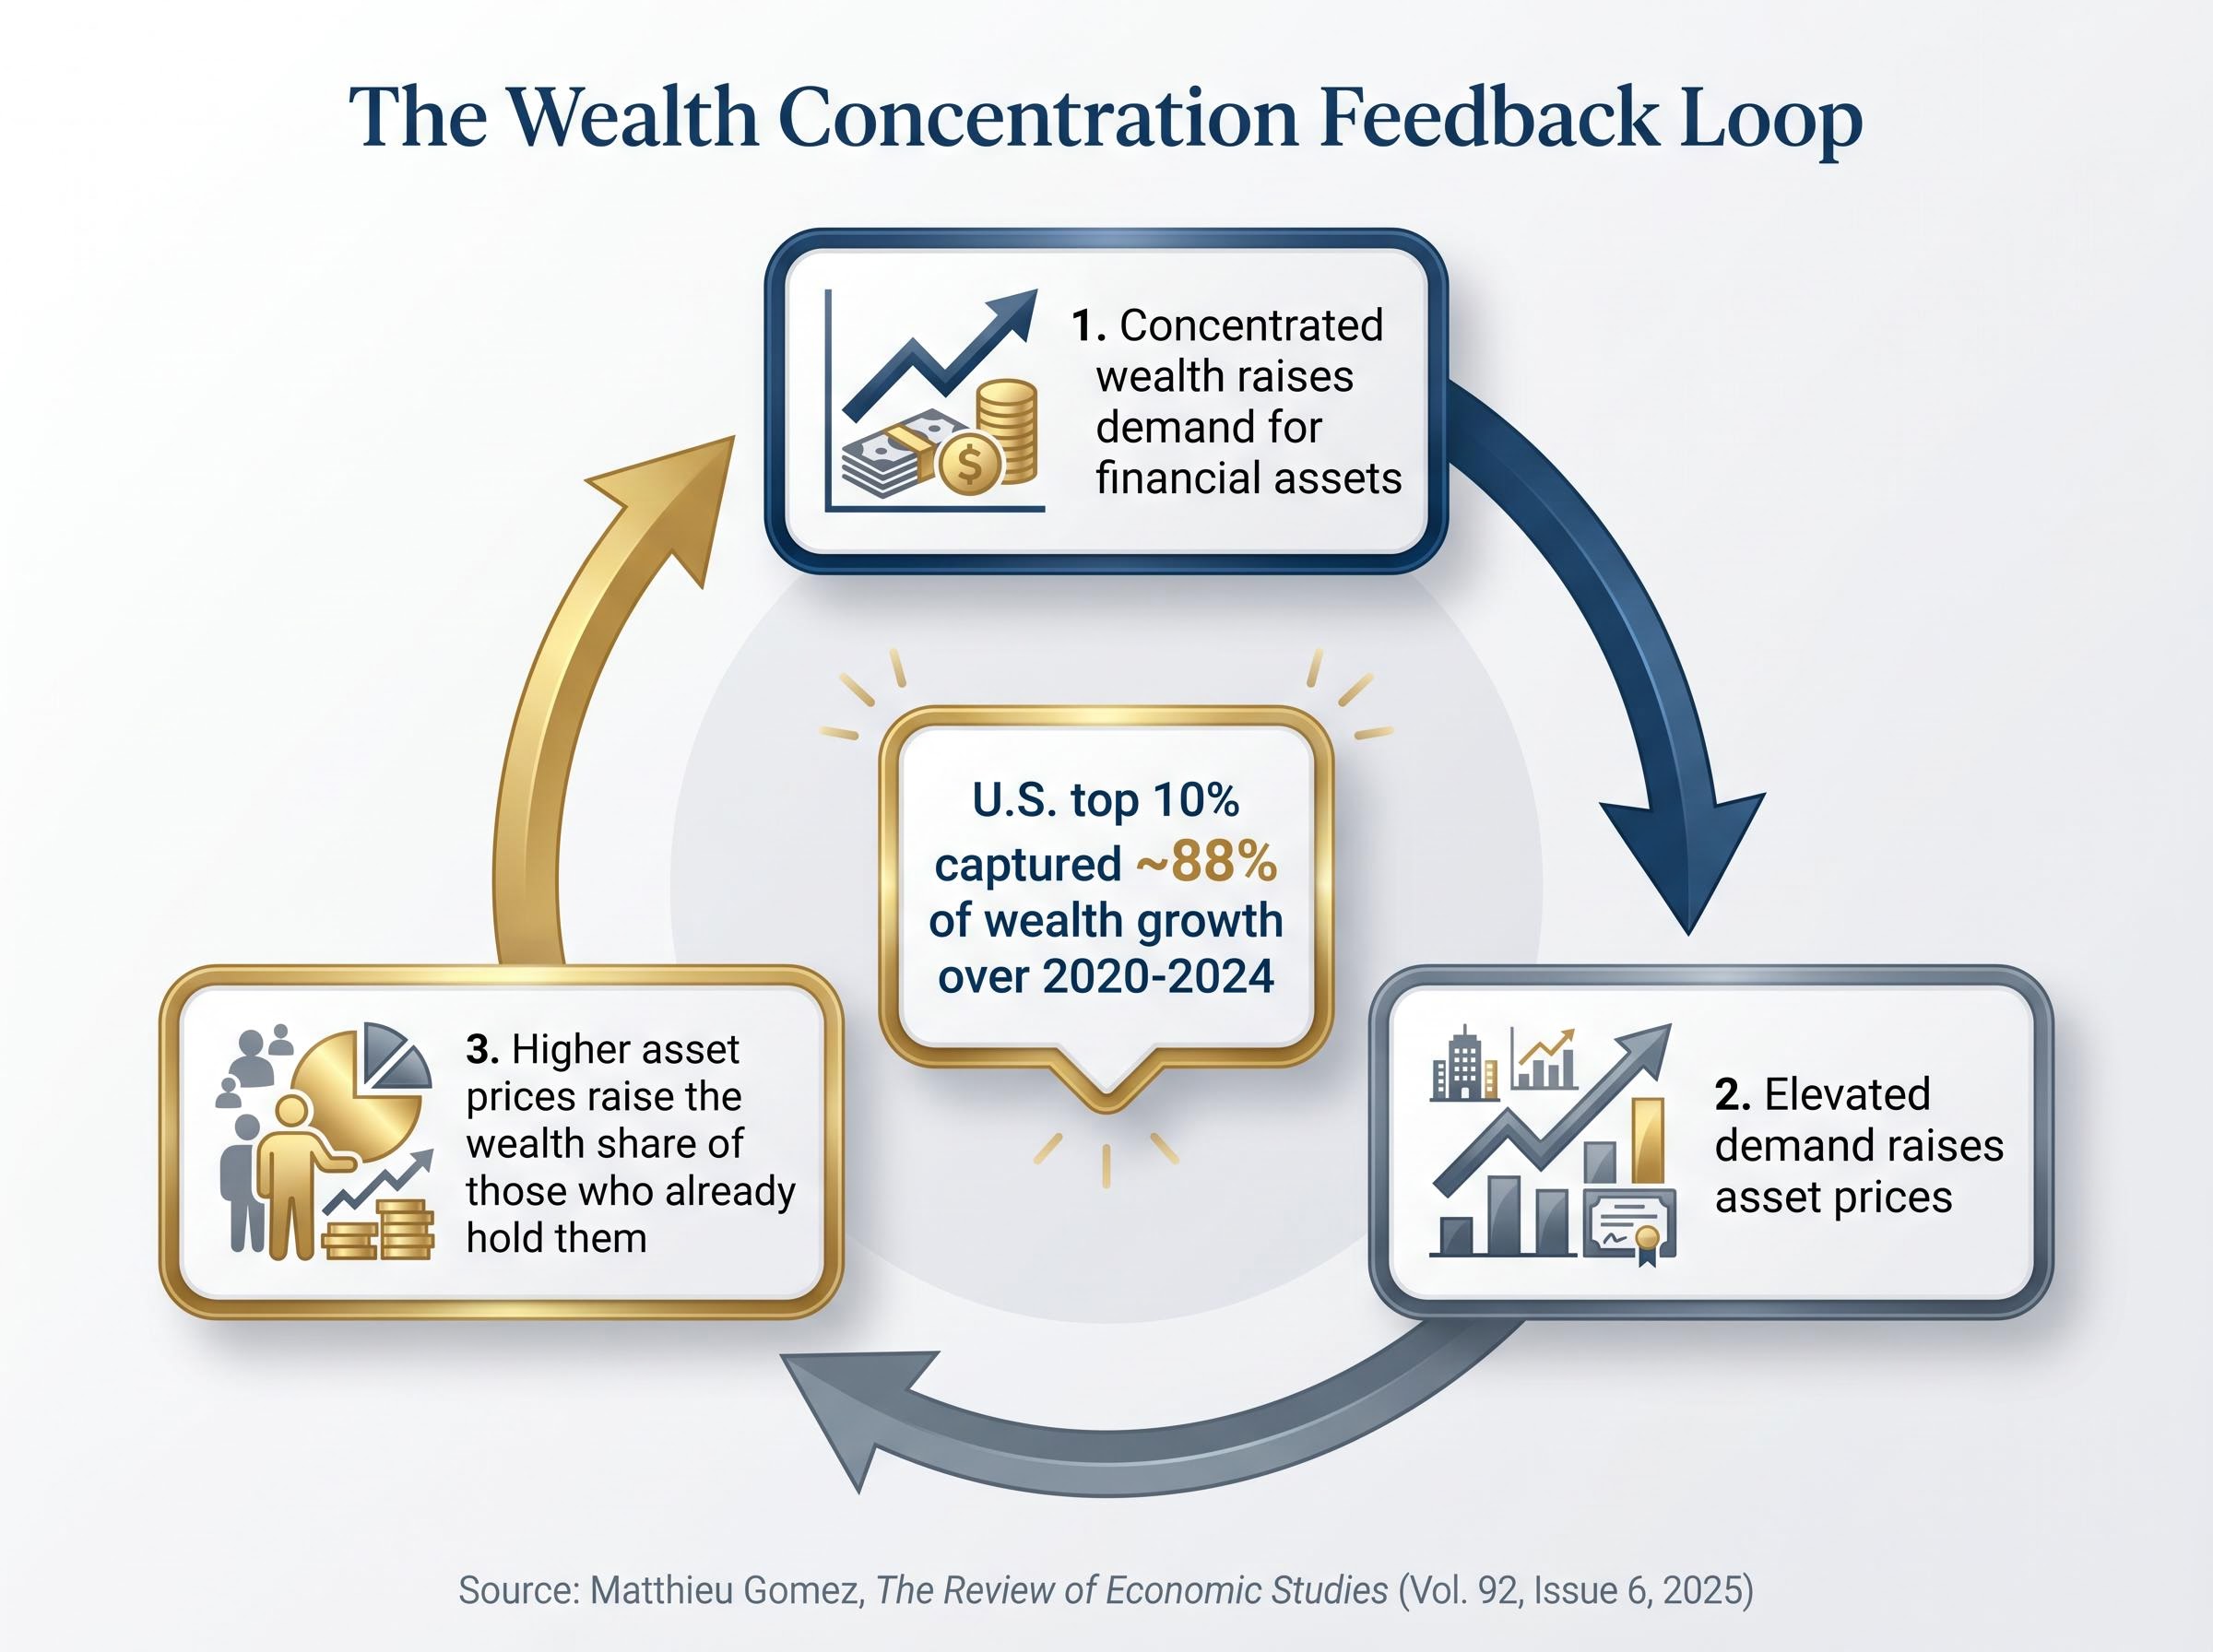
Federal Reserve Distributional Financial Accounts data shows the top 10% of U.S. households captured approximately 88% of wealth growth over 2020-2024.
The U.S. top 1% wealth share stood at approximately 34.9% as of Q4 2025, up from 30.4% in 2020. High asset prices may not be proof of economic strength. They may be a symptom of distributional deterioration.
The theoretical case has entered the policy mainstream. Several jurisdictions have moved from academic discussion to legislative action or formal study.
| Jurisdiction | Proposal Type | Status | Notable Outcome |
|---|---|---|---|
| Spain | “Great Fortunes Tax” (1.7-3.5% on assets above €3M) | Active since Nov 2024 | ~€1.5B revenue; no significant capital exodus; housing speculation improvement |
| Brazil | Progressive capital reform (Bill 1,087/2025) | Passed March 2025 | First major progressive capital reform in the Americas |
| EU Commission | Wealth taxation study (net wealth, capital, exit taxes) | Study phase (April 2026) | No harmonised legislative proposal confirmed |
| G20 / IMF | Progressive wealth tax framework discussion | Ongoing (IMF Fiscal Monitor, April 2025) | IMF recommends progressive wealth taxes in G20 economies |
The mainstream counterargument deserves direct engagement. Larry Summers and other economists have warned that aggressive wealth taxes risk capital flight without sufficient revenue to justify the disruption. The concern is real and has empirical backing in historical cases.
Spain’s experience provides the most direct rebuttal available: no significant capital exodus has been observed following implementation, and housing speculation metrics showed improvement.
The transmission mechanism linking wealth taxation to housing affordability is specific: reduced speculative demand from top wealth holders compresses price-to-income ratios. This is not an indirect or aspirational connection. It operates through the same feedback loop Gomez’s research documents, interrupted at the demand stage.
The IMF Fiscal Monitor (April 2025) recommends progressive wealth taxes in G20 economies and promotes discussion of a global minimum wealth tax framework, building on 2024 G20 discussions.
The IMF Fiscal Monitor April 2025 identifies progressive wealth taxation as a policy priority for G20 economies and frames the global minimum wealth tax discussion as a structural response to concentration dynamics that conventional monetary tools have failed to address.
The arithmetic is straightforward. Wealthy households hold disproportionate equity exposure. When asset prices rise, their wealth share expands relative to wage-dependent households whose incomes do not move in step.
What makes this more than a one-off effect is the feedback loop. Research from Matthieu Gomez, published in The Review of Economic Studies (Vol. 92, Issue 6, 2025), documents the mechanism across post-2000 U.S. data: rising inequality pushes risk-tolerant wealthy investors toward greater asset demand, which inflates prices further, which widens inequality again.
The loop operates in three stages:
Each stage feeds the next. The cycle does not self-correct.
The distributional skew is further compressed by equity market concentration: five U.S. mega-cap companies now control roughly 30% of total U.S. market capitalisation, a level without historical precedent, meaning that even within the asset-owning class, the gains from index appreciation are heavily weighted toward the largest holders.
Every major crisis since 2008 has followed the same sequence. Government deficit responses inject capital into the economy. That capital accumulates disproportionately among top wealth holders, who deploy it into assets. Prices rise. Concentration deepens.
The pattern repeated through the GFC, the European sovereign debt crisis, and the COVID response. Estimated COVID-era deficit spending reached approximately $40,000 per U.S. adult and approximately £20,000 per UK adult, illustrative of the transfer volumes involved.
Interest rate theory predicted asset price falls when rates rose post-COVID. Prices continued climbing. That anomaly only resolves if the distributional mechanism, not the rate mechanism, is doing the primary work. A World Inequality Lab working paper (2025/01), covering 18 countries over 1870-2020, found that rising top wealth shares driven by asset prices were associated with increased financial crisis probability of approximately 3-8 percentage points, framing concentration itself as a systemic risk.
The abstract argument about concentration becomes concrete in housing markets. Price-to-income ratios, measuring median home price divided by median household income, reveal the gap between what markets are delivering in aggregate and what working-age households can actually access.
| Market | Housing P/I Ratio | Under-40 Homeownership | Equity Index Return (2024-2025) |
|---|---|---|---|
| New York City (U.S.) | ~13.5 | Declining since 2020 | S&P 500: ~17-18% |
| London (UK) | ~12.5 | First-time buyer age ~35 | FTSE: ~21% |
| Toronto (Canada) | ~11+ | Under-35: ~39-42% | TSX: ~21.7% |
| Sydney (Australia) | Among highest globally | Under-40: ~28% | ASX: strong returns |
| Berlin (Germany) | ~10.6 | EU under-40 down 3-6pp | DAX: positive |
In Toronto, the median home costs approximately $1.2 million against a median household income of approximately $95,000. The bottom 50% of U.S. households saw nominal net worth grow approximately 20-25% from 2020-2025, but from a very low base, and housing costs consume approximately 40% of median income in major metros.
In Australia, under-40 homeownership stands at approximately 28%, even as superannuation funds have delivered strong nominal returns. Approximately 40% of younger Australians cannot accumulate sufficient deposit savings despite superannuation growth.
The same dynamic operates in equities. The bottom half of households hold negligible direct equity. Stock market gains do not translate into balance-sheet improvement for most households. Homeownership, the primary wealth-building vehicle for non-top-decile households, is becoming less accessible precisely as financial assets appreciate.
If governments can protect living standards during a crisis by redirecting wealth rather than creating new output, what does that say about the crisis itself? The implication is that productive capacity was never the binding constraint. The constraint was distributional: purchasing power concentrated among households that save rather than spend.
This distinction reframes the standard crisis narrative. Government borrowing from wealthy households does not create new resources. It rearranges claims on existing ones, leaving the wealthy no poorer in net terms once bonds are repaid with interest.
Deficit spending and wealth taxation both move purchasing power from wealthy households to the rest of the economy. The consequences diverge sharply:
Deficit spending response:
Wealth redistribution response:
Thomas Piketty has argued that annual taxes on very large net wealth would reduce top concentration and thereby reduce speculative demand pressure on housing and equities. The World Inequality Lab finding that elevated wealth concentration raises financial crisis probability by approximately 3-8 percentage points frames concentration not merely as an equity concern but as a systemic risk factor. If the distributional mechanism is doing the primary work in driving asset inflation, then the policy instrument that addresses it directly is logically distinct from, and more targeted than, monetary tightening.
The analysis above yields a practical interpretive tool: rising asset prices in an environment of concentrated ownership are a distributional signal, not a prosperity signal. Continued asset appreciation without redistribution does not indicate recovery. It indicates deepening concentration.
The dynamic extends beyond equities and housing. Global cryptocurrency market capitalisation surged approximately 30% in 2025. The top 1% of Bitcoin holders control approximately 40% of supply, according to the Chainalysis 2026 Crypto Adoption Report. High concentration, rapid appreciation, and exclusion of late entrants follow the same structural pattern.
Index fund concentration risk compounds the distributional picture: the cap-weighted S&P 500 returned 86% over three years against 43% for the equal-weighted version, but the entire gap was driven by valuation expansion in a handful of mega-cap names, meaning the returns cited in headline figures are experienced most fully by large holders of those names, not by the broader investing population.
Three signals deserve attention:
The counterarguments have substance. Rising asset prices support consumption, which supports employment. U.S. unemployment held at approximately 3.8% during the same period in which 55% of millennials reported inability to afford homeownership, per Federal Reserve survey data. Workers benefit from employment even when they do not own assets directly.
ECB and mainstream housing economists argue that unaffordability is primarily a supply-side problem: restrictive zoning, construction bottlenecks, and planning constraints. This view holds that demand-side interventions would have limited effect without supply reform. China’s top 10% wealth share reaching approximately 70% by 2025 demonstrates the dynamic operates beyond Western liberal market economies, complicating any single-policy explanation.
These points are not dismissed. They are insufficient to resolve the structural problem. Nominal gains for the bottom 50% are real, but housing costs consuming 40% of median metro income illustrate the limits of nominal improvement when asset prices move faster than wages.
Asset price inflation, measured against who owns those assets, is a more honest indicator of inequality than of economic health. The same pattern of crisis response, deficit spending, and capital concentration that produced the last two decades of divergence remains active. Interpreting future market highs through a distributional lens is the more accurate approach.
Wealth taxation is not merely a redistributive preference. It is the specific mechanism that would interrupt the feedback loop driving asset inflation, housing unaffordability, and retirement inaccessibility simultaneously. Whether that mechanism will be deployed at sufficient scale remains a political question, not an economic one.
For readers wanting to understand how structural constraints interact with individual financial decisions, our full explainer on household wealth gaps shows how two people on identical $95,000 salaries can produce a $571,000 net worth difference over ten years through spending sequencing alone, illustrating the individual-level dimension of the distributional forces this article describes at the macro level.
The World Inequality Lab’s 18-country dataset finds that elevated top wealth shares raise financial crisis probability by approximately 3-8 percentage points. Concentration is not only an equity concern; it is a systemic risk.
This article is for informational purposes only and should not be considered financial advice. Investors should conduct their own research and consult with financial professionals before making investment decisions. Forward-looking statements regarding policy outcomes and market responses are speculative and subject to change based on political developments and market conditions.
—
Asset price inflation refers to rising valuations in equities, housing, and other financial assets, driven largely by concentrated capital demand rather than broad productive output. Unlike economic growth, which raises living standards across households, asset price inflation primarily benefits those who already own significant assets, leaving wage-dependent households behind.
The same capital flows that push equity indices to record highs also drive speculative demand in housing markets, inflating price-to-income ratios faster than wages can keep pace. This means strong index returns and declining homeownership rates among younger households are features of the same structural dynamic, not contradictory signals.
The IMF Fiscal Monitor from April 2025 recommends progressive wealth taxes in G20 economies and supports a global minimum wealth tax framework, arguing these tools are a structural response to concentration dynamics that conventional monetary policy has failed to correct.
Research published in The Review of Economic Studies (2025) documents a three-stage cycle: concentrated wealth raises demand for financial assets, elevated demand pushes prices higher, and higher prices further expand the wealth share of existing holders. Each stage feeds the next without a natural self-correcting mechanism.
Spain's Great Fortunes Tax, active since November 2024 and applying rates of 1.7-3.5% on assets above 3 million euros, generated approximately 1.5 billion euros in revenue with no significant capital exodus observed, and housing speculation metrics showed improvement following implementation.