
Why a BoJ Rate Hike Hasn’t Stopped the Yen Carry Trade
4 hrs ago

Two experienced investors can sit across the same table, open the same NAB valuation model, plug in the same earnings-per-share figure and the same dividend, and arrive at completely opposite conclusions. One sees a clear buy. The other sees a stock to sell immediately. Neither made an arithmetic error. The difference sits entirely in their assumptions about where the Australian economy is heading, and for a sector that collectively represents more than one-third of the ASX 200 by market capitalisation, those assumptions are not a niche concern. They are a systemic one for any diversified Australian portfolio. What follows moves beyond the mechanics of PE ratios and dividend discount models to map the five non-quantitative dimensions that experienced bank analysts watch closely in 2026, using NAB as the running reference point throughout.
Consider NAB’s current share price of $38.36. Using the sector-average PE multiple of 19x against FY24 earnings per share of $2.26, a simple PE-implied valuation produces $42.40 per share. Straightforward enough.
The dividend discount model (DDM) tells a different story. A DDM estimates a stock’s value by forecasting its future dividend payments and discounting them back to today’s dollars, using assumptions about growth and risk. The sensitivity table below illustrates how dramatically outputs shift with different inputs.
The dividend discount model mechanics that produce the $19.00-to-$85.50 spread above trace back to a framework John Burr Williams formalised in 1938, designed specifically to anchor valuation in future income rather than price momentum, and the formula’s sensitivity to small changes in the growth rate (g) is by design, not a flaw.
| Risk Rate | 2% Growth | 3% Growth | 4% Growth |
|---|---|---|---|
| 6% | $56.50 | $68.80 | $85.50 |
| 8% | $35.74 | $42.10 | $51.66 |
| 11% | $19.00 | $22.40 | $27.10 |
“$19.00 to $85.50 per share, same model, same company, different assumptions.”
The consensus analyst target for NAB sits at approximately $38.91 (Investing.com), roughly in the middle. That spread is not a flaw. It reveals that the model is a structured way of expressing economic assumptions, not a source of objective truth. The real analytical work is forming defensible views on the qualitative and macroeconomic inputs that feed those assumptions. Five dimensions matter most.
Interest rate sensitivity is not an abstract concept for Australian bank investors. It operates through a specific mechanism: the net interest margin (NIM). NIM measures the difference between what a bank earns on its loans and what it pays on its deposits. When the Reserve Bank of Australia (RBA) raises the cash rate, banks with large variable-rate mortgage portfolios can reprice those loans upward almost immediately, expanding margins. The catch is that the same rate increase squeezes borrowers, elevating credit stress.
Not all banks carry the same exposure. According to UBS analysis reported via the Australian Financial Review, ANZ and NAB hold approximately 85% variable-rate mortgage exposure, making them the most rate-sensitive of the big four with a positive beta to hikes. CBA sits at the other end, benefiting from fixed-rate buffers and deposit repricing lag that insulates its NIM from short-term rate moves. Westpac falls in between, moderately sensitive.
The investor who forms a view on the RBA’s direction can use that view to tilt between banks with different rate sensitivities, turning a macroeconomic opinion into a portfolio positioning decision.
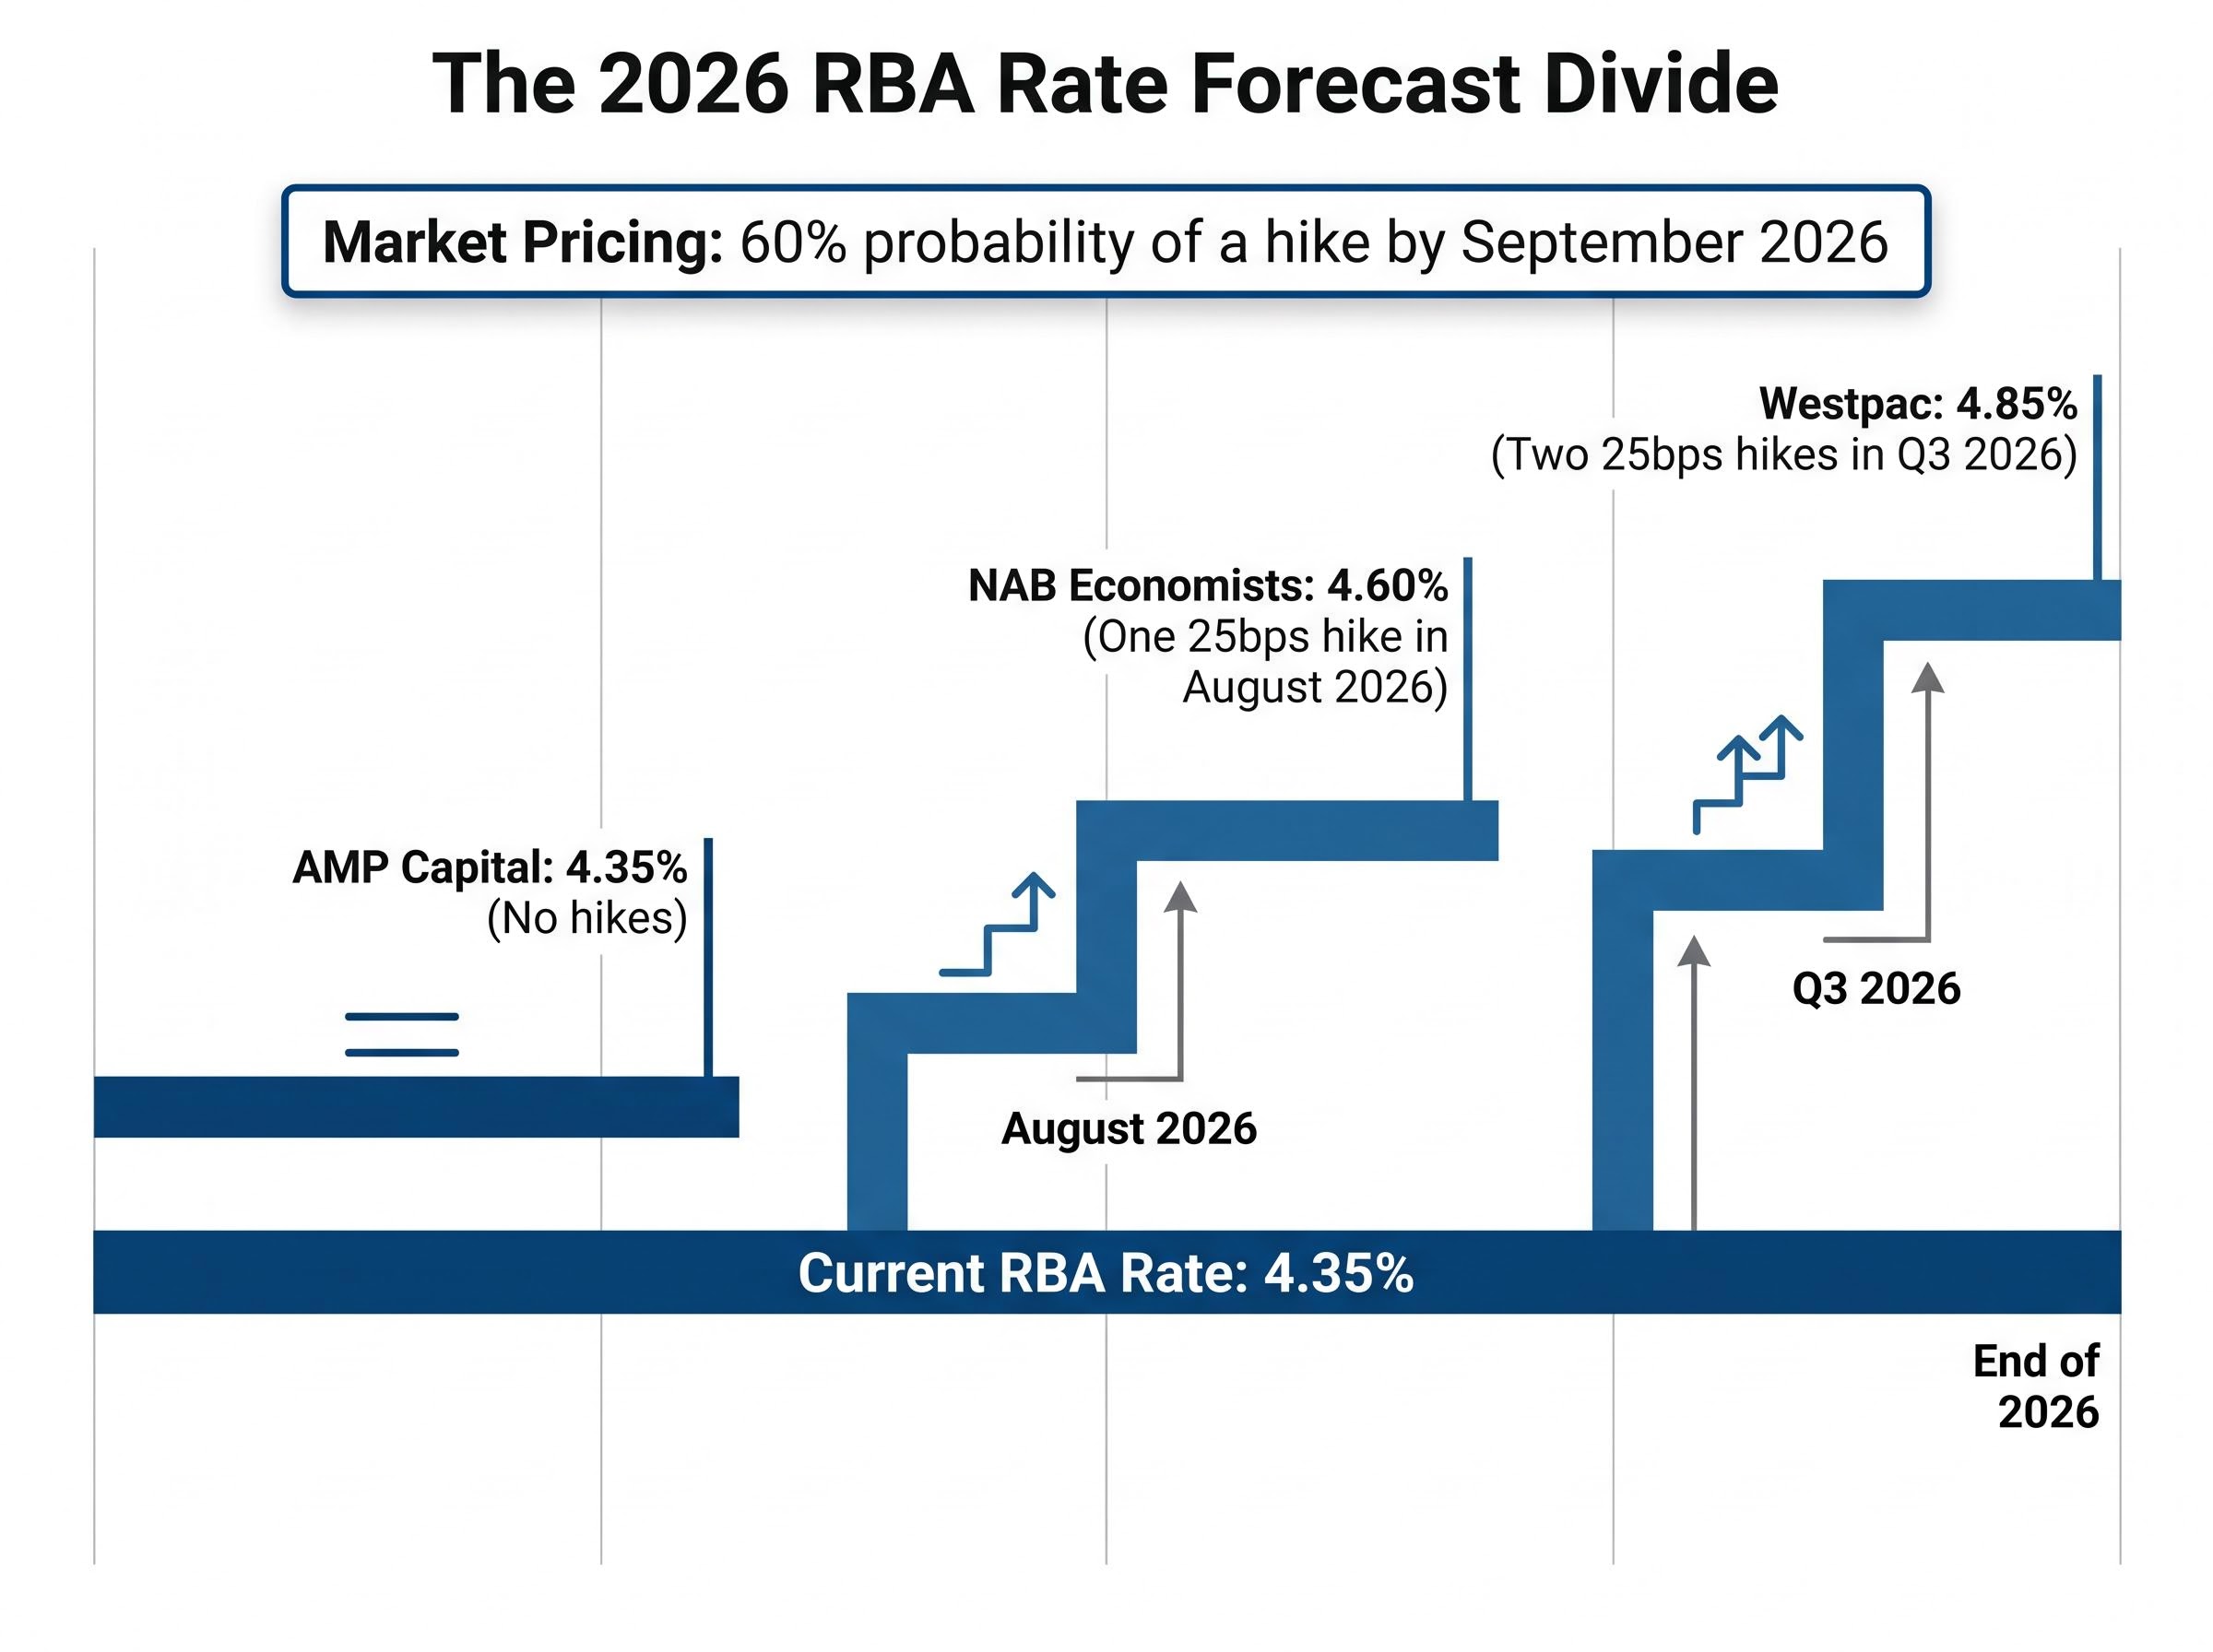
The RBA monetary policy statement released on May 5, 2026 confirms the cash rate target at 4.35%, citing persistent inflationary pressures and a cautious outlook for the domestic economy as the primary factors informing the Board’s decision, giving investors the official baseline from which all 2026 rate forecast divergence should be measured.
The current RBA cash rate stands at 4.35%, and the forecasts for where it ends 2026 diverge sharply:
Market pricing reportedly reflects approximately a 60% probability of a hike by September 2026. The gap between these views is not noise. It is the single most powerful input into any bank stock view, because it determines whether NIM expansion or credit stress dominates the earnings outlook.
The RBA rate decision outcome that arrived on 5 May 2026 resolved one layer of the forecasting debate: an 8-1 board vote delivered a third consecutive 25 basis point hike to 4.35%, but the Board preserved full policy optionality by neither committing to a pause nor signalling a fourth move, leaving the July 2026 meeting entirely data-dependent.
Rising unemployment is not simply bad news in the abstract. For bank investors, it is a specific leading indicator for bad debt provisioning, and the transmission chain runs through four discrete steps:
The latest verified ABS labour force data (March 2026) shows unemployment at 4.3% with a participation rate of 66.8%. That level is mild by historical standards, and credit arrears remain below 1%. Bad debt provisioning across the sector sits at approximately 0.25%, low but closely watched.
Provisioning is where the labour market meets the income statement.
The direction matters more than the level. Loan growth has slowed to approximately 4.5% year-on-year from 5.2%, and mortgage pre-approvals have declined roughly 2% month-on-month. NAB and Westpac carry higher small and medium enterprise (SME) book concentration than CBA, making them more exposed to a deteriorating small business credit environment if unemployment continues its upward trajectory.
Consumer confidence and employment data are publicly released and freely available through the ABS and the Westpac-Melbourne Institute index. Any investor can monitor these leading indicators without paying for proprietary research, making this one of the most accessible analytical inputs for retail portfolios.
Residential property plays a dual role for Australian banks. As collateral, rising house prices reduce loss-given-default: if a borrower defaults on a $600,000 mortgage secured against a property now worth $800,000, the bank recovers its capital. As a source of new lending growth, rising prices expand the total addressable mortgage market. Both dynamics appear directly in bank earnings forecasts.
The current picture looks supportive on the surface. CoreLogic data indicates national home values rose approximately 1.2% in April 2026, with annual growth of 5.8% and Sydney leading at +1.5% month-on-month. Domain reports the Q1 2026 median house price at approximately $785,000, up 4.1% year-on-year.
The complication sits underneath the headline numbers. Listings are up 15%, which may signal a supply-driven peak. Goldman Sachs commentary via the Australian Financial Review notes that property strength has supported low impairment charges, with NAB’s first-half 2026 bad debt result reportedly beating estimates. The same analysis flags concentration risk: NAB’s approximately 25% mortgage book exposure means a property price correction would hit its collateral values harder than more diversified peers.
| Bank | Mortgage Book Exposure | Property Correction Risk | Analyst Note |
|---|---|---|---|
| CBA | Diversified | Low | Viewed as safest on a correction scenario |
| ANZ | Diversified (Suncorp integration) | Low-Moderate | Suncorp deal cited as positive diversification |
| NAB | ~25% concentrated | High | Most exposed to collateral value decline |
| Westpac | Moderate | Moderate | Rate sensitivity could cap property gains |
Property market awareness is second nature to most Australian investors. The specific link between property trends and bank collateral values, provisioning ratios, and peer differentiation is less commonly understood, and it is directly actionable in stock selection.
The Hayne Royal Commission generated an estimated $200 million in ongoing remediation costs for NAB (directional estimate, unverified by primary source), along with compliance obligations and lasting reputational drag that still appears in governance assessments years later. Culture is not a values question for investors. It is a risk-adjusted return question.
“Culture is not a values question for investors. It is a risk-adjusted return question.”
Current NAB leadership developments offer a case study. CEO Andrew Irvine was reappointed for a second term in February 2026, according to the Australian Financial Review, a continuity signal that markets generally interpret as positive. CFO Tony Ellis departed in April 2026 amid a strategy review, replaced internally, with no significant investor backlash reported. Broader market sentiment, as reflected in Reuters Australia coverage, describes NAB as improved since the Royal Commission but still trailing CBA in governance reputation.
The framework extends beyond any single bank. Governance and culture inform the likelihood of future regulatory actions, remediation costs, and management distraction from earnings execution, all of which feed back into valuation assumptions. Investors monitoring bank governance should watch for these signals:
For investors monitoring governance signals as a leading indicator of regulatory cost risk, our dedicated guide to APRA’s AI risk governance expectations examines APRA’s April 2026 supervisory findings on board-level AI literacy gaps, vendor concentration dependencies, and accelerating AI-enabled cyber threats across Australian banking, insurance, and superannuation, providing the regulatory context behind one of the most active areas of APRA supervisory scrutiny in the sector.
Governance failures tend to be slow-moving and underpriced by markets until they crystallise into a regulatory action or an earnings miss. Early attention to culture signals represents a genuine edge for patient investors.
The five dimensions covered in this article, RBA rates, employment, property, governance, and analyst sentiment, are not separate analytical exercises. They form a single integrated framework. Each dimension requires the investor to form an explicit assumption, and the combination of those assumptions determines whether a bank stock looks attractive or expensive at any given price.
The current NAB case illustrates the point precisely. Jefferies holds a Buy rating with a target of $50.64, based on earnings growth outlook. Morgans holds a Sell rating with a target of $37.27, implying approximately -17% total shareholder return. The consensus sits at approximately $38.91. The gap between Jefferies and Morgans does not reflect different spreadsheets. It reflects different assumptions across precisely these five dimensions.
The Morgans sector-wide sell call that produced the $37.27 NAB target cited above was not issued in isolation: Morgans simultaneously applied sell ratings to all four major ASX banks, with CBA facing the steepest implied downside at approximately 29%, underpinned by a forecast that total Big Four provisions would rise from roughly $2.4 billion in FY25 to approximately $5.5 billion by FY27.
Banks are broadly viewed as richly valued following the 2025-2026 rally, with inflation persistence versus growth slowdown remaining the unresolved macro variable for the sector. The investor’s job is not to find the single correct answer. It is to form explicit, defensible assumptions on each variable and revisit them as data evolves.
The five-point checklist below offers a repeatable structure:
Forming an explicit assumption on each variable, even a provisional one, is more rigorous than leaving inputs unexamined. As the next ABS labour force release, the next RBA decision, and the next property price report arrive through the remainder of 2026, investors who hold explicit views on these variables will be positioned to act on new data rather than react to it.
The valuation model is the container. The qualitative and macroeconomic assumptions are the substance, and that is where the analytical work lives. RBA rate direction determines margin expansion or compression. Employment trends signal credit quality trajectory. Property prices underpin collateral values and concentration risk. Governance quality shapes the probability of regulatory cost surprises. Analyst consensus reveals the range of professional disagreement on all four.
For ASX bank stock investors in 2026, the DDM range of $19.00 to $85.50 on a single company is not an indictment of the model. It is a map of the assumptions that remain unresolved. The investor who forms explicit views on each dimension, and updates them as new data arrives, holds an edge over the investor who treats a single output as the answer.
This article is for informational purposes only and should not be considered financial advice. Investors should conduct their own research and consult with financial professionals before making investment decisions. Financial projections and analyst targets referenced are subject to market conditions and various risk factors. Past performance does not guarantee future results.
The dividend discount model (DDM) estimates a stock's value by forecasting future dividend payments and discounting them back to today's dollars using assumptions about growth and risk. For ASX bank stocks like NAB, small changes in those assumptions can shift the implied valuation from $19.00 to $85.50 per share on the same company.
The RBA cash rate directly influences net interest margins (NIM), which measure the gap between what banks earn on loans and pay on deposits. Banks like NAB and ANZ, with approximately 85% variable-rate mortgage exposure, are the most sensitive to rate changes among the big four.
Investors should monitor the ABS monthly labour force data for the direction of unemployment, since rising unemployment leads to deteriorating debt serviceability, higher mortgage arrears, and increased bad debt provisioning that directly reduces bank earnings. As of March 2026, the unemployment rate sits at 4.3%, with credit arrears still below 1%.
Rising property prices reduce loss-given-default by strengthening collateral values on mortgage books, while a correction would increase impairment charges. NAB carries approximately 25% concentrated mortgage book exposure, making it more vulnerable to a property price decline than more diversified peers like CBA and ANZ.
Key governance signals include APRA and ASIC regulatory review outcomes, leadership turnover patterns, remediation cost trajectory, and any institution-specific capital directions. For NAB, the Royal Commission generated an estimated $200 million in remediation costs, and governance assessments still show it trailing CBA in reputation.