How Zero Commissions Changed the Maths on Thematic ETFs
6 hrs ago
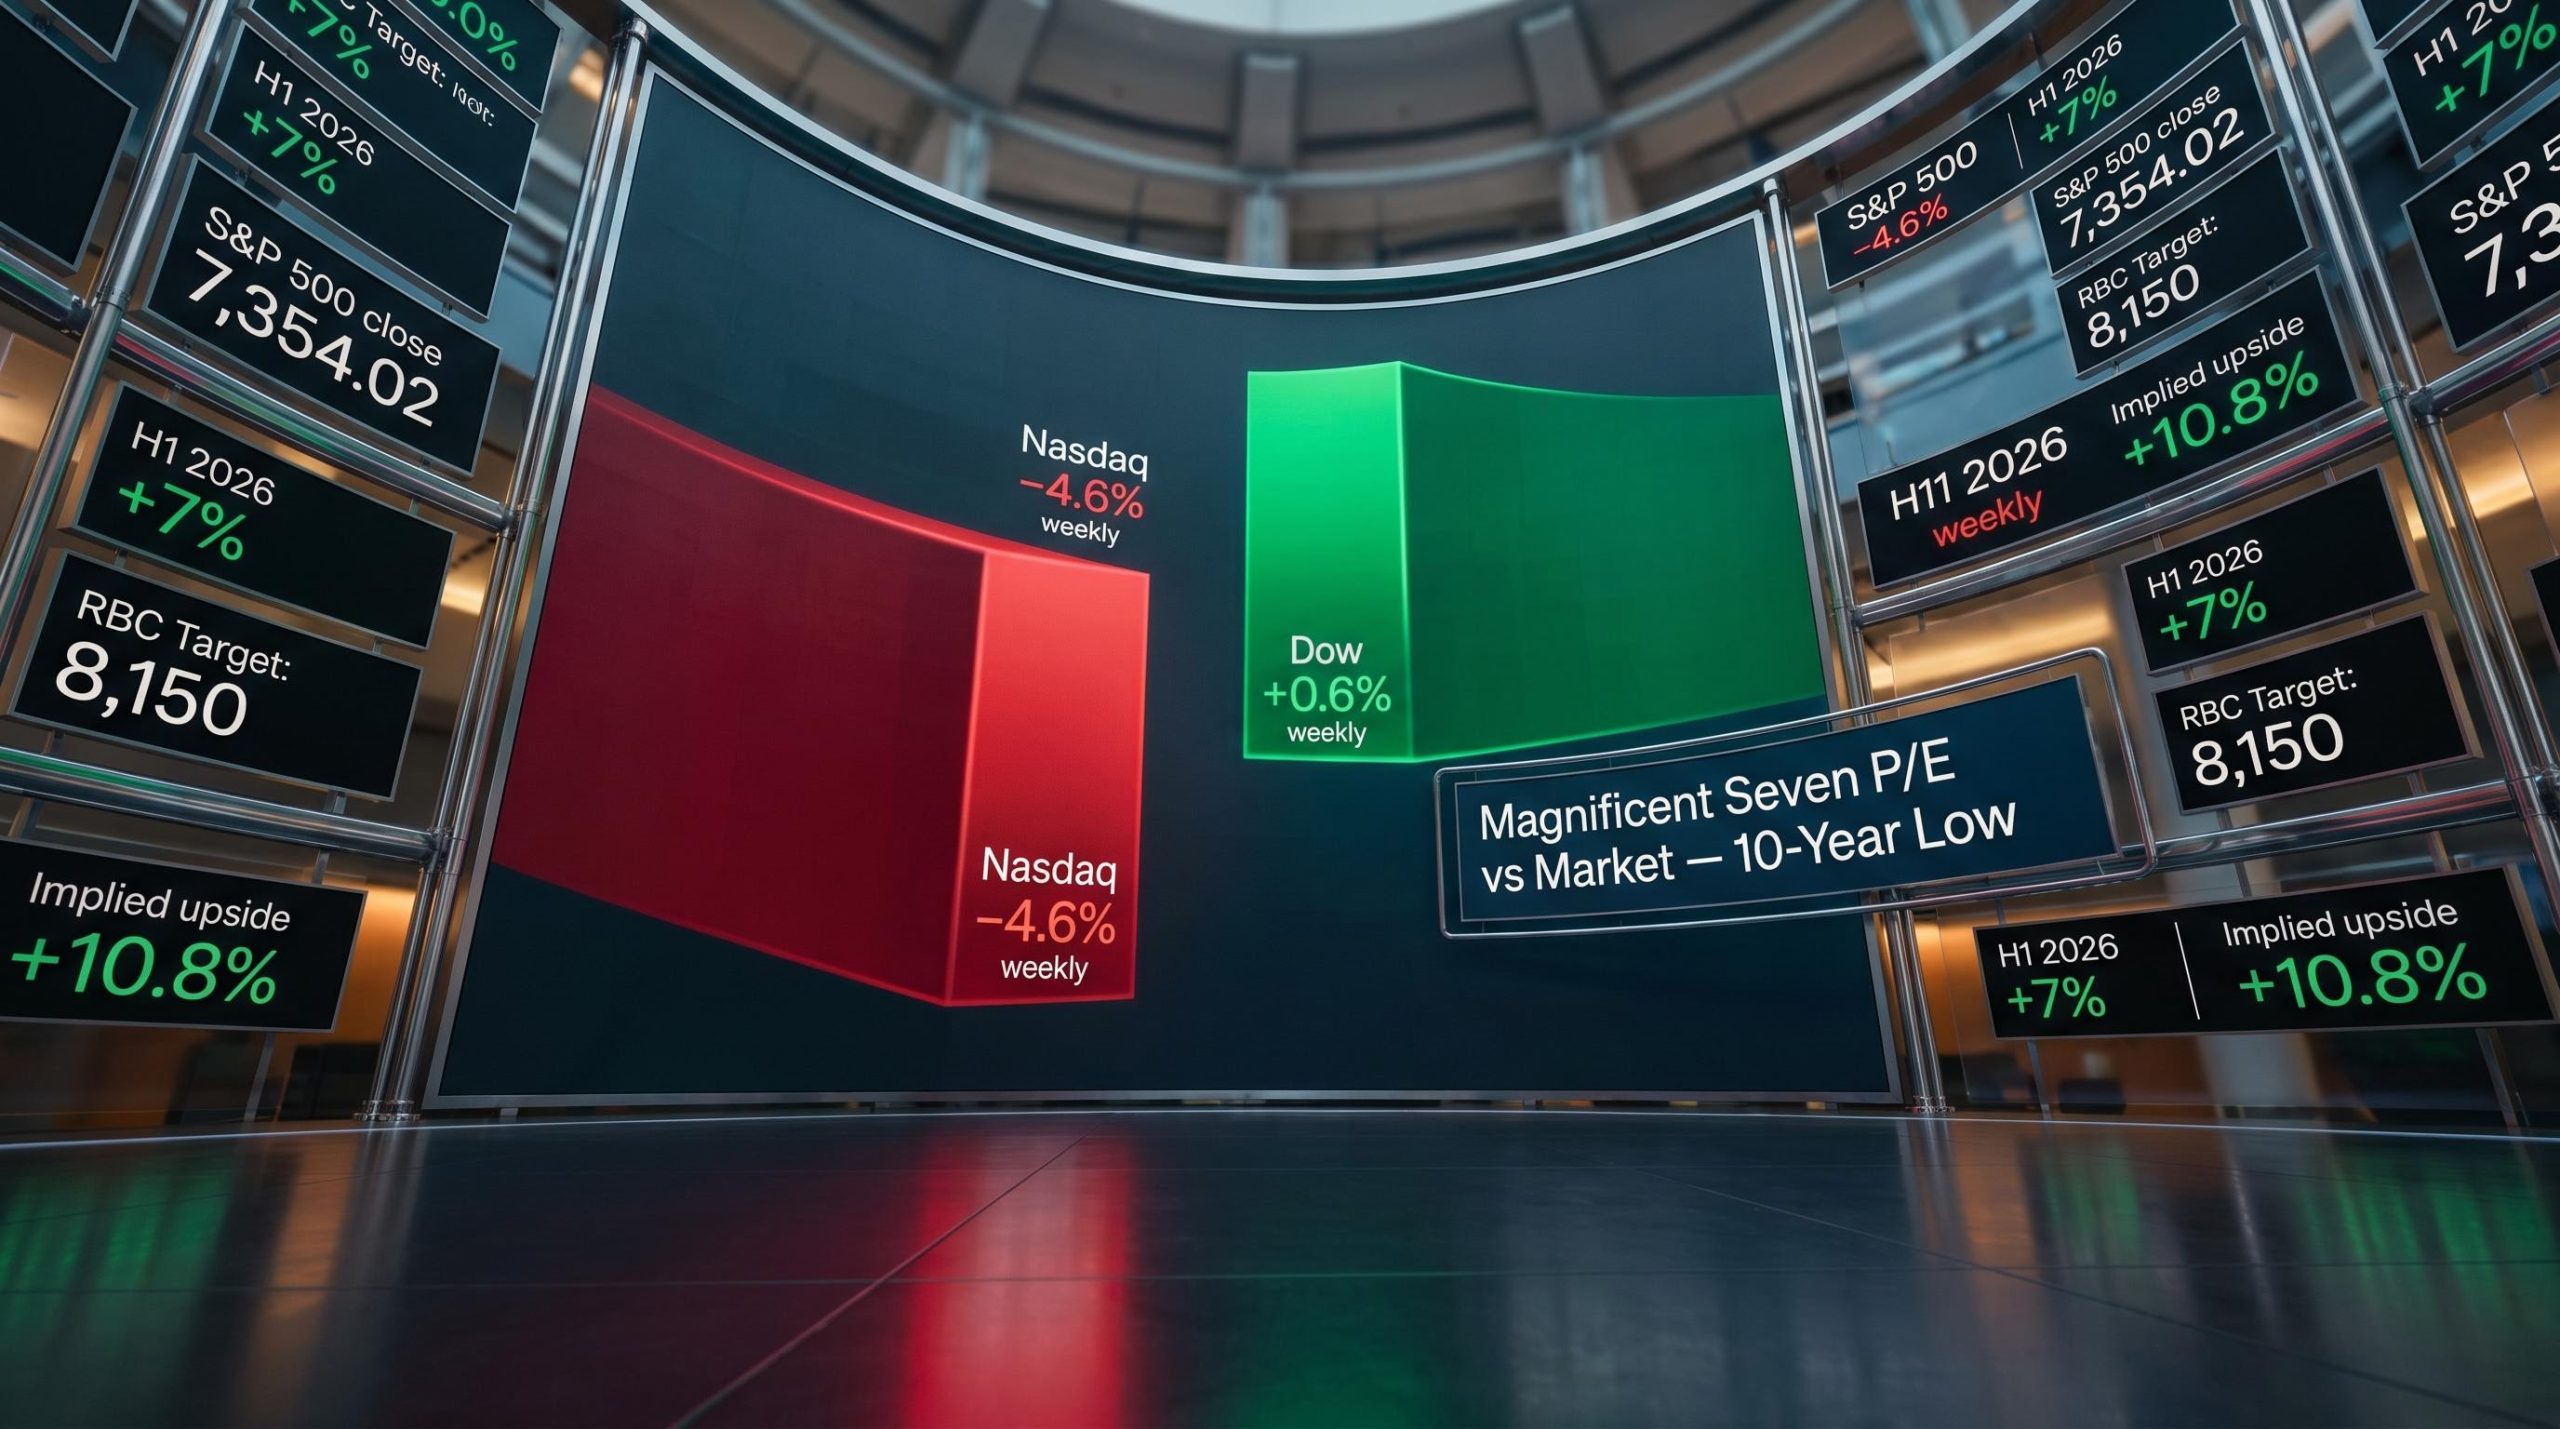
In 2025, despite market conditions that analysts described as unusually favourable for stock pickers, 74% of Australian equity fund managers still failed to beat the S&P/ASX 200. That figure, drawn from the SPIVA Australia Year-End 2025 scorecard, exceeded the long-term historical average. It also arrived in a year when the ASX 200 Equal Weight Index outperformed its market-cap-weighted counterpart for the first time in four years, meaning the breadth of returns should have given active managers more room to operate, not less.
The active versus passive investing debate sits at the centre of how millions of Australians invest their superannuation and personal savings. With passive funds now representing approximately 40% of Australian managed funds, and with active exchange-traded funds (ETFs) reshaping how both strategies are distributed, the stakes of this question have never been higher for everyday investors.
What follows explains what the data actually shows about active fund performance across asset classes, why the underperformance is structural rather than cyclical, where the exceptions genuinely exist, and what this means for Australians making real allocation decisions.
The headline is bad. The long-term picture is worse.
In 2025, 74% of Australian Equity general funds underperformed the S&P/ASX 200, according to the SPIVA Australia Year-End 2025 scorecard. That one-year figure exceeded the long-term historical average of approximately 60%, and it arrived in conditions active managers typically describe as their best operating environment: elevated stock-level dispersion across both Australian and global markets, where individual stock selection should theoretically reward skill.
Sue Lee, S&P DJI APAC Head of Index Investment Strategy: “Despite a generally favourable environment for stock selection, 74 per cent of Australian Equity general funds underperformed the S&P/ASX 200.”
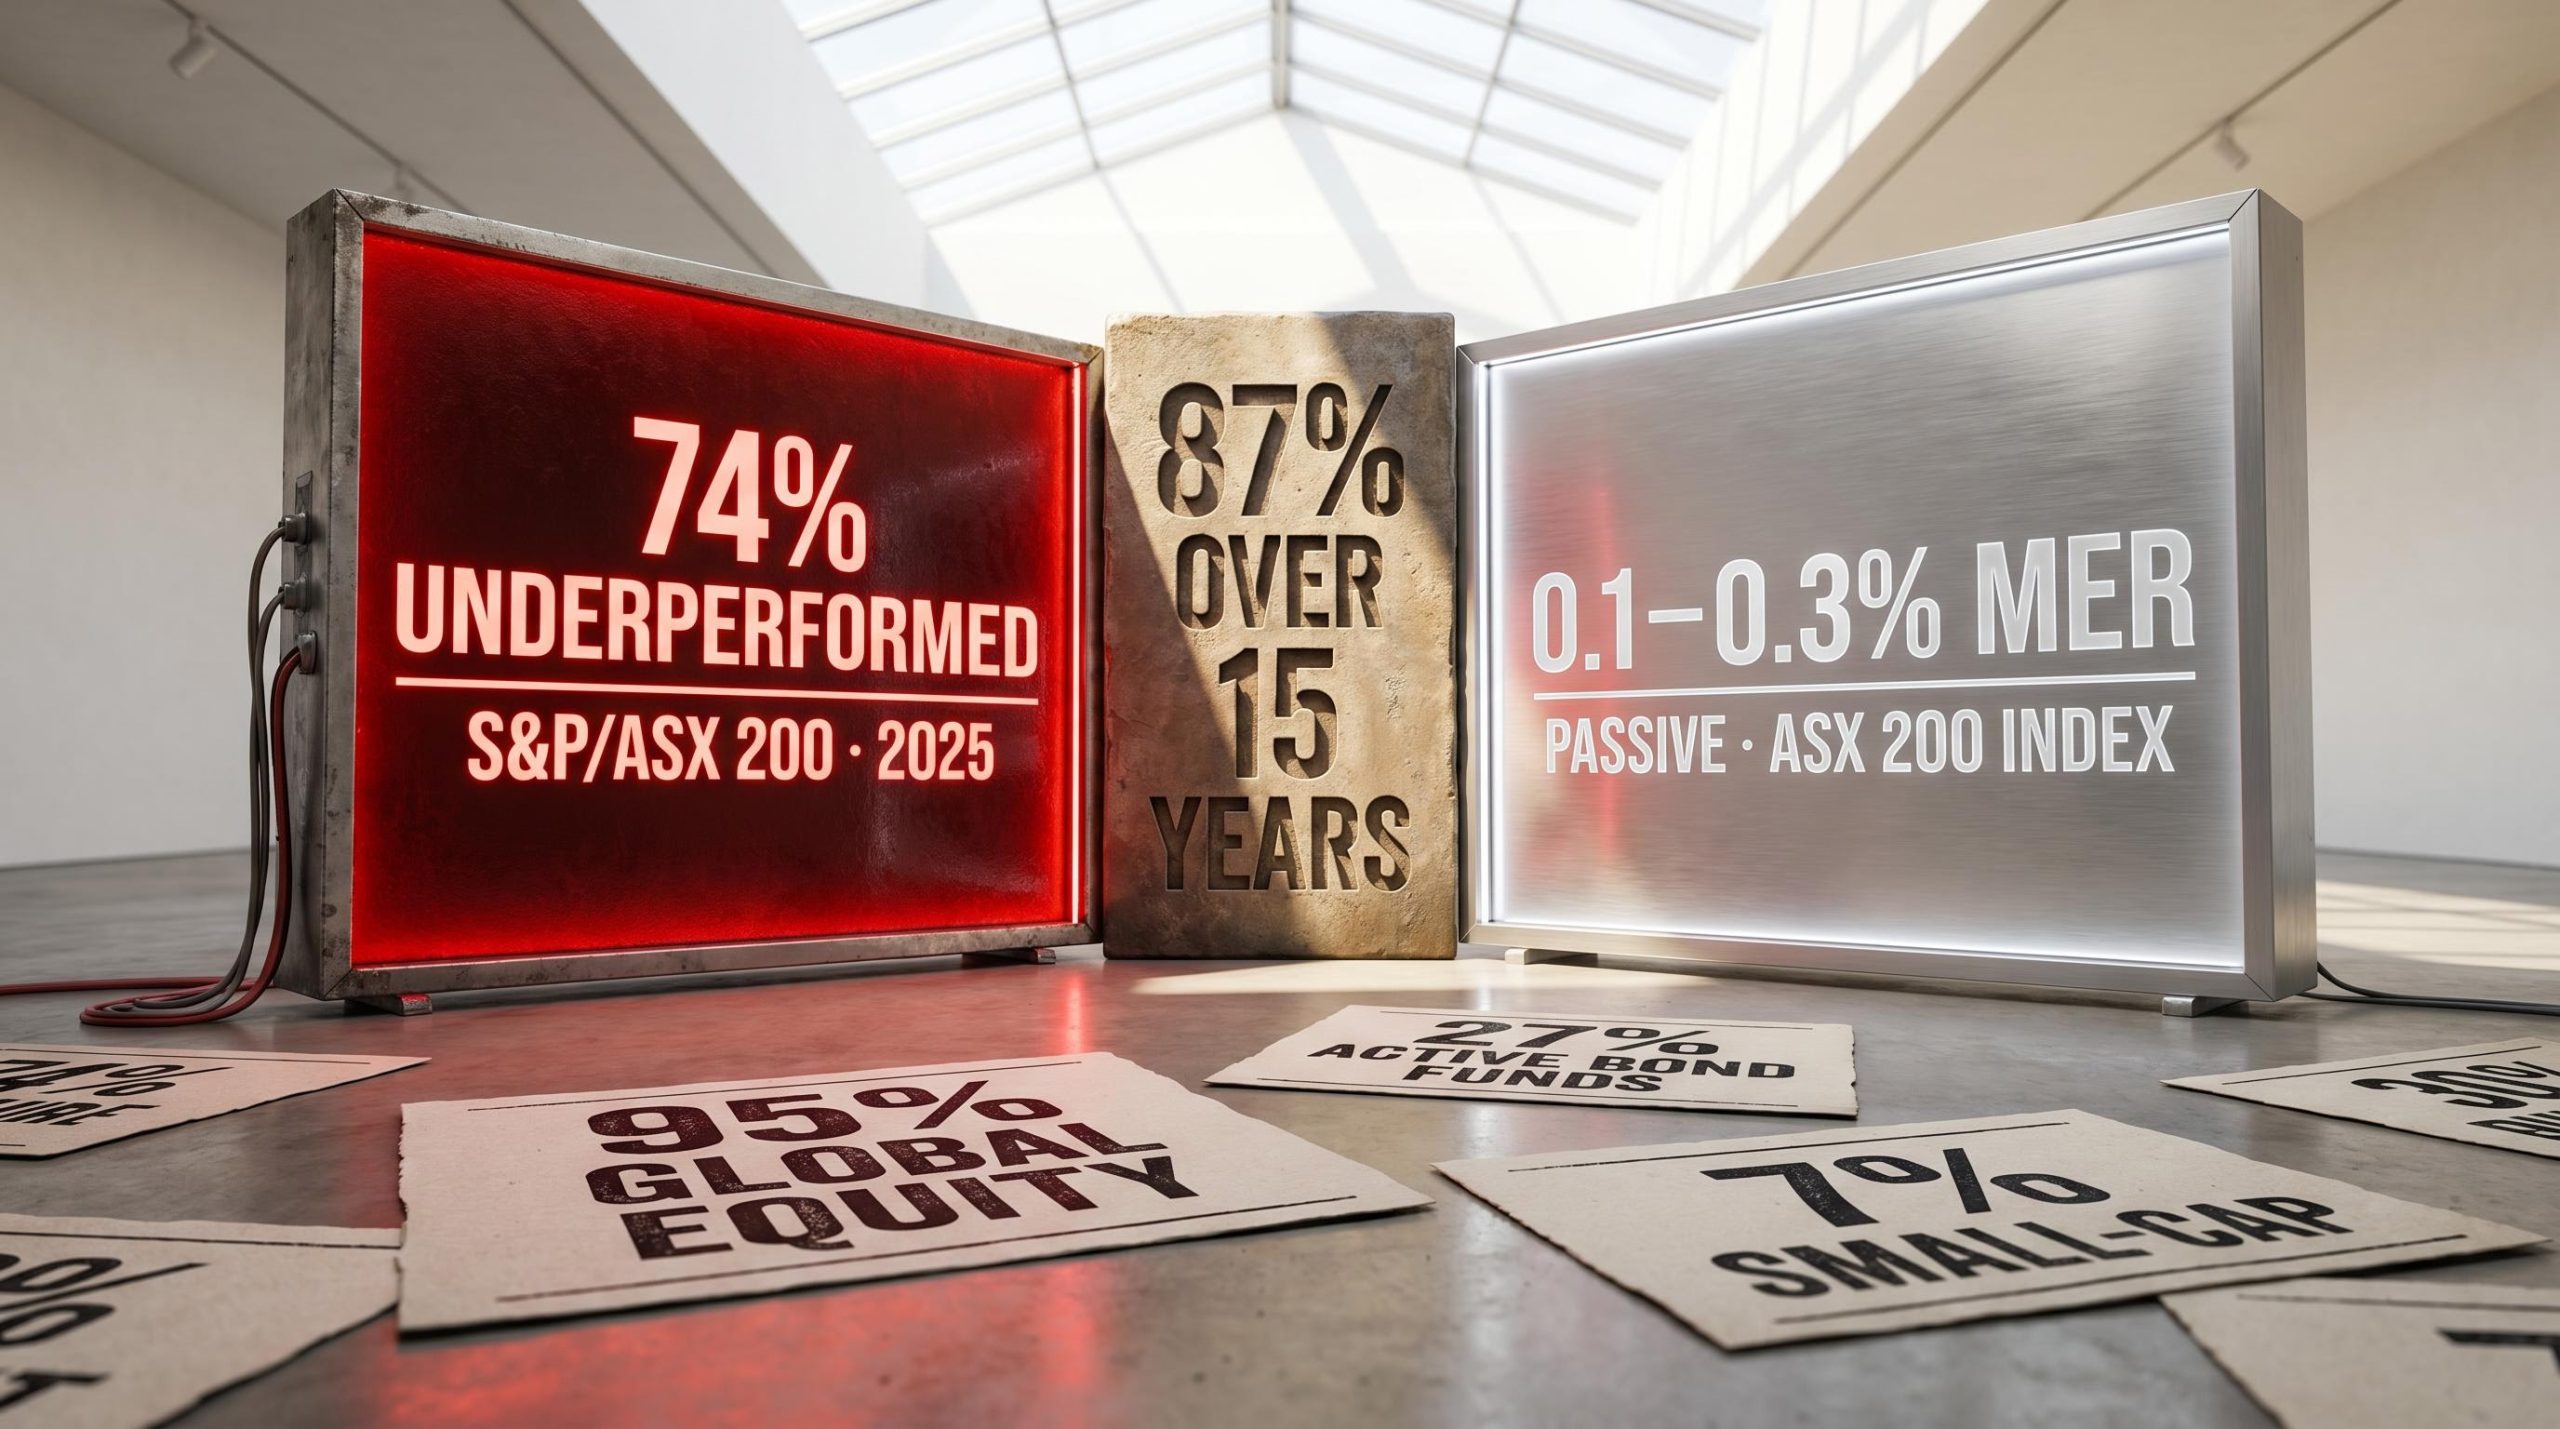
Extend the time horizon and the numbers escalate. Over 15 years, 87% of Australian Equity general funds underperformed. For Global Equity general funds, the 15-year underperformance rate reached 95%, meaning only one in twenty global equity managers delivered net returns above their benchmark over that period.
| Category | 2025 Underperformance Rate | 15-Year Underperformance Rate | Key Observation |
|---|---|---|---|
| Australian Equity General | 74% | 87% | Exceeded historical average in a year favouring stock selection |
| Global Equity General | 70% | 95% | Near-total long-term underperformance |
| Australian Equity A-REITs | 40% | 88% | Lowest single-year rate since 2013; long-term rate still severe |
| Active Bond Funds | 27% | N/A | Majority of active bond managers outperformed in 2025 |
For Australian investors, these figures are not abstract. They describe the most likely outcome of paying active management fees inside superannuation or a personal portfolio. The severity worsens at every time horizon, which directly challenges the common defence that active managers simply need “more time” to prove themselves.
The definitions are straightforward. The cost gap between them is where the real story begins.
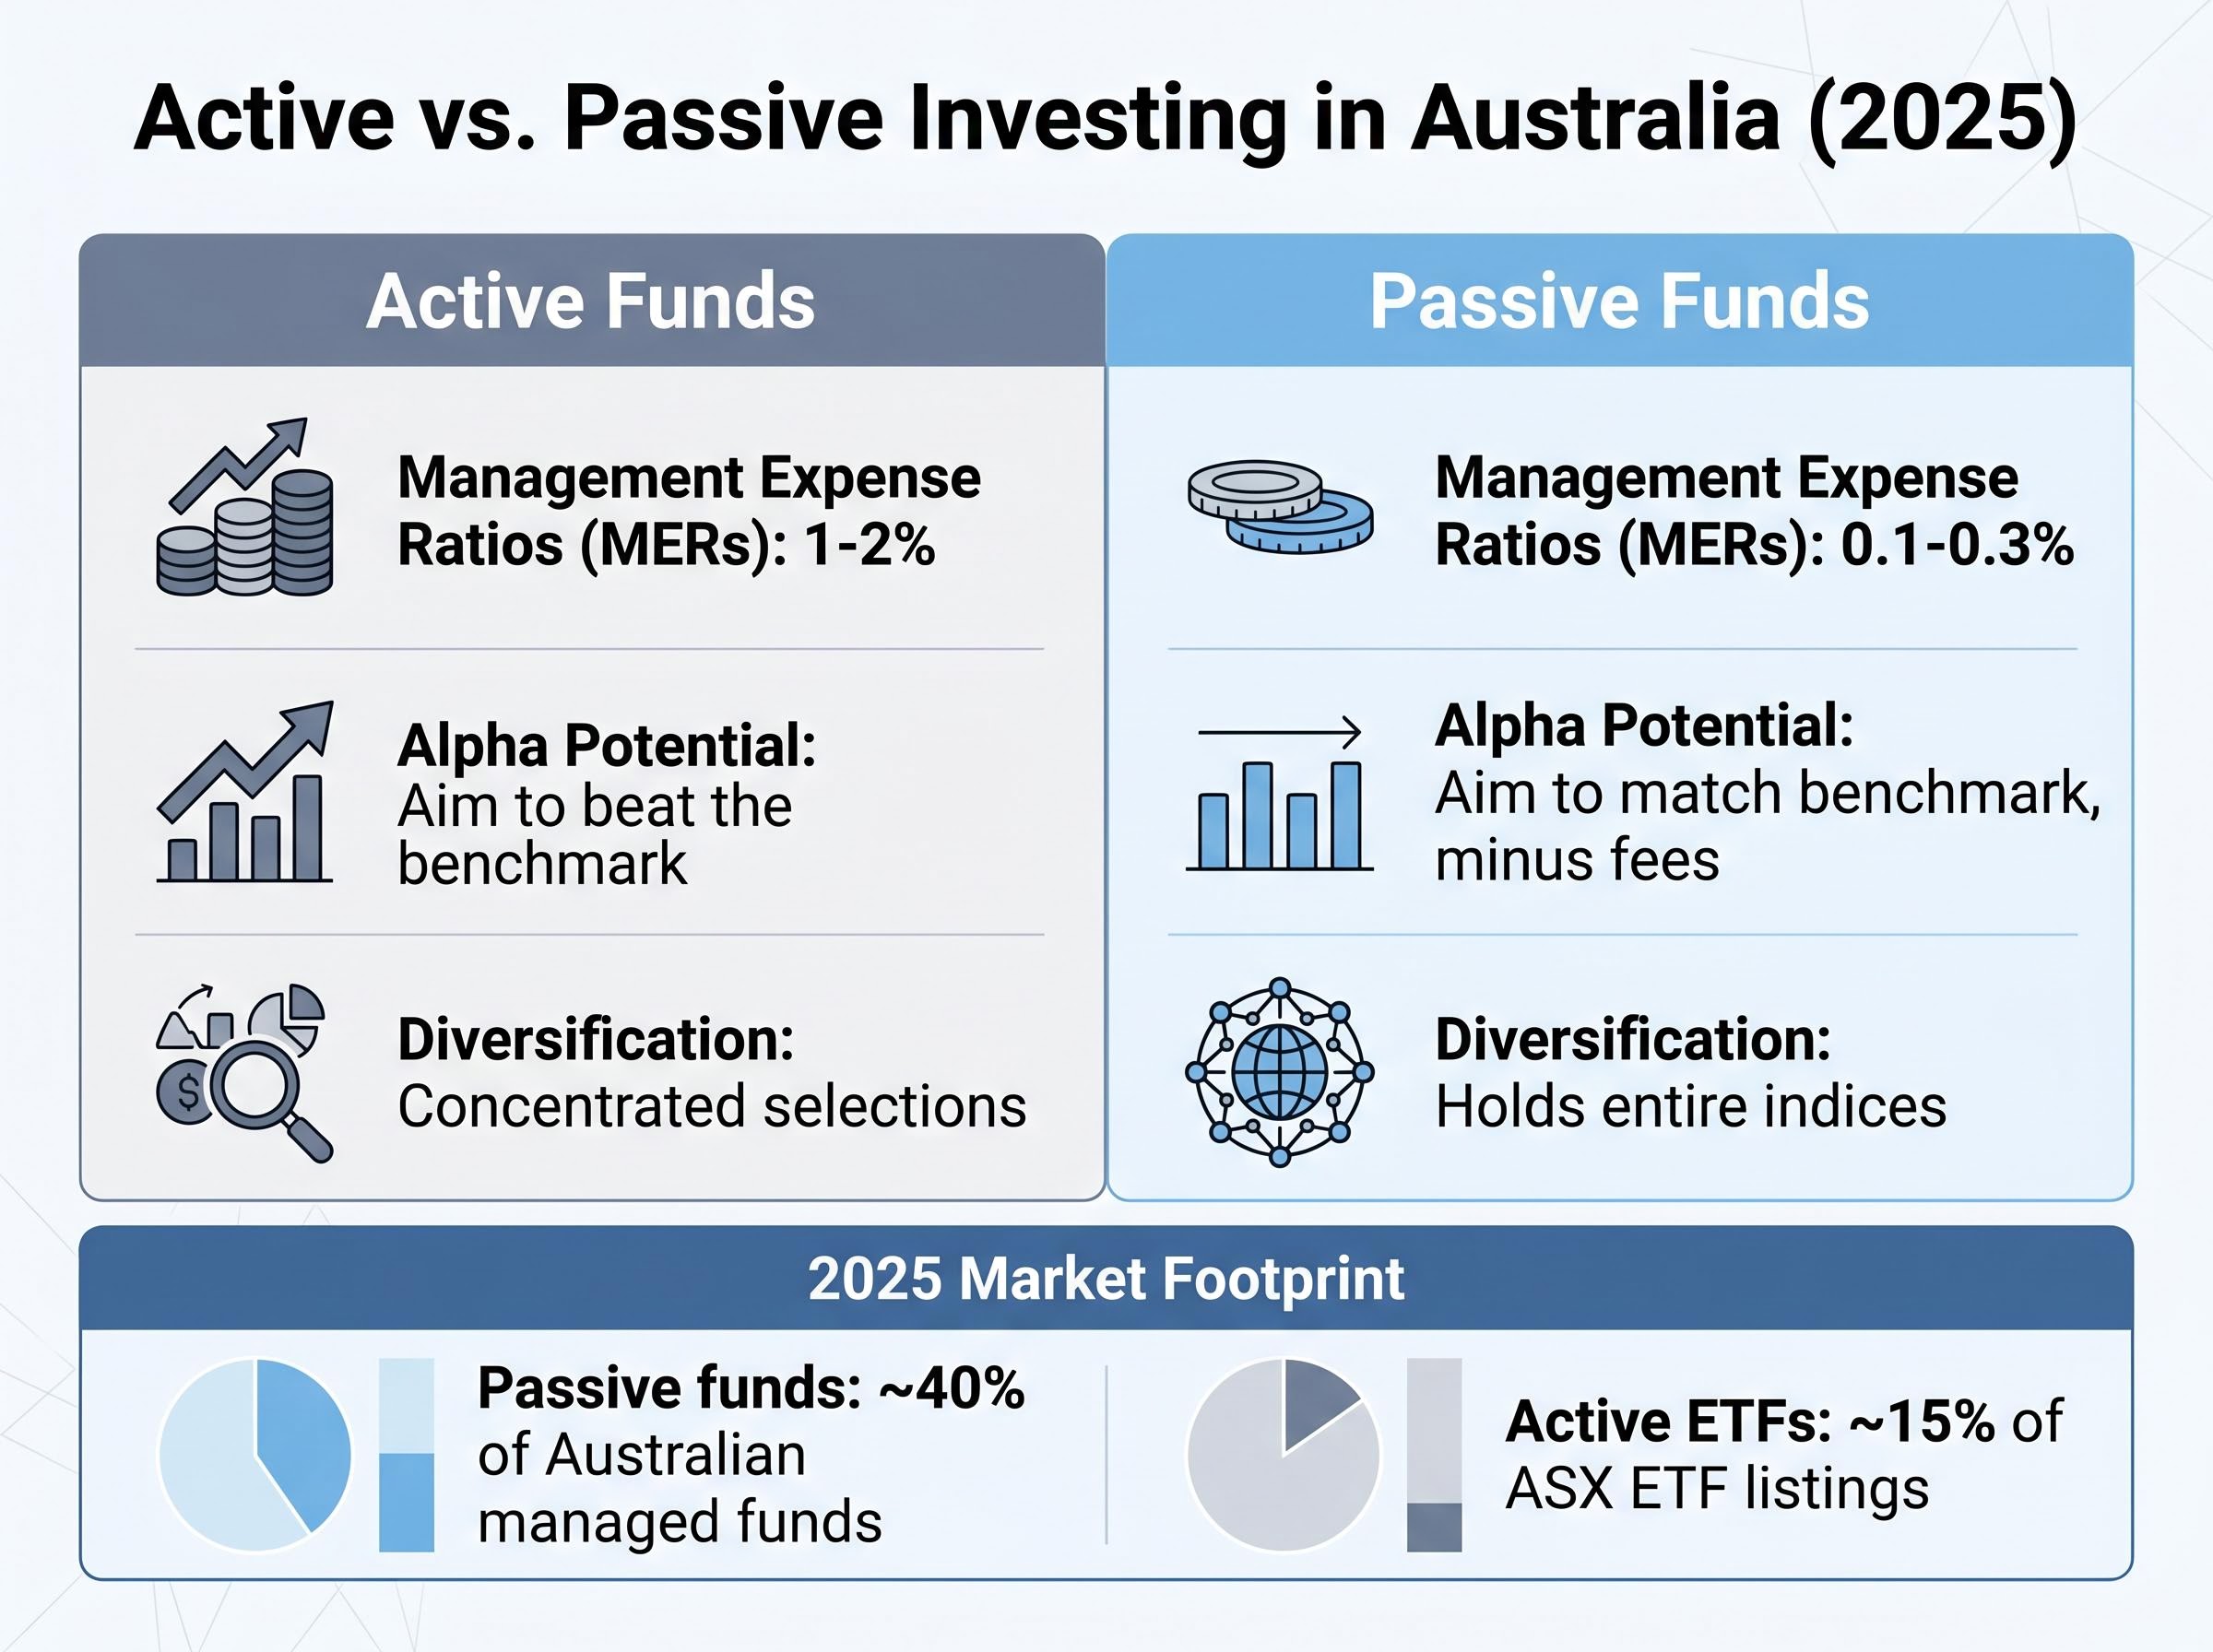
Active investing involves fund managers selecting individual stocks with the goal of outperforming a benchmark index. In Australia, active funds typically carry management expense ratios (MERs) of 1-2%. Passive investing tracks a market index, such as the ASX 200, without attempting to outperform it. Passive vehicles, primarily ETFs and index funds, carry MERs of 0.1-0.3% in Australia.
The structural differences between the two approaches extend beyond fees:
As of 2025, passive funds represent approximately 40% of Australian managed funds, while active ETFs account for approximately 15% of ASX ETF listings. ASIC MoneySmart (moneysmart.gov.au) provides the most accessible Australian regulatory guidance on both fund types.
A 1.5% annual management fee may appear modest in isolation. Compounded over 20 years, it is not.
At that rate, an active manager must outperform their benchmark by at least 1.5% every year before the investor sees any net gain. That hurdle compounds: each year the manager fails to clear it, the investor falls further behind the equivalent passive return. Australian superannuation funds commonly blend active and passive strategies, meaning investors may be paying a blended fee rate without clear visibility into which portion is actively managed and what benchmark it is measured against.
The compounding toll of active management fees becomes concrete when measured against a specific passive alternative: the Magellan MHG fund delivered 6.6% annualised over five years while IOO returned 19.8% annualised over the same period, a gap of roughly 13 percentage points per year before accounting for the additional cost burden absorbed by active investors.
The underperformance numbers are severe, but they are also predictable. Four structural forces explain why.
The 80% fund closure rate over 15 years means the SPIVA figures, as severe as they appear, likely understate the true failure rate. The funds that disappeared were disproportionately the ones that failed.
Michael Jensen’s foundational research in the 1960s was the first systematic demonstration that most fund managers failed to deliver even basic market exposure on a net-of-fee basis. More than half a century later, the structural causes he identified remain intact.
Jensen’s 1968 Journal of Finance study was the first systematic large-sample demonstration that mutual fund managers, after fees, failed to deliver returns above what could be explained by market exposure alone, establishing the empirical baseline that subsequent decades of SPIVA data have continued to confirm.
These four forces are not correctable by selecting a “better” active manager. They are features of how active management operates as an industry.
The language used to describe active super fund investment strategy often obscures what is actually happening: AustralianSuper’s outgoing CIO admitted in March 2026 that the fund missed significant gains by underweighting AI and digital stocks from approximately 2022, a real cost borne by members that illustrates how institutional active management faces the same structural headwinds as retail fund managers.
The evidence is clear at the aggregate level. Translating it into individual portfolio decisions requires addressing three Australian-specific realities.
The first is superannuation structure. Australian super funds commonly blend active and passive strategies within a single investment option. Members may be paying a blended fee rate without clear visibility into which portion is actively managed, what benchmark it is measured against, or whether the active component is adding value net of fees.
The second is home bias. Many Australian investors hold a disproportionate share of domestic equities, often rationalised by the historical strength of Australian dividend yields (approximately 4-5% gross compared to approximately 2% for global equities) and familiarity with franking credits. The cost of this concentration is measurable: the ASX has returned approximately 9% annualised over the most recent 10-year reference period, according to Dimensional Fund Advisors internal data cited by Baru Singh, while the S&P 500 returned approximately 15% annualised over the same period.
The cost of ASX home bias is not just an allocation preference, it is a compounding return shortfall: the S&P 500 returned 16.03% per year in Australian dollar terms over 15 years to April 2026, compared to 8.62% for the ASX 300, a divergence driven by the index’s structural concentration in financials and materials rather than the technology-driven reinvestment that powered US returns.
A portfolio with 60% ASX 300 exposure holds a larger position in Commonwealth Bank than in all emerging market equities combined, despite emerging markets representing approximately 40% of global GDP.
The third reality is manager selection risk. Identifying in advance which active managers will outperform is itself an exercise with poor historical reliability. The skill required is not only the manager’s skill in selecting stocks but the investor’s skill in selecting the manager.
Before choosing an active fund, three questions clarify whether the fee is likely to be justified:
Financial advice, cited by practitioners including Dimensional Fund Advisors’ Australian CEO, serves as a safeguard against reactive behaviour during market stress, particularly during sharp drawdowns when the temptation to abandon a strategy is strongest.
The headline evidence runs overwhelmingly against active management. The exceptions, however, are genuine, and they sharpen the picture rather than blurring it.
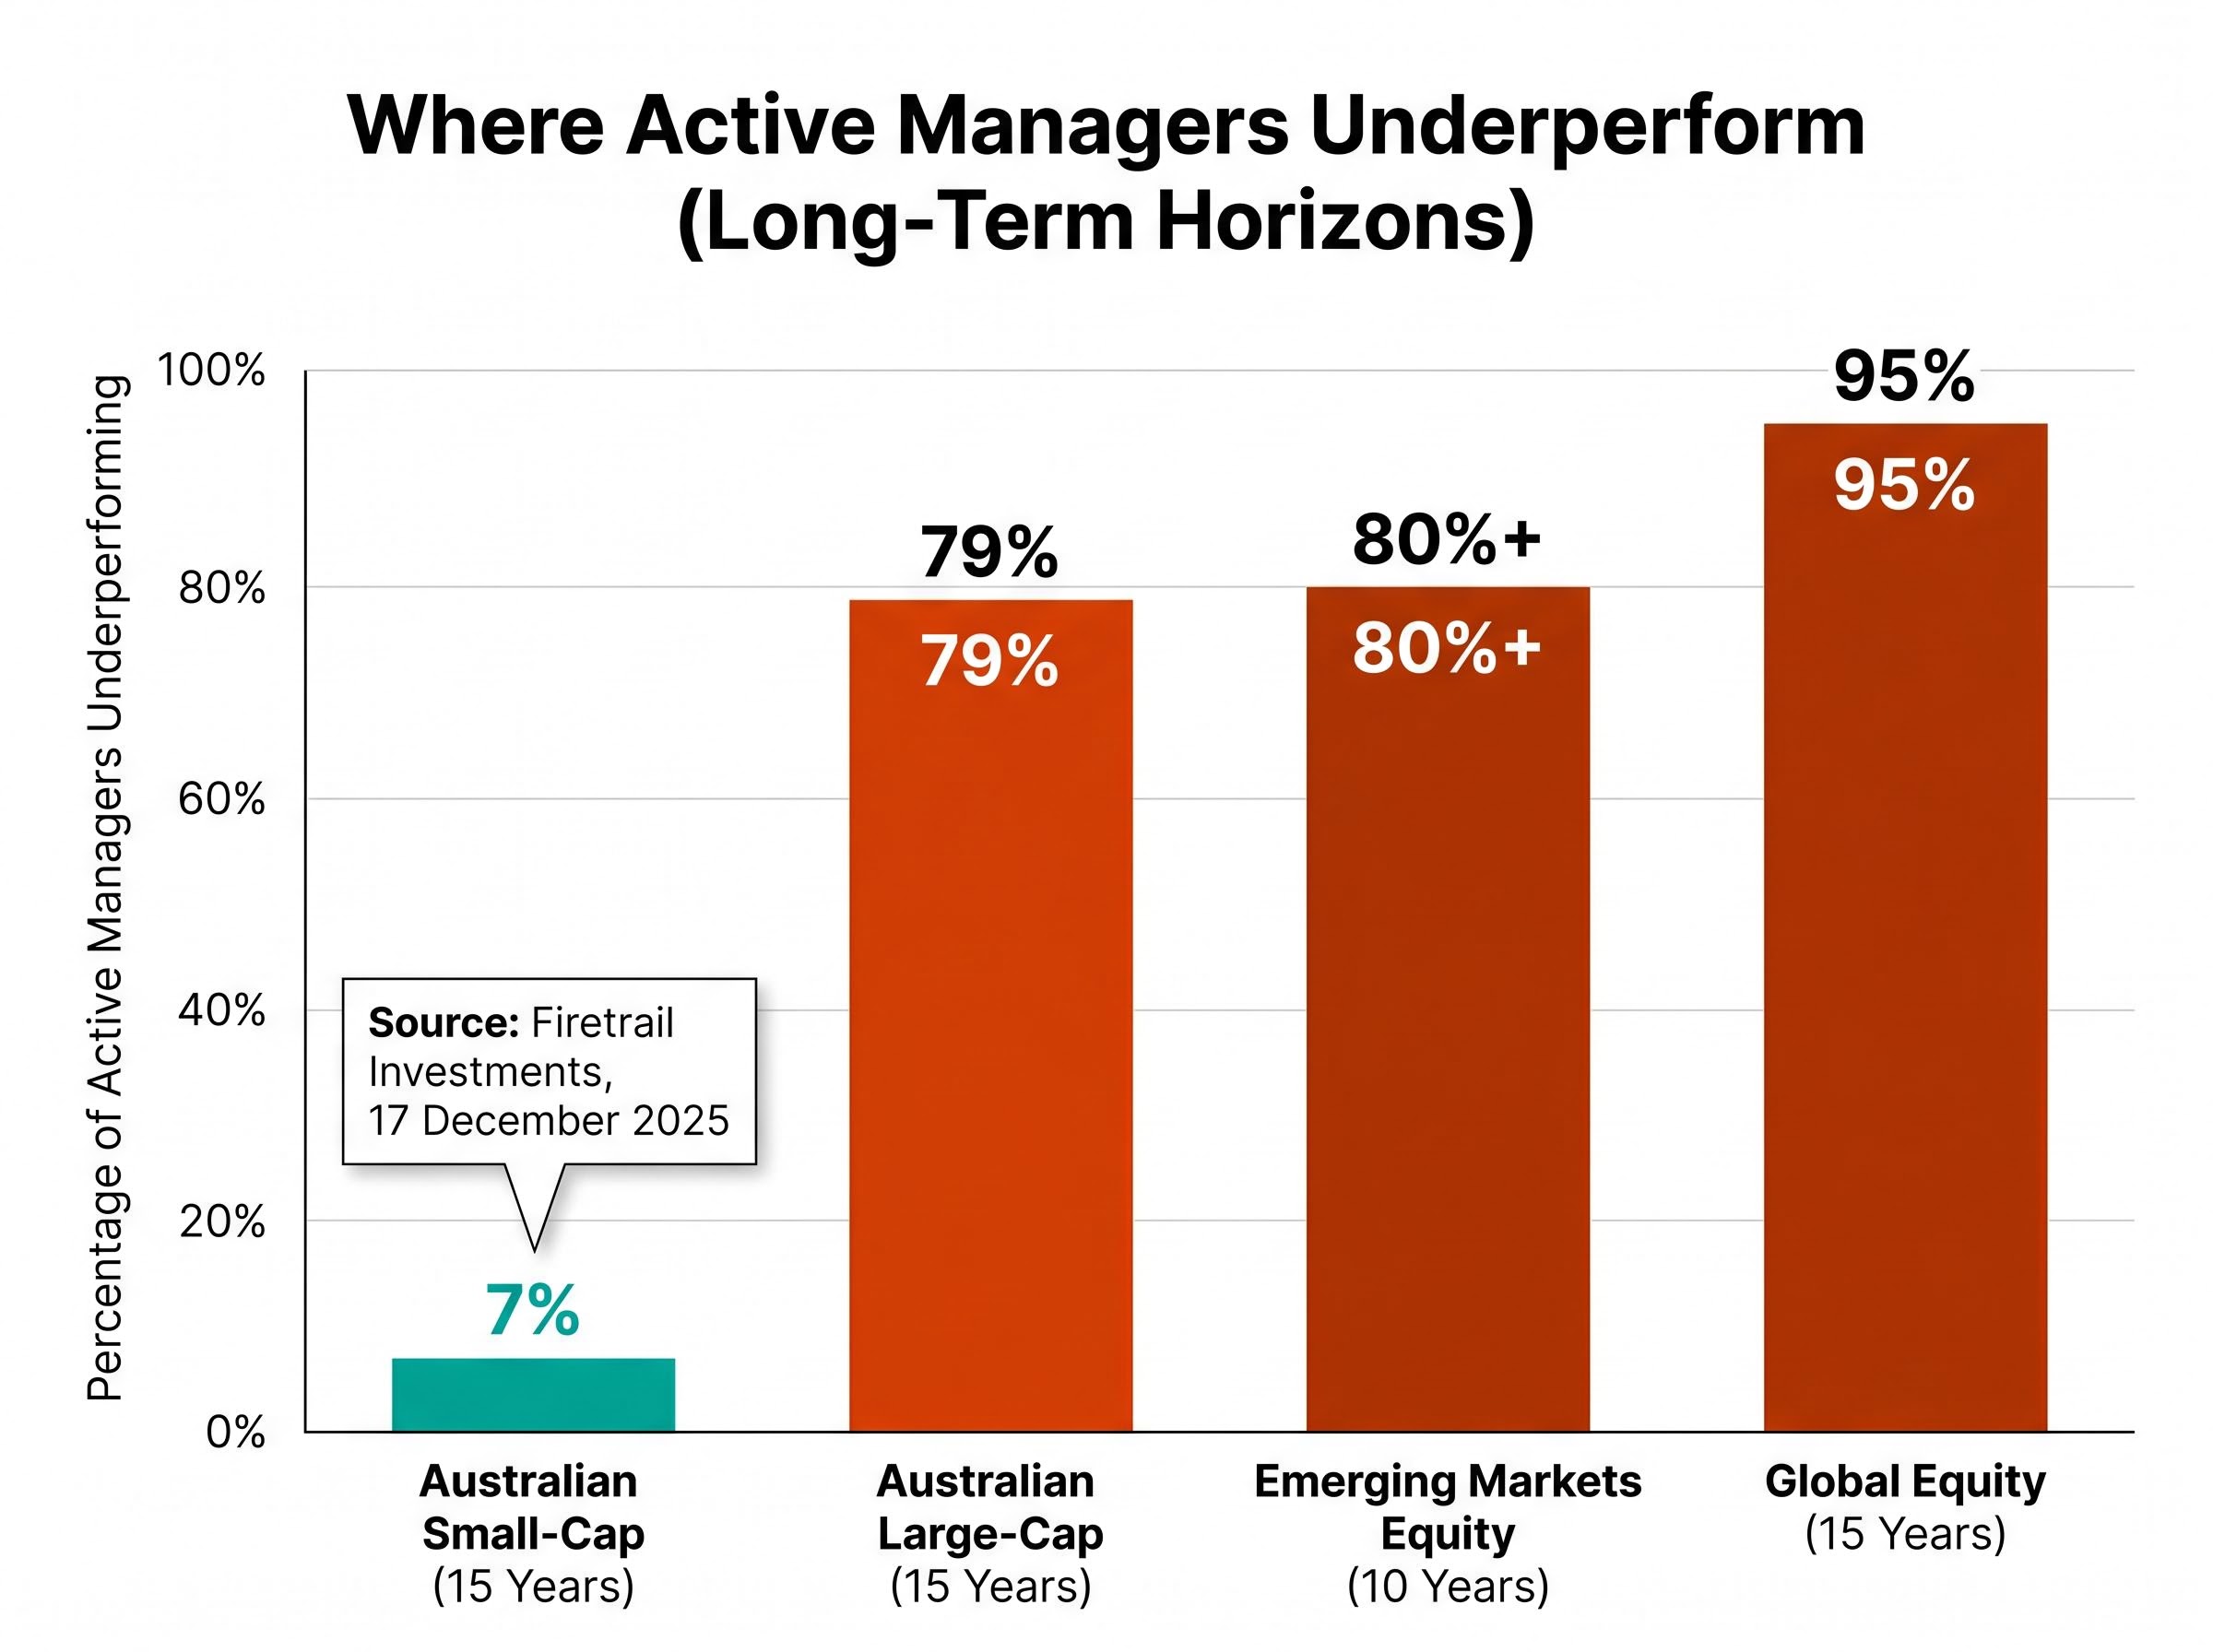
Australian small-caps represent the strongest counter-evidence. According to analysis published by Firetrail Investments on 17 December 2025, only 7% of Australian small-cap active managers underperformed the Small Ordinaries Index over 15 years. The same analysis showed 79% of large-cap active managers underperformed the ASX 200 over the same period.
The gap is enormous, and the structural explanation is clear. Small-cap markets attract less passive capital, receive less analyst coverage, and offer greater information asymmetry. These are the conditions where individual research and stock selection have the most room to generate alpha that persists after fees.
Active bond funds present a second exception. In 2025, only 27% of active bond managers underperformed their benchmark for the full year, meaning the majority outperformed. Fixed income markets, with their complexity around duration positioning, credit quality analysis, and yield curve dynamics, appear to offer more persistent opportunities for skill than listed equity markets.
Australian Equity A-REITs produced an outlier result in 2025, with only 40% of active managers underperforming, the lowest rate since 2013. The 15-year underperformance rate of 88%, however, cautions against reading too much into a single year.
| Segment | Timeframe | Underperformance Rate | Key Driver |
|---|---|---|---|
| Australian Large-Cap | 15 years | 79% | Passive inflow concentration in mega-caps |
| Australian Small-Cap | 15 years | 7% | Low analyst coverage, less passive capital |
| Active Bond Funds | 2025 (full year) | 27% | Duration and credit complexity favours skill |
| A-REITs | 2025 (full year) | 40% | Lowest since 2013; long-term rate remains 88% |
| Global Equity | 15 years | 95% | Efficient large-cap markets; high fee drag |
| Emerging Markets Equity | 10 years | 80%+ | Contradicts “complex markets favour active” argument |
SPIVA data also shows over 80% of active emerging market equity managers and over 85% of international small- and mid-cap active managers underperform over 10-year periods. This directly contradicts the commonly held view that less efficient or more complex markets universally favour active skill.
Survivorship bias affects the small-cap data as well. Funds that closed during the 15-year measurement period are excluded from historical comparisons, which skews the surviving sample toward better performers. Firetrail explicitly acknowledges this limitation in its own analysis, noting that the 7% figure “may be affected by survivorship bias, as underperforming managers are more likely to close or merge over time.”
The small-cap exception is real, but its magnitude may be overstated by the data that survives.
For investors wanting to understand why the small-cap active management exception may be narrowing over time, our full explainer on small-cap quality and private capital examines how venture capital and private equity are systematically removing the highest-quality small-cap companies from public markets, leaving passive small-cap indexes increasingly concentrated in unprofitable firms.
Across the broadest measures and longest time horizons, active management underperforms its benchmarks for the majority of managers. The underperformance worsens as the time horizon extends. This finding is consistent across geographies, across the SPIVA Australia Year-End 2025 scorecard, and across more than five decades of academic research dating to Michael Jensen’s original work.
The exceptions are genuine. Australian small-cap equities and fixed income represent asset classes where active skill has a structural opportunity to express itself, supported by lower passive capital competition and greater market complexity. These exceptions do not invalidate the broader evidence; they sharpen the question from “active or passive” as a binary to “where does skill have a structural opportunity, and what are you paying for it.”
The SPIVA Australia Year-End 2025 scorecard measures active fund performance against benchmarks across Australian equity, global equity, fixed income, and property categories on both a one-year and rolling long-term basis, providing the most current and comprehensive independent dataset available for evaluating the active versus passive question in Australia.
With passive funds at approximately 40% of Australian managed assets and active ETFs growing to approximately 15% of ASX ETF listings as of 2025, the product landscape is shifting. The SPIVA Australia Year-End 2025 scorecard is the most current comprehensive assessment available; the 2026 edition had not yet been published as of May 2026.
Two independent resources provide ongoing data for investors monitoring this question:
The evidence does not tell investors what to do. It does tell them what questions to ask, which default assumptions to challenge, and where to look for independent data rather than relying on marketing narratives.
This article is for informational purposes only and should not be considered financial advice. Investors should conduct their own research and consult with financial professionals before making investment decisions. Past performance does not guarantee future results.
—
Active investing involves fund managers selecting individual stocks to beat a benchmark index, typically charging fees of 1-2% per year, while passive investing tracks an index like the ASX 200 using low-cost ETFs or index funds that charge around 0.1-0.3% annually.
According to the SPIVA Australia Year-End 2025 scorecard, 74% of Australian equity general funds failed to beat the S&P/ASX 200 in 2025, and over 15 years that figure rises to 87%, meaning only a small minority of managers outperform their benchmark over the long term.
Australian small-cap equities and fixed income are the strongest exceptions, with only 7% of Australian small-cap active managers underperforming the Small Ordinaries Index over 15 years, largely because lower analyst coverage and less passive capital create greater opportunities for skilled stock selection.
A 1.5% annual management fee means an active manager must outperform their benchmark by at least 1.5% every year before investors see any net gain over a passive alternative, and this hurdle compounds over time, significantly eroding returns across a 20-year superannuation horizon.
As of 2025, passive funds represent approximately 40% of Australian managed funds, while active ETFs account for approximately 15% of ASX ETF listings, reflecting a significant structural shift in how Australians access both investment strategies.