
How to Value Transition-Stage Stocks Using Tesla as a Guide
5 mins ago

A stock priced at 317x earnings is not being valued on what a company has done. It is being valued on what analysts believe it might become. Tesla in May 2026 is the clearest live example of that tension in public markets.
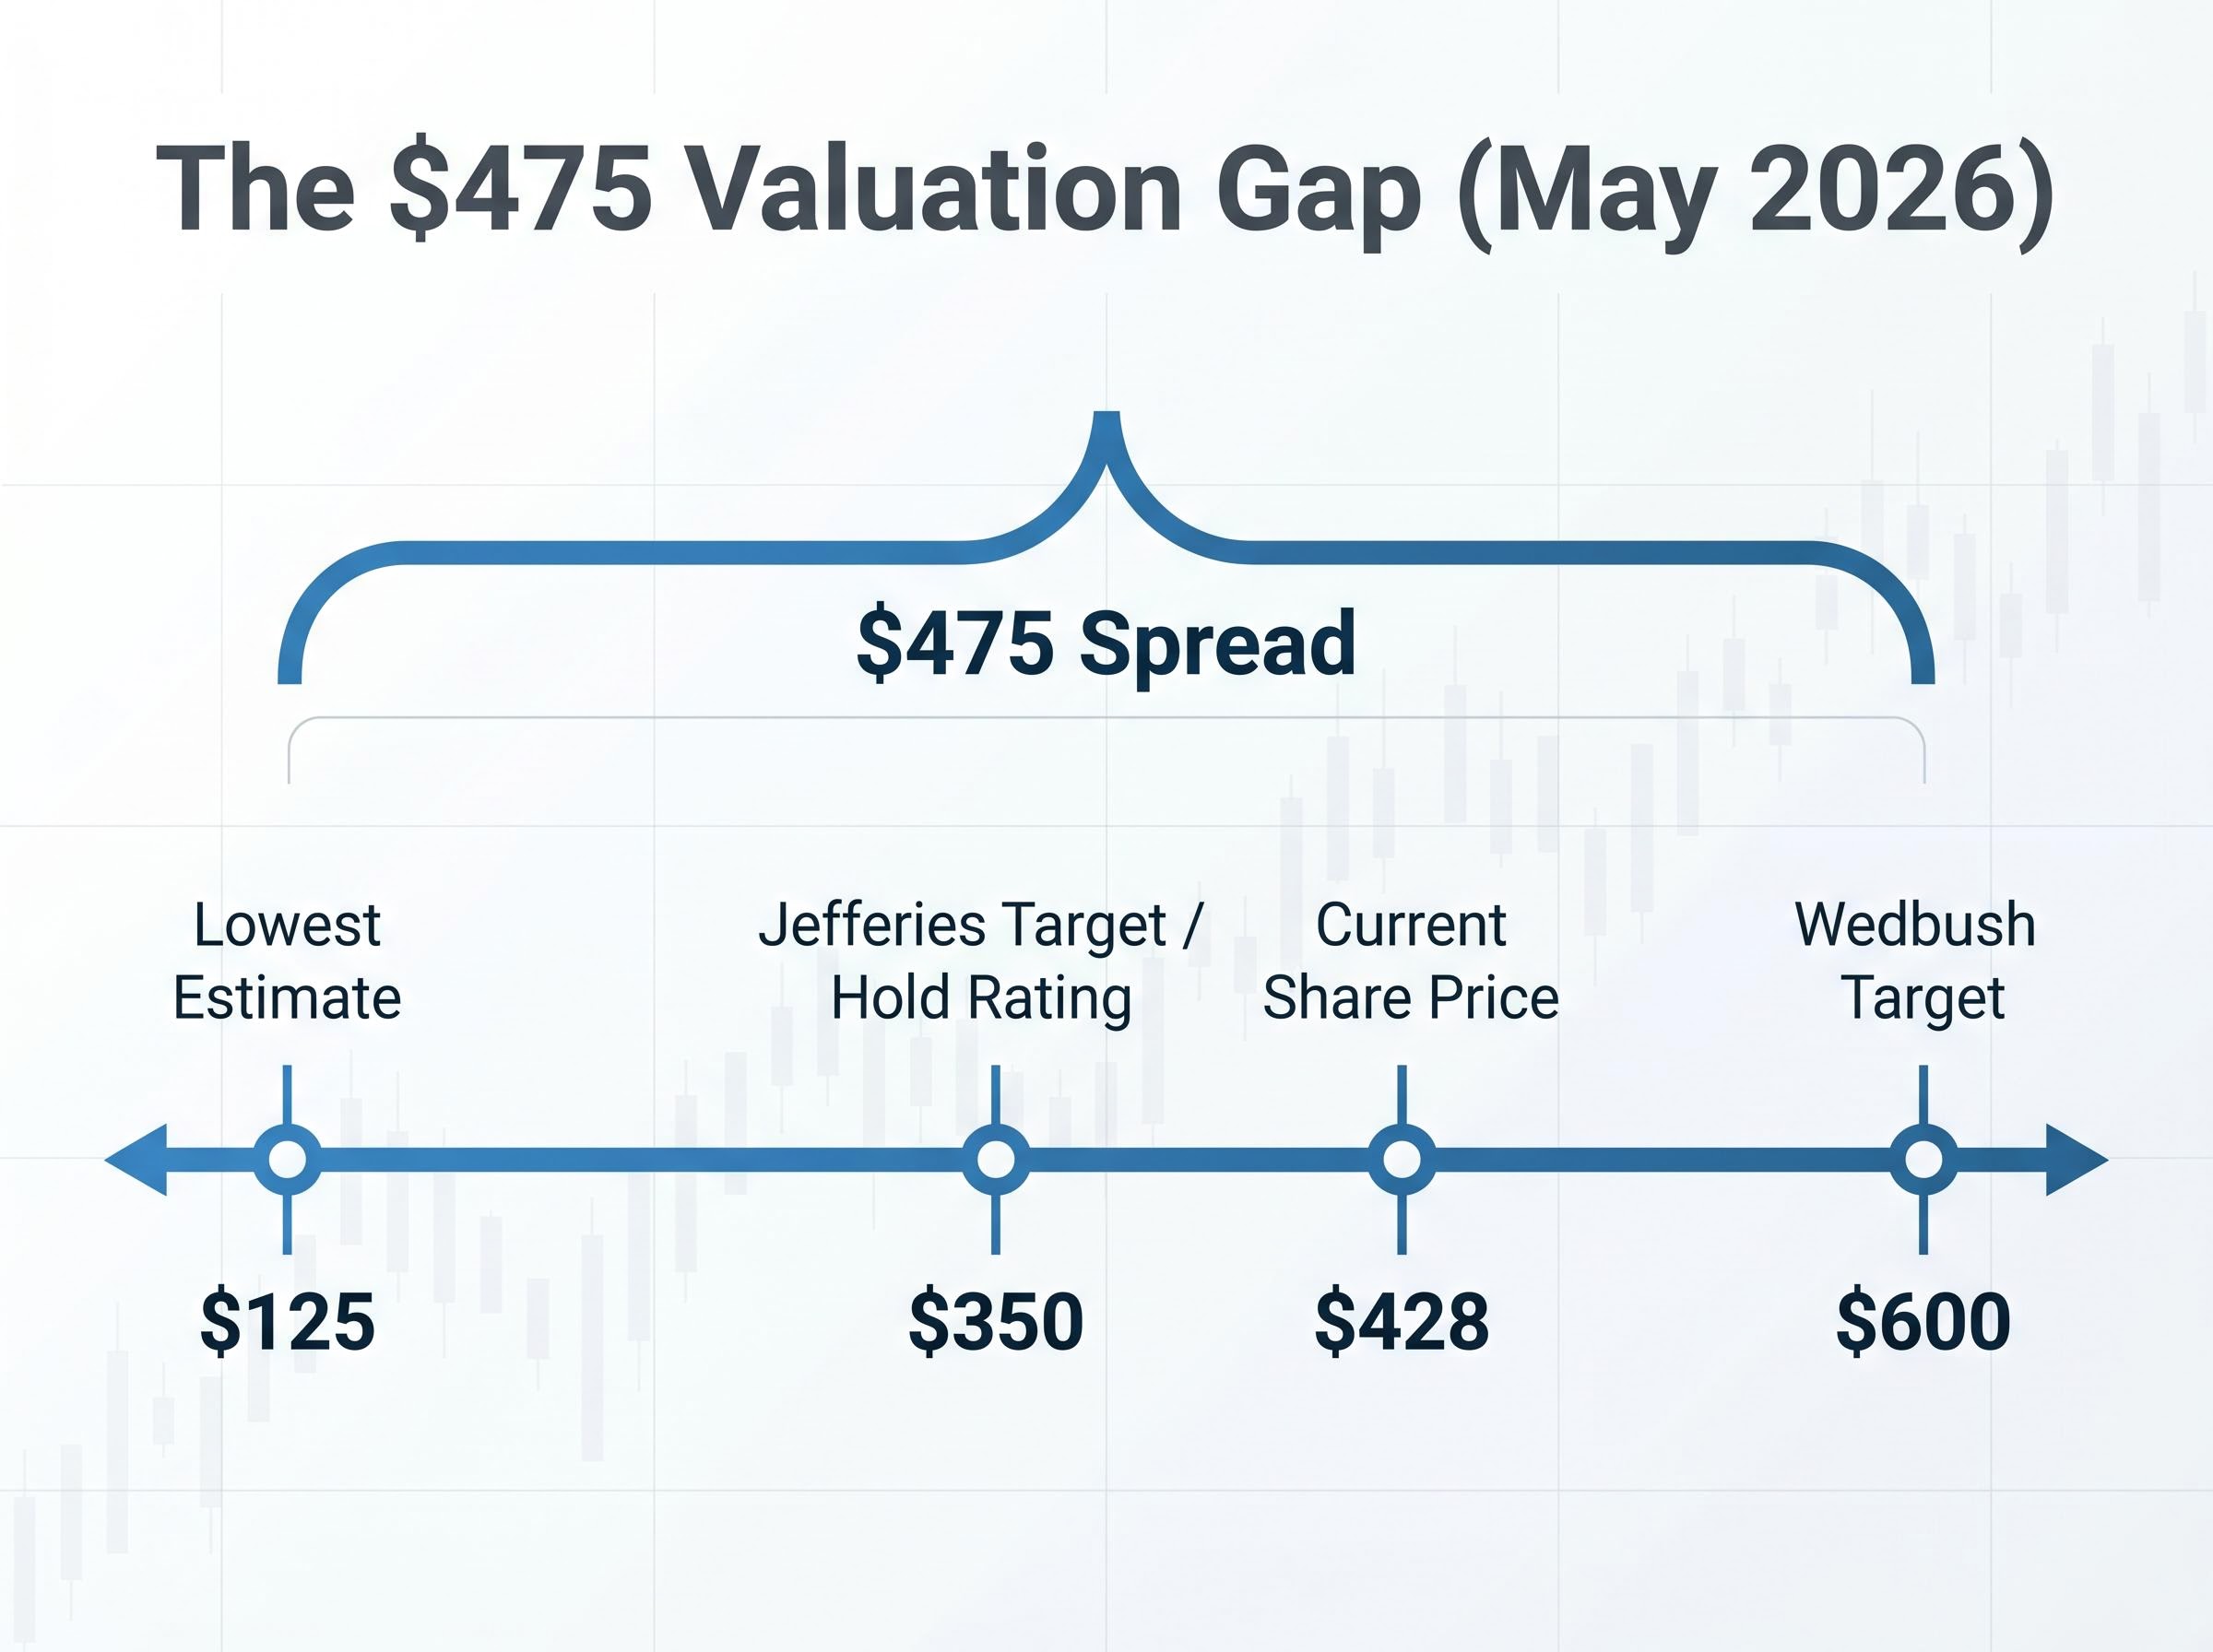
With Tesla’s Q1 2026 earnings now reported (22 April 2026), the stock sits at roughly $428 per share and analyst price targets range from $125 to $600. That $475 spread is not noise. It reflects two fundamentally incompatible models of what the company is and what it is worth. Understanding how analysts arrive at those extremes teaches investors more about stock valuation analysis than almost any single example currently available.
This guide uses Tesla’s Q1 2026 numbers and the bull-versus-bear analyst divide as a practical framework for learning how to run scenario-based valuation on any company in transition. The focus is on the variables that matter most, and on why entry price is the factor investors most often underestimate.
The first question most investors ask about a high-multiple stock is whether the growth justifies the price. That question skips a more important one: growth compared to what?
For Tesla in May 2026, the answer depends entirely on which peer set an analyst chooses. If Tesla is an automaker, its trailing price-to-earnings ratio of 317x-378x is orders of magnitude above the auto-sector average. If it is an AI-powered technology platform with recurring software revenue, the multiple looks aggressive but sits within a range that high-growth tech names have historically commanded. The peer-set choice is not a detail. It is the single variable that explains the $475 gap between the lowest and highest analyst price targets.
$125 to $600. The analyst price target range on Tesla as of early May 2026 reflects a spread of $475, one of the widest for any mega-cap stock in public markets. That spread is not disagreement about the numbers. It is disagreement about what kind of company Tesla is.
Transitional companies create this problem because their historical earnings reflect the old business while the current stock price is pricing in a future business that does not yet generate revenue at scale. The market capitalisation of approximately $1.5 trillion at $428.13 per share is not paying for the cars Tesla delivered last quarter. It is paying for autonomous driving, robotaxis, and humanoid robots.
Before selecting a peer set for any company in transition, three questions help frame the comparables problem:
Skipping this diagnostic and applying a single multiple to a transitional company will almost always produce a misleading valuation, either far too cheap or far too expensive depending on the assumption embedded in the peer set.
Peer-set selection is the foundational decision in any comparable company analysis; the choice of whether to benchmark a transitional business against its legacy sector or its aspirational category determines the multiple range before a single cash flow projection is built.
Two analysts looking at the same company, on the same date, with the same public information, can reach conclusions $475 apart. The reason is not that one is right and one is wrong. It is that three inputs, each dialled to a different setting, compound over a projection horizon to produce dramatically different per-share values.
Those three inputs are the building blocks of every forward valuation scenario: projected revenue growth rate, projected profit margin, and the valuation multiple applied to future earnings.
A revenue growth rate of 25% versus 10% does not simply produce a 15-percentage-point difference in outcome. Over a 10-year horizon, that gap compounds. Layer a margin assumption on top (is this a 30%-margin software business or a 17%-margin car manufacturer?) and the divergence widens further. Then apply the exit multiple, which is itself a function of which peer set the analyst has chosen, and the final per-share value can land anywhere on the spectrum.
Two methodologies dominate this type of analysis. A discounted cash flow (DCF) model projects future cash flows and discounts them back to today’s value; it is most appropriate when a company’s cash generation is the primary source of value. A forward price-to-earnings (P/E) model applies an earnings multiple to projected future earnings; it is more common for companies where earnings growth is the primary thesis. Both require the same three inputs. Both are only as reliable as the assumptions behind those inputs.
DCF intrinsic value estimates and market prices can diverge sharply for transformation-stage companies: AlphaSpread’s discounted cash flow model places Tesla’s intrinsic value at $70.79 per share, a figure that illustrates just how wide the gap between current cash flows and market-implied future earnings can become.
The following table uses the actual scenario inputs from Q1 2026 analyst models, not hypothetical constructs.
| Scenario | Revenue Growth (CAGR) | Net Profit Margin | Valuation Multiple | Projected 10-Year Annualised Return |
|---|---|---|---|---|
| Bull | 25%-35% | 30%+ | 25x-35x | 11%-35% |
| Bear | 5%-10% | 15%-18% | 18x-22x | Negative at $375-$428 entry |
The same company, the same date, the same public information. Two models producing outcomes at opposite ends of the investable spectrum. Once a reader understands that revenue growth, margins, and multiples are the three variables behind every price target, any analyst’s assumptions can be reverse-engineered and tested for reasonableness.
The bull case on Tesla is not about optimism. It is about conditional probability. Each milestone in the thesis depends on a prior milestone being achieved, and the stock’s current price already incorporates the assumption that most of them will materialise.
Wedbush maintains a $600 price target, the highest among major firms covering Tesla post-Q1 2026. That target requires applying a software-platform multiple to businesses that are still pre-revenue at meaningful scale, a legitimate analytical approach but one that front-loads substantial optionality into today’s price.
Wedbush’s $600 target frames Tesla as an autonomy-driven platform rather than an automaker, pricing in full-scale commercial robotaxi operations and Optimus humanoid robot revenue that has not yet begun.
Four specific milestones must materialise for the bull case to hold:
The Musk timeline pattern is worth noting as a calibration tool. In 2019, Elon Musk projected one million robotaxis by the end of 2020. In 2021, he projected Optimus would be deployment-ready by 2022. The innovations have historically materialised, but on extended timelines, which compresses annualised returns even in scenarios where the technology ultimately succeeds. A bull case projecting 35% annualised returns is only as attractive as the probability that each conditional milestone arrives on schedule.
The bear case is not pessimism. It is a disciplined reading of what the business currently produces, measured against what the stock price currently demands.
Q1 2026 delivered five operational signals that feed the bearish thesis:
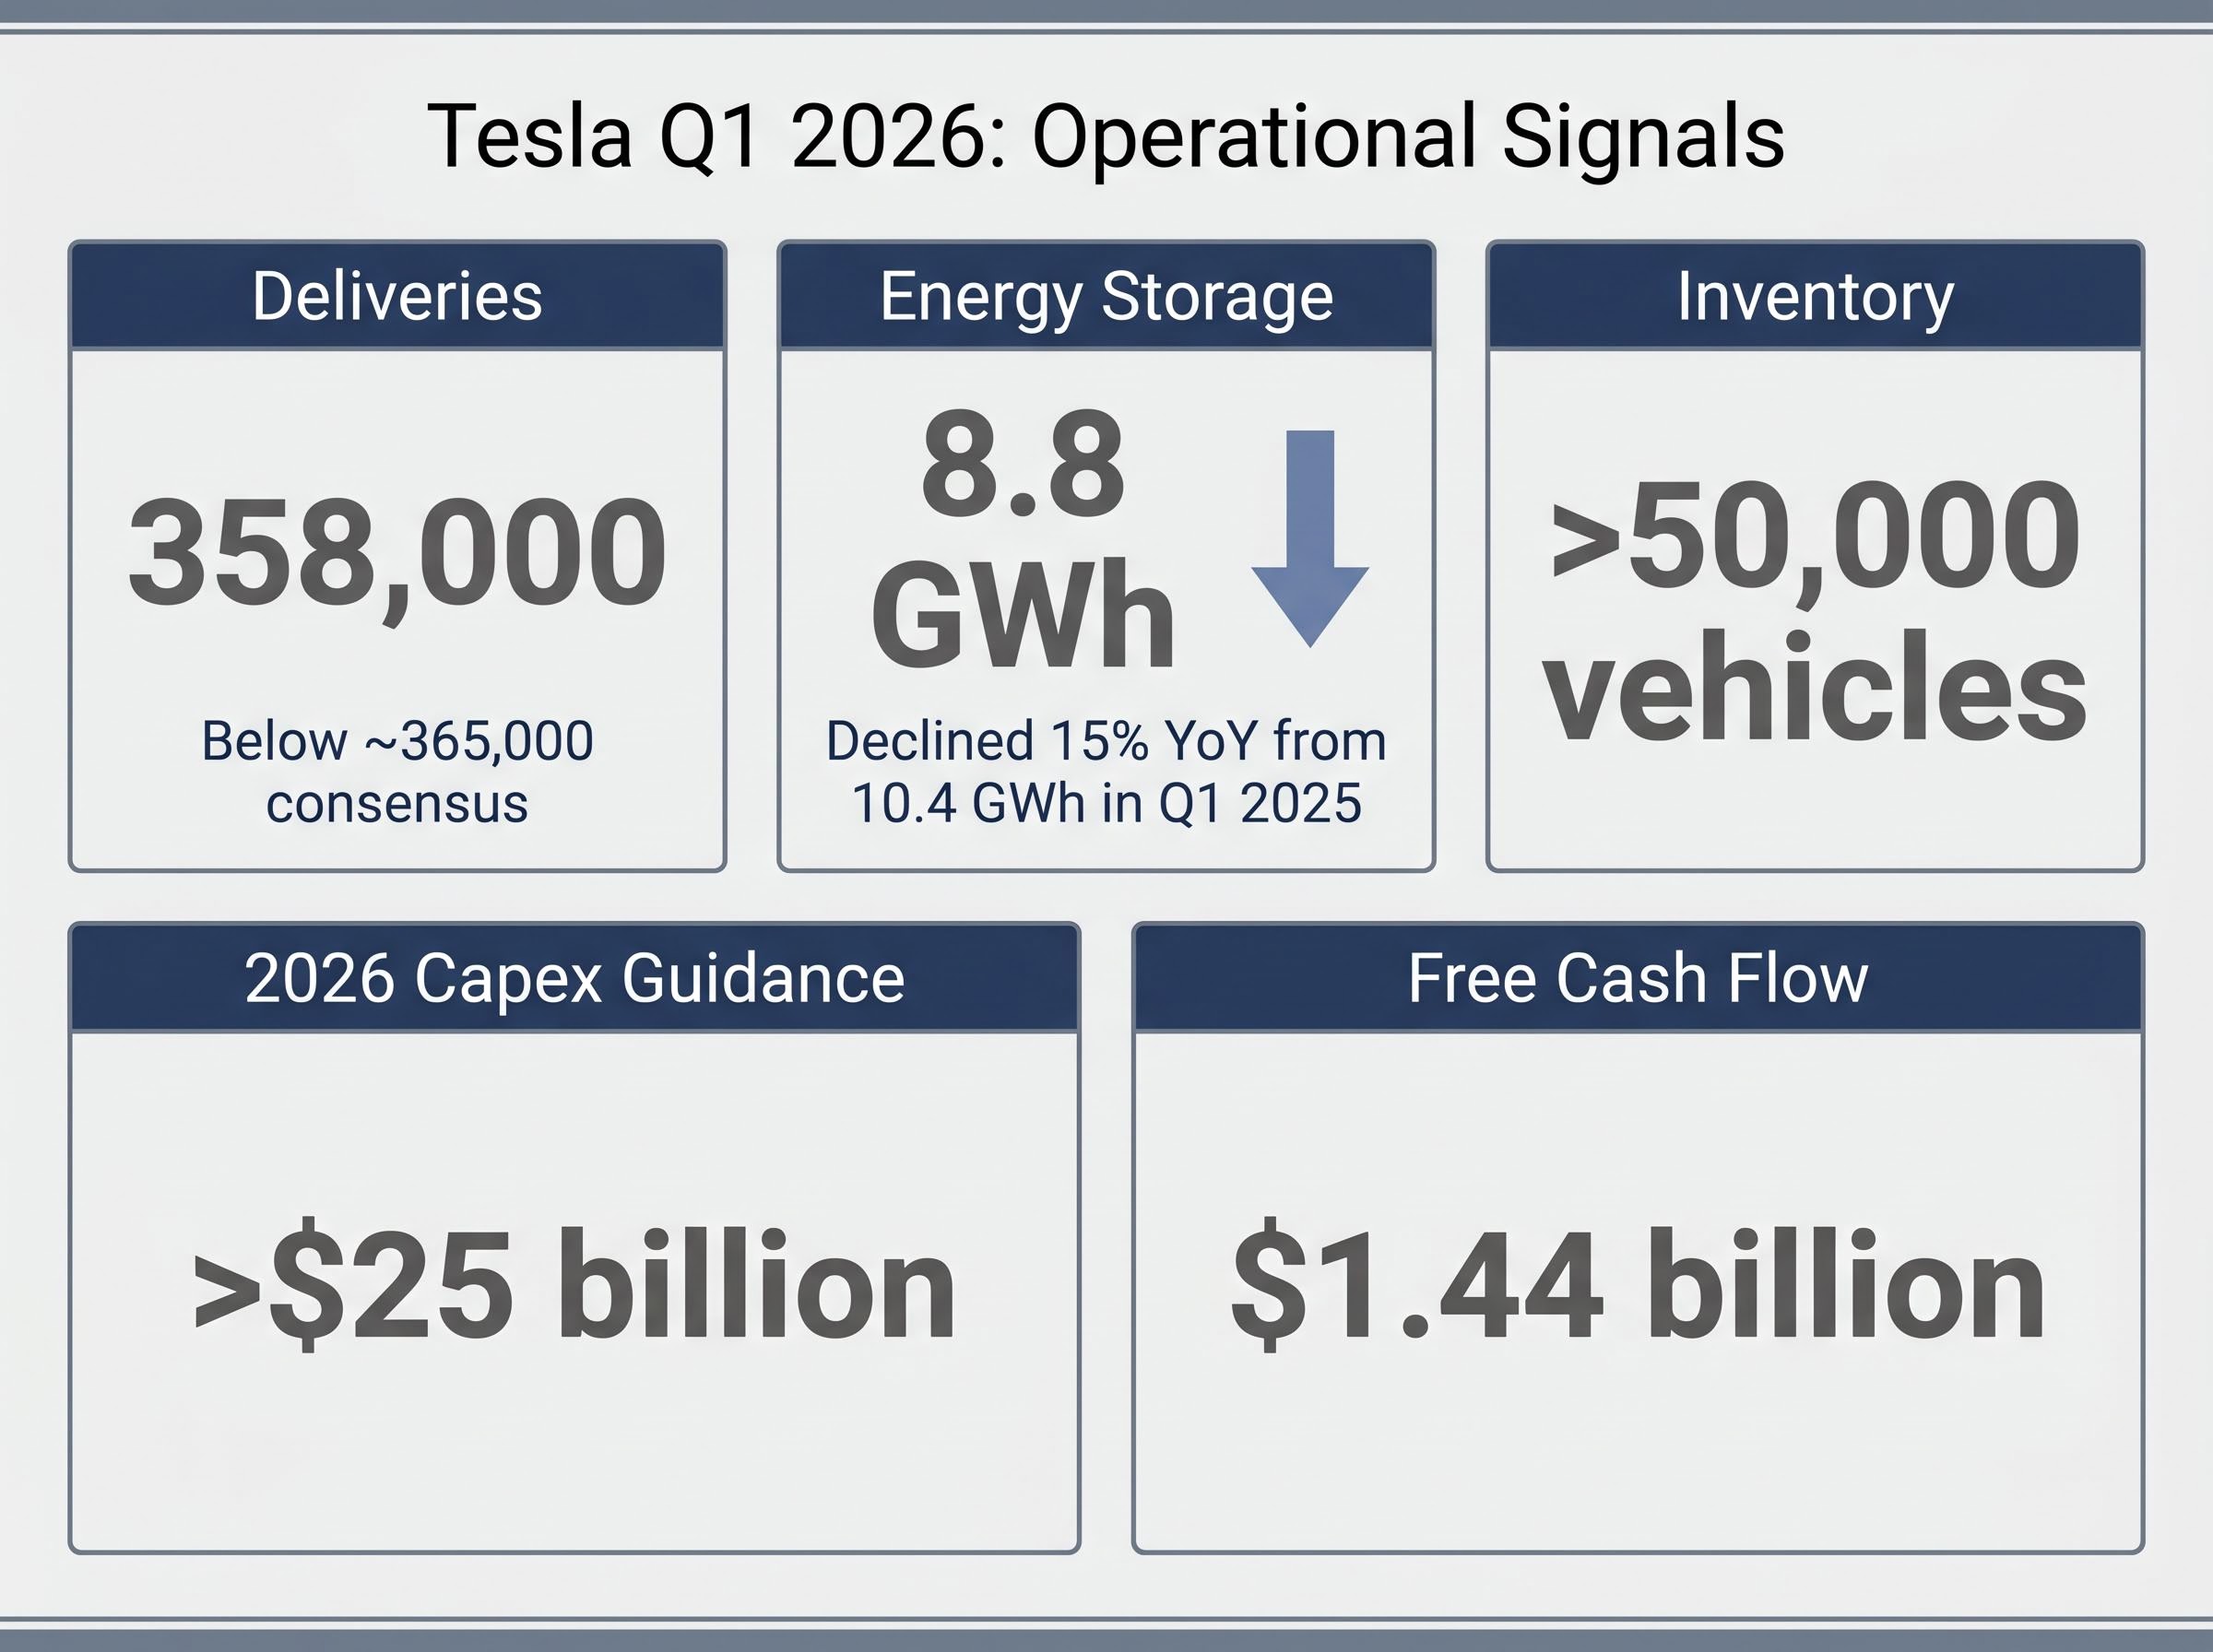
BYD has surpassed Tesla as the world’s largest EV producer by volume, a competitive signal directly relevant to the core automotive revenue base that underpins even the most optimistic forward models. If autonomy and robotics execution stalls, the market reprices Tesla on auto-sector fundamentals. Bears assign net profit margins in the 8%-14% range in that scenario, with valuation multiples compressing toward 17x-22x earnings.
Jefferies holds a $350 price target with a Hold rating, representing the more moderate bearish-to-neutral position. The most aggressive bear cases imply a share price closer to $125.
At Tesla’s Q1 2026 adjusted earnings per share of $0.41, a trailing P/E of 317x produces the current share price. If the market resets that multiple to 20x, consistent with auto-sector comparables, the implied share price falls to approximately $8 per share on trailing earnings alone. Even if forward earnings estimates improve substantially, a compression from technology-platform multiples to auto-sector multiples would represent a severe repricing. The magnitude of that risk is what makes the multiple question central to any valuation of Tesla today.
A stock’s projected return is not a fixed property of the company. It is a function of the price paid. Tesla at $100 per share (available in the years prior to 2026) and Tesla at $428 are fundamentally different investments, regardless of what the business does next.
| Scenario | Return at $100 Entry | Return at $428 Entry |
|---|---|---|
| Bull case | Substantially positive; full bull thesis not required for gains | 11%-35% annualised over 10 years, but described as 5%-10% probability of full materialisation |
| Bear case | Potential for positive returns even under multiple compression | All return outcomes negative at $375-$428 entry price |
The concept at work here is margin of safety. A lower entry price does not require the bull case to fully materialise for a positive return. A high entry price requires near-perfect execution on the most ambitious assumptions just to break even.
A high entry price requires near-perfect execution just to break even. The margin of safety is not about the company’s quality. It is about the gap between what you pay and what must go right.
Tesla’s analyst EPS estimates declined more than 90% from their peak before recovering in forward projections. Those forward estimates now project EPS growing more than 5x from current levels, but that growth incorporates AI and autonomy assumptions that remain unproven at commercial scale.
The concept of price-implied expectations offers a practical tool: rather than predicting what Tesla will do, the investor’s job is to determine whether the current price already reflects the most optimistic outcome or leaves room for upside. At $428, the price implies a significant portion of the bull case is already embedded. Entry price is the one variable fully within an investor’s control.
Margin of safety as a discipline extends beyond any single stock: the Buffett Indicator stood at 223.6% as of May 2026, roughly 2.4 standard deviations above its long-run trend, suggesting that the entry price problem Tesla illustrates at the individual stock level is replicated at the broad market level.
Tesla is one company. The methodology applies to any stock where the market is pricing a transformation that has not yet fully materialised. The four-step process demonstrated in this guide works as a reusable analytical toolkit:
The most common mistake on transitional companies is treating a compelling story as a substitute for scenario probability assessment. Tesla’s Q1 2026 results illustrate why: adjusted EPS of $0.41 beat the approximately $0.37 consensus, but the revenue miss, inventory buildup, and capex warning told a more complex story. A single metric in isolation produces an incomplete and potentially misleading picture.
Three supplementary metrics help round out the analysis for any high-multiple transitional company:
The $125-to-$600 analyst spread on Tesla is not a signal that one side is wrong. It is a signal that the uncertainty is genuine, and that the investor’s job is to decide which scenario they are underwriting when they pay a given price.
The most defensible position on a company like Tesla in May 2026 is often partial scenario weighting rather than a binary bull or bear call. The framework outlined in this guide supports that nuanced approach: build the scenarios, assign probabilities, and let the entry price determine whether the risk-reward is acceptable.
Every high-multiple stock with a transformation narrative is, at its core, a question about whether the price paid today gives the investor enough room to be approximately right rather than exactly right. The numbers will differ from company to company. The discipline does not.
For investors wanting to build the ongoing evidence-review process that follows an initial valuation, our dedicated guide to monitoring triggers for high-multiple stocks covers the specific auto gross margin thresholds, Robotaxi regulatory milestones, Optimus production checkpoints, and CapEx efficiency ratios that should prompt a probability update each quarter.
This article is for informational purposes only and should not be considered financial advice. Investors should conduct their own research and consult with financial professionals before making investment decisions. Past performance does not guarantee future results. Financial projections are subject to market conditions and various risk factors.
Scenario-based stock valuation analysis builds at least two models for a company, a bull case and a bear case, each using distinct assumptions for revenue growth rate, profit margin, and valuation multiple, then compares the resulting per-share values to the current stock price to assess risk and reward.
The peer set chosen by an analyst determines the valuation multiple applied to future earnings; if Tesla is benchmarked against automakers it looks extremely expensive, but if benchmarked against high-growth technology platforms the multiple appears more defensible, which is the primary reason analysts hold price targets ranging from $125 to $600 for the same stock.
A higher entry price requires near-perfect execution on the most ambitious assumptions just to break even, while a lower entry price allows an investor to earn positive returns even if only part of the bull case materialises, a concept known as margin of safety.
Tesla reported adjusted EPS of $0.41, beating the roughly $0.37 consensus estimate, but deliveries of 358,000 vehicles missed the approximately 365,000 estimate, energy storage volume fell 15% year over year, inventory exceeded 50,000 vehicles, and capex guidance of more than $25 billion for 2026 raised concerns about future free cash flow.
The PEG ratio adjusts the P/E for expected earnings growth, EV/EBITDA removes capital structure effects to enable cross-company comparison, and free cash flow yield tests whether a business can fund its own ambitions without relying on external capital.


