
Tesla at 90x Earnings: a Framework for Valuing Transitioning Stocks
28 mins ago

At roughly 161x forward earnings, Tesla is priced as if its most ambitious bets have already paid off. Yet the core automotive business posted only 18% gross margins in Q1 2026 and missed revenue estimates. That gap between current price and current fundamentals is not a quirk of one quarter’s results; it is the central puzzle of stock valuation analysis for any company whose share price embeds a future that has not yet arrived.
When a stock trades at that kind of premium, standard valuation shortcuts break down. Price-to-earnings ratios become meaningless without knowing which earnings story the market is betting on. Revenue growth assumptions swing projected returns by dozens of percentage points. The price an investor pays on entry becomes one of the most consequential decisions in the entire analysis. This article uses Tesla’s May 2026 valuation as a live, data-rich case study to teach a replicable framework for building bull and bear scenarios, stress-testing valuation multiples, and understanding how entry price shapes every downstream return outcome. The methodology built here applies to any high-conviction, high-uncertainty company, not just Tesla.
Tesla’s valuation debate is not about whether the company is good or bad. It is about which company Tesla actually is. One version of the business is an automaker with above-average margins and growing volume. The other is an AI and robotics platform that happens to sell cars while it builds the infrastructure for autonomous transport and humanoid labour. The same stock can be simultaneously rational and irrational depending entirely on which future an investor believes in.
That ambiguity is not a flaw in the analysis. It is the lesson.
TSLA closed at $411.79 on 7 May 2026, up approximately 20% from $343.25 on 8 April 2026. The trailing P/E sits at roughly 200x. The forward P/E, based on a FY2026 EPS consensus of approximately $2.56, is roughly 161x. Those multiples make an unusually explicit and testable claim about what Tesla must become.
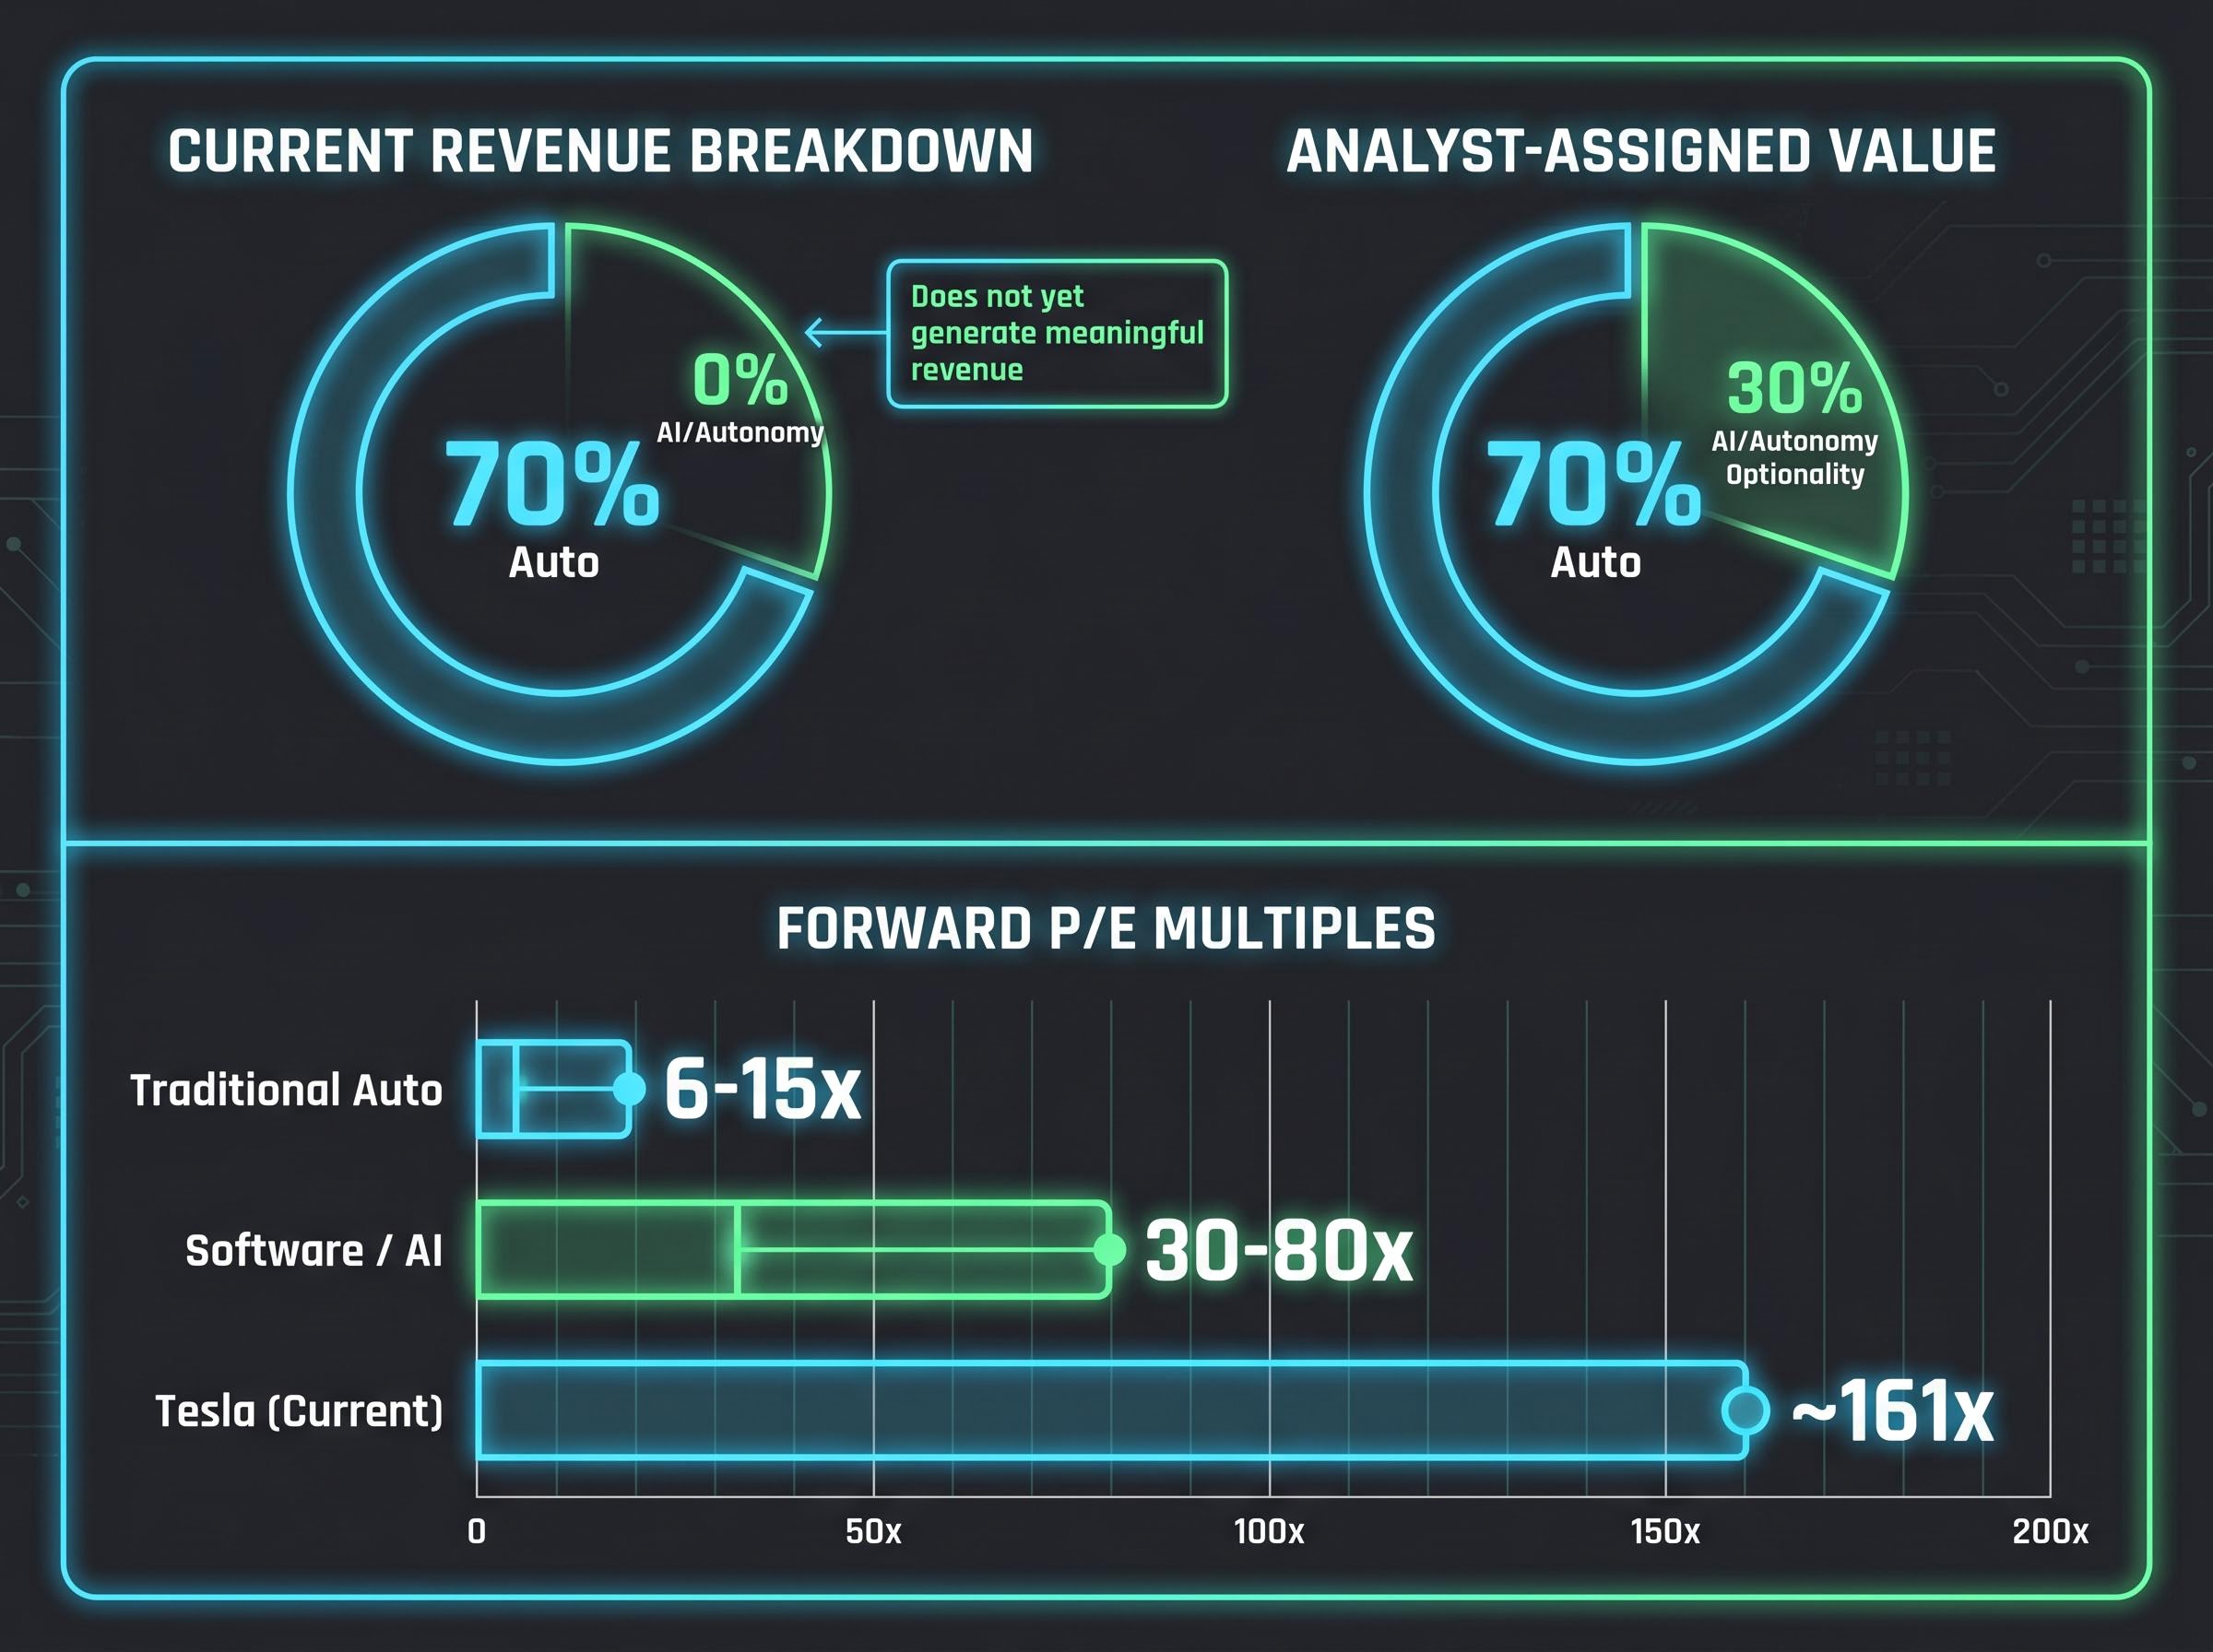
Consider the structural split: the auto segment constitutes approximately 70% of current revenue, yet roughly 30% of analyst-assigned valuation reflects AI and autonomy optionality, businesses that do not yet generate meaningful revenue. Q1 2026 revenue of $22.39 billion missed consensus of $22.64 billion; EPS of $0.41 beat the $0.36 estimate. The numbers are solid. They are not, on their own, enough to justify the price.
Tesla’s auto business constitutes 70% of revenue, but the stock price embeds a 30% premium for businesses that do not yet generate meaningful income. That gap is where the valuation debate lives.
A quick-reference snapshot of where Tesla’s multiples stand:
This valuation compression problem is not unique to Tesla. Any investor evaluating a company mid-transformation, whether in clean energy, biotech, or enterprise software, faces the same structural challenge. The framework built from Tesla’s numbers applies far beyond this one ticker.
Tesla’s elevated multiple does not exist in a vacuum: the broader market valuation signals tracked through the Buffett Indicator, equity earnings yield spreads, and Berkshire Hathaway’s cash positioning all suggest that capital allocation discipline matters more in 2026 than at almost any point in recent history.
A valuation scenario is not a guess. It is a structured assembly of three interlocking variables: projected revenue growth rate, net profit margin assumption, and the earnings multiple the market will apply at exit. Change any one of them, and the output shifts dramatically.
Revenue growth determines how large the company becomes. Net profit margin determines how much of that revenue converts to earnings. The exit multiple determines how much investors will pay per dollar of those earnings when the scenario matures. For a company in transition, each of these inputs is genuinely uncertain. Analysts covering the same stock can arrive at vastly different estimates for all three.
The uncertainty becomes visible in the numbers. Conventional auto peers trade at 6-15x forward P/E. AI and software companies trade at 30-80x. Tesla’s current forward P/E of approximately 161x sits above both peer groups, reflecting a market that has already blended the two narratives into a single price.
A discounted cash flow (DCF) model, which projects future free cash flows and discounts them back to present value, requires a discount rate (approximately 10% weighted average cost of capital for Tesla) and a terminal growth rate. Those two assumptions alone can produce a valuation range spanning hundreds of dollars per share.
Building a scenario follows three steps:
Many Tesla analysts use a sum-of-the-parts approach: treating the auto business and the AI/autonomy business as separate entities, applying different multiples to each, then adding the results together. The auto segment is typically valued at auto-sector multiples (roughly 20x P/E), while the autonomy and robotics segment receives software/AI multiples (100x or above).
Under this framework, approximately 70% of analyst-assigned value reflects the auto segment, while roughly 30% reflects AI and autonomy optionality. The implication is direct: any slowdown in AI execution hits the stock price disproportionately, because that 30% slice carries the highest multiple.
| Peer Group | Forward P/E Range | Growth Profile | What the Multiple Assumes |
|---|---|---|---|
| Traditional Auto | 6-15x | Low single-digit growth | Stable margins, cyclical demand, limited reinvention |
| Software / AI | 30-80x | High double-digit growth | Scalable margins, recurring revenue, large addressable market |
| Tesla (Current) | ~161x | Transformation story | Auto base plus successful AI/autonomy monetisation at scale |
Once an investor understands which assumption is doing the most work inside a price target, they can evaluate whether they agree with it. That is the difference between accepting an analyst output and participating in the valuation debate.
The bull case for Tesla is not a matter of enthusiasm. It is a structured answer to a specific question: what would have to be true for the current share price to deliver strong long-term returns?
Start with the assumptions. Bull case revenue growth runs 20-35% annually. Net profit margins expand to 20-30%, up from the current range of approximately 7-10%. Exit multiples compress but remain elevated at 25-35x earnings. Each of these assumptions is plausible on its own; the challenge is that all three must hold simultaneously.
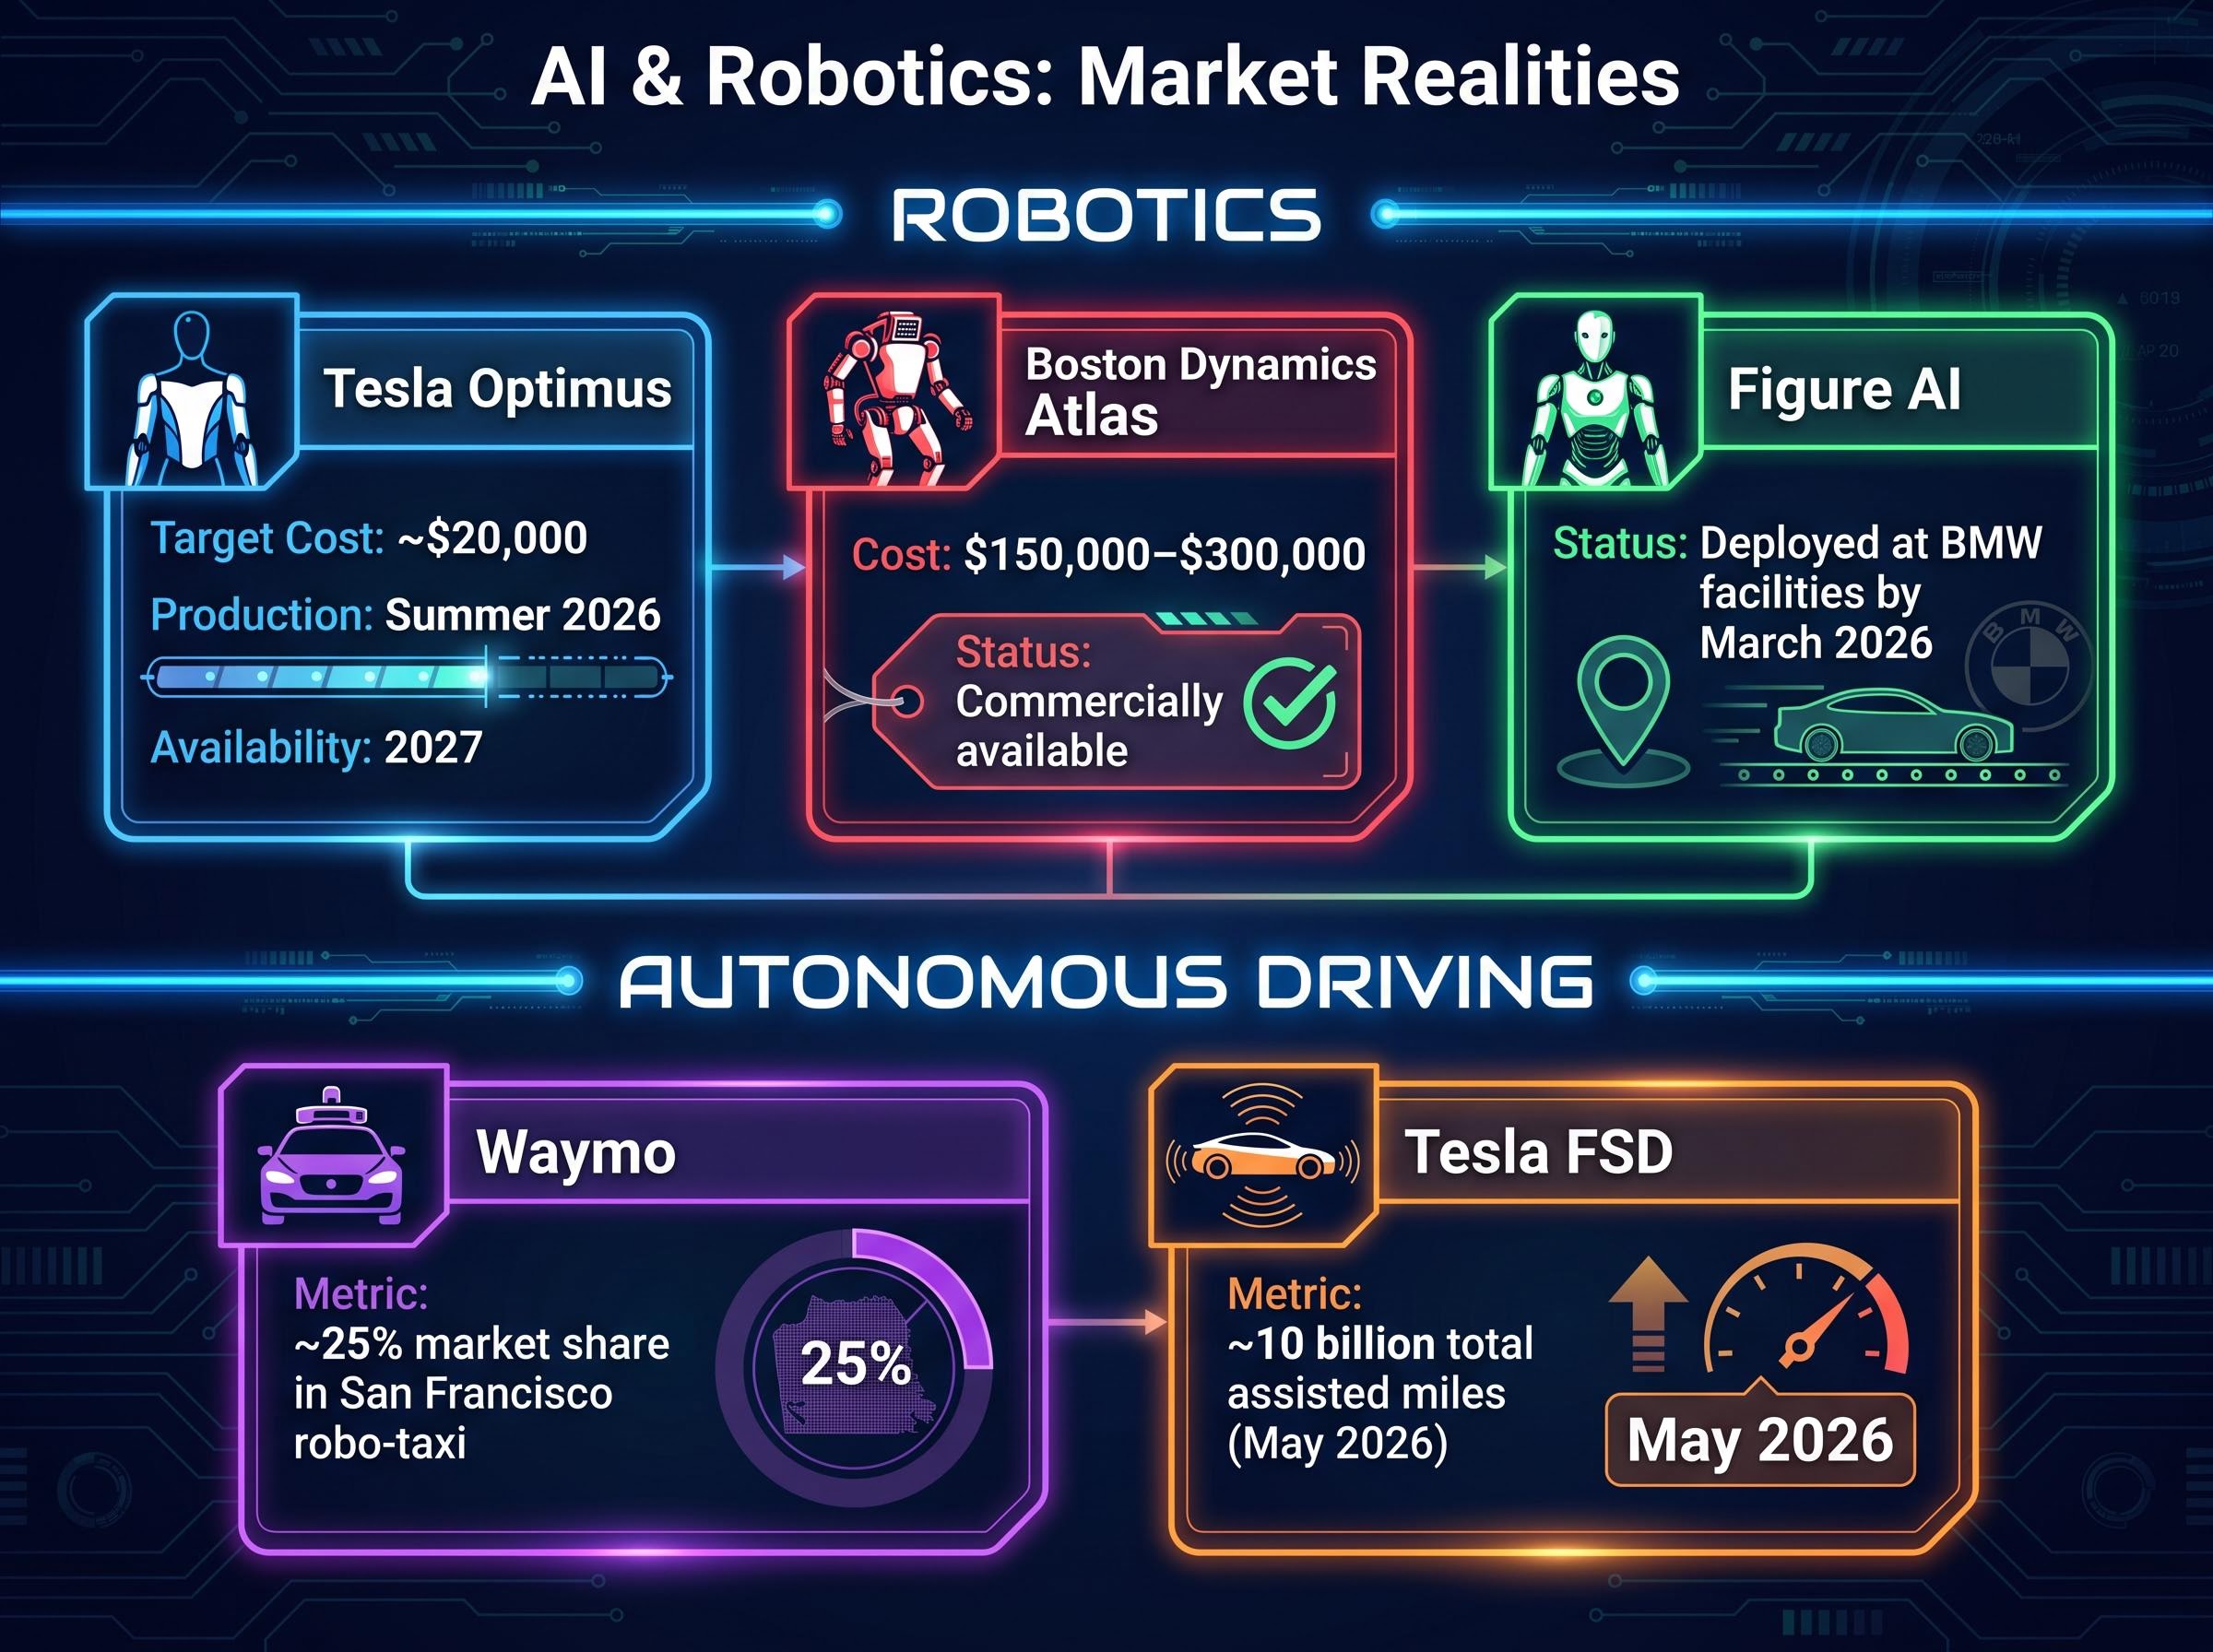
The catalysts that would drive this outcome are specific and identifiable. Optimus, Tesla’s humanoid robot, has a production start targeted for summer 2026 (late July/August), with external commercial availability projected for 2027. Tesla’s cost target of approximately $20,000 per unit compares to Boston Dynamics Atlas pricing of $150,000-$300,000 per unit. If achieved at scale, the cost advantage could be substantial.
On autonomous driving, Tesla has accumulated approximately 10 billion total FSD-assisted miles as of May 2026, representing a significant real-world training data advantage. Robo-taxi operations are expanding to Dallas and Houston in addition to Austin, and autonomous vehicle miles driven nearly doubled in Q1 2026 versus the prior period.
Dan Ives of Wedbush forecasts a $2 trillion-$3 trillion market capitalisation for Tesla by end-2026. ARK Invest’s published model (June 2024) targets approximately $2,600 per share by 2029. Even under the bull case assumptions outlined here, annualised 10-year returns are estimated at approximately 11-35%, which is strong but not guaranteed.
The bull case is estimated to carry a roughly 5-10% probability of fully materialising. That probability figure is not a dismissal of the thesis; it is the single most important input for any position-sizing decision.
| Scenario Input | Low Bull | Mid Bull | High Bull |
|---|---|---|---|
| Revenue Growth (Annual) | 20% | 27% | 35% |
| Net Margin Assumption | 20% | 25% | 30% |
| Exit Multiple (P/E) | 25x | 30x | 35x |
| Implied 10-Year Annualised Return | ~11% | ~22% | ~35% |
Separating “this would be a great outcome” from “this is a reasonably probable outcome” is the skill that distinguishes disciplined investors from optimists. Assigning a probability to a scenario, not just a price, is where that discipline begins.
The bear case is the more uncomfortable exercise, not because it requires pessimism, but because it demonstrates what happens to projected returns when a strong company is priced for perfection.
Bear case assumptions are not harsh. Revenue growth runs 6-12% annually. Net profit margins land at 8-14%, reflecting a strong but conventionally valued automaker with above-average profitability relative to Ford or GM. Exit multiples sit at 18-22x earnings. This is not a “Tesla fails” scenario. It is a “Tesla is an excellent car company” scenario.
At an entry price of approximately $375-$412 per share, all projected return outcomes under these assumptions were negative.
That result forces a direct confrontation with what the current stock price actually requires. The share price does not allow for a scenario where Tesla is merely an excellent car company with industry-leading margins. It requires meaningful AI and robotics revenue to justify the premium.
The structural headwinds are real:
Goldman Sachs cut its price target to $375 (from $405) on 6 April 2026, citing margin compression as the primary concern.
A one-to-two-year delay in a key revenue catalyst has a proportionally larger impact on returns when the starting multiple is 161x forward earnings than when it is 15x. At lower multiples, the existing business provides a valuation floor. At Tesla’s current multiple, the valuation depends on future businesses arriving on schedule.
The historical pattern is instructive. In 2019, Musk projected one million robo-taxis by end-2020; that target was not met. In 2021, Optimus was projected to be deployment-ready by 2022; that timeline also slipped. The pattern does not mean the vision is wrong. It means investors should widen their time horizon assumptions and stress-test their models for delays.
| Scenario Input | Low Bear | Mid Bear | High Bear |
|---|---|---|---|
| Revenue Growth (Annual) | 6% | 9% | 12% |
| Net Margin Assumption | 8% | 11% | 14% |
| Exit Multiple (P/E) | 18x | 20x | 22x |
| Implied 10-Year Annualised Return | Negative | Negative | Negative |
The bear case is not about predicting failure. It is about identifying the minimum conditions required for the current price to be rational, and whether an investor is willing to bet on those conditions materialising.
Both scenarios use the same company, the same management team, and the same technology roadmap. The variable that transforms the investment thesis is the price paid on entry.
Tesla shares were available at approximately $100 per share a few years prior to May 2026. The stock peaked near $450. At $100, the bull case needed to be only partially right to generate strong returns. At $411, the bull case must materialise more completely, because much of the optimistic outcome is already embedded in the price.
Forward analyst estimates project EPS growing more than 5x from current levels. Yet analyst EPS estimates declined more than 90% from their peak before recovering, illustrating the volatility of earnings projections for companies in transition. Morgan Stanley reiterated a $415 price target on 25 April 2026. Goldman Sachs holds a $375 target. The consensus median sits at approximately $400-$412.
The spread between the most bullish view (ARK at approximately $2,600 by 2029) and the most bearish (Goldman Sachs at $375) represents one of the widest analyst dispersions for any large-cap stock, itself a signal of valuation uncertainty.
The SEC guidance on evaluating analyst recommendations warns investors that price targets are projections based on assumptions that may not materialise, which is precisely why understanding the specific revenue, margin, and multiple assumptions embedded in any target matters more than accepting the headline number.
The difference between buying Tesla at $100 and $411 is not just a price difference. It is a difference in how much of the bull case the stock already prices in, and how much room remains for error if the timeline takes longer than expected.
Multiple compression risk is often underweighted in bull case modelling: a stock re-rating from 200x to 30x earnings destroys substantial value even when underlying earnings grow, meaning an investor can be correct about the business and still experience a poor return if the starting multiple is high enough.
Before purchasing any high-valuation transition stock, three questions structure the decision:
This framework applies universally. Whether evaluating a biotech on the cusp of a drug approval, a software company mid-platform-shift, or an industrial company pivoting to clean energy, the question of what the current price requires the future to look like is always the right starting point. Even investors with a positive long-term view on Tesla’s trajectory may find that the current price embeds enough uncertainty to warrant sizing the position in proportion to their conviction in the specific bull case assumptions.
The Tesla case study produces a five-step methodology that works for any stock where the price embeds a transformation narrative:
The goal is not to predict which scenario occurs. It is to understand what the current price is implicitly betting on, and to decide whether the investor agrees with that bet. The consensus analyst median price target of approximately $400-$412 for Tesla offers an example of a blended scenario view: not fully pricing in the bull case, not dismissing the AI premium entirely. Even FY2026 EPS consensus of approximately $2.56 already incorporates some autonomy and Optimus optionality, illustrating that “consensus” estimates themselves embed transformation assumptions.
For investors who want to apply the five-step methodology from this article to a different company in their own portfolio, our full explainer on valuing high-multiple growth stocks walks through a portable six-step framework covering ratio calculation, peer benchmarking, DCF scenario building, stress-testing, and probability weighting across any sector where the current price embeds an unproven future business.
Scenario probability weights should not be set in isolation. They should reflect competitive dynamics. Relevant factors include:
If Waymo has a multi-year head start in fully unsupervised commercial deployment, that is a relevant input to how likely Tesla’s robo-taxi bull case is to materialise on schedule. Competitive realities do not invalidate a bull case, but they belong in every probability estimate.
The most important output of this exercise is not a price target. It is a personal decision about whether the current price represents an acceptable entry point given the investor’s own probability assessment and risk tolerance.
Tesla, at $411.79 on 7 May 2026, is neither obviously overvalued nor obviously undervalued. It is priced for a specific future. The bull and bear scenarios built in this article make that future explicit, testable, and comparable. That is all scenario analysis can do, and it is enough.
Paying attention to what the price requires, rather than what the story promises, is the discipline that separates investors who manage risk from those who merely absorb it. Tesla is neither the only nor the last company investors will encounter that is mid-transformation with an elevated valuation. The methodology built here is the durable takeaway.
The question is not whether Tesla’s vision is compelling, but whether the current price gives the investor enough room for error if the timeline takes longer than expected.
This article is for informational purposes only and should not be considered financial advice. Investors should conduct their own research and consult with financial professionals before making investment decisions. Past performance does not guarantee future results. Financial projections are subject to market conditions and various risk factors. Forward-looking statements referenced in this article, including analyst price targets and scenario projections, are speculative and subject to change based on market developments and company performance.
—
Scenario-based stock valuation analysis is a framework where investors build explicit bull and bear cases by setting revenue growth, net profit margin, and exit multiple assumptions, then calculating implied returns at the current share price to determine whether entry is justified.
Many analysts use a sum-of-the-parts approach, applying auto-sector multiples (roughly 20x P/E) to the automotive segment and software or AI multiples (100x or above) to the autonomy and robotics segment, with approximately 70% of analyst-assigned value reflecting the auto business and 30% reflecting AI and autonomy optionality.
At a high starting multiple, much of the optimistic outcome is already embedded in the share price, meaning the bull case must materialise more completely to generate strong returns and even a modest delay in key catalysts produces proportionally larger losses than at lower multiples.
The three core inputs are projected revenue growth rate (how large the company becomes), net profit margin assumption (how much revenue converts to earnings), and the exit multiple (how much investors will pay per dollar of earnings when the scenario matures).
Investors should assign an explicit probability to each scenario, then blend the implied returns by those probabilities to calculate an expected return, ensuring position size reflects conviction in the specific assumptions rather than just the headline price target.


