
How to Analyse Any High-Multiple Stock Using Tesla as a Case Study
21 mins ago

At Tesla’s current price of roughly $411 per share, the stock trades at nearly 200x forward earnings. That is not a typo, and it is not irrational on its face. It is, however, a bet on a company that does not yet exist. Tesla’s Q1 2026 earnings beat analyst expectations on revenue ($22.4 billion, up 16% year-over-year), gross margin (21.1% versus a projected 17%), and adjusted EPS ($0.41 versus $0.35 consensus). The stock rose roughly 8% after the print. Yet the debate about whether Tesla is worth $180 or $600 per share has not narrowed, because the earnings beat was not the point. The point is what Tesla becomes over the next decade.
This guide uses Tesla’s specific bull and bear case valuation numbers as a live case study for a skill every investor needs: how to think through transition-stage company valuations, how dramatically different assumptions produce different return outcomes, and why the price paid at entry may matter more than which scenario plays out.
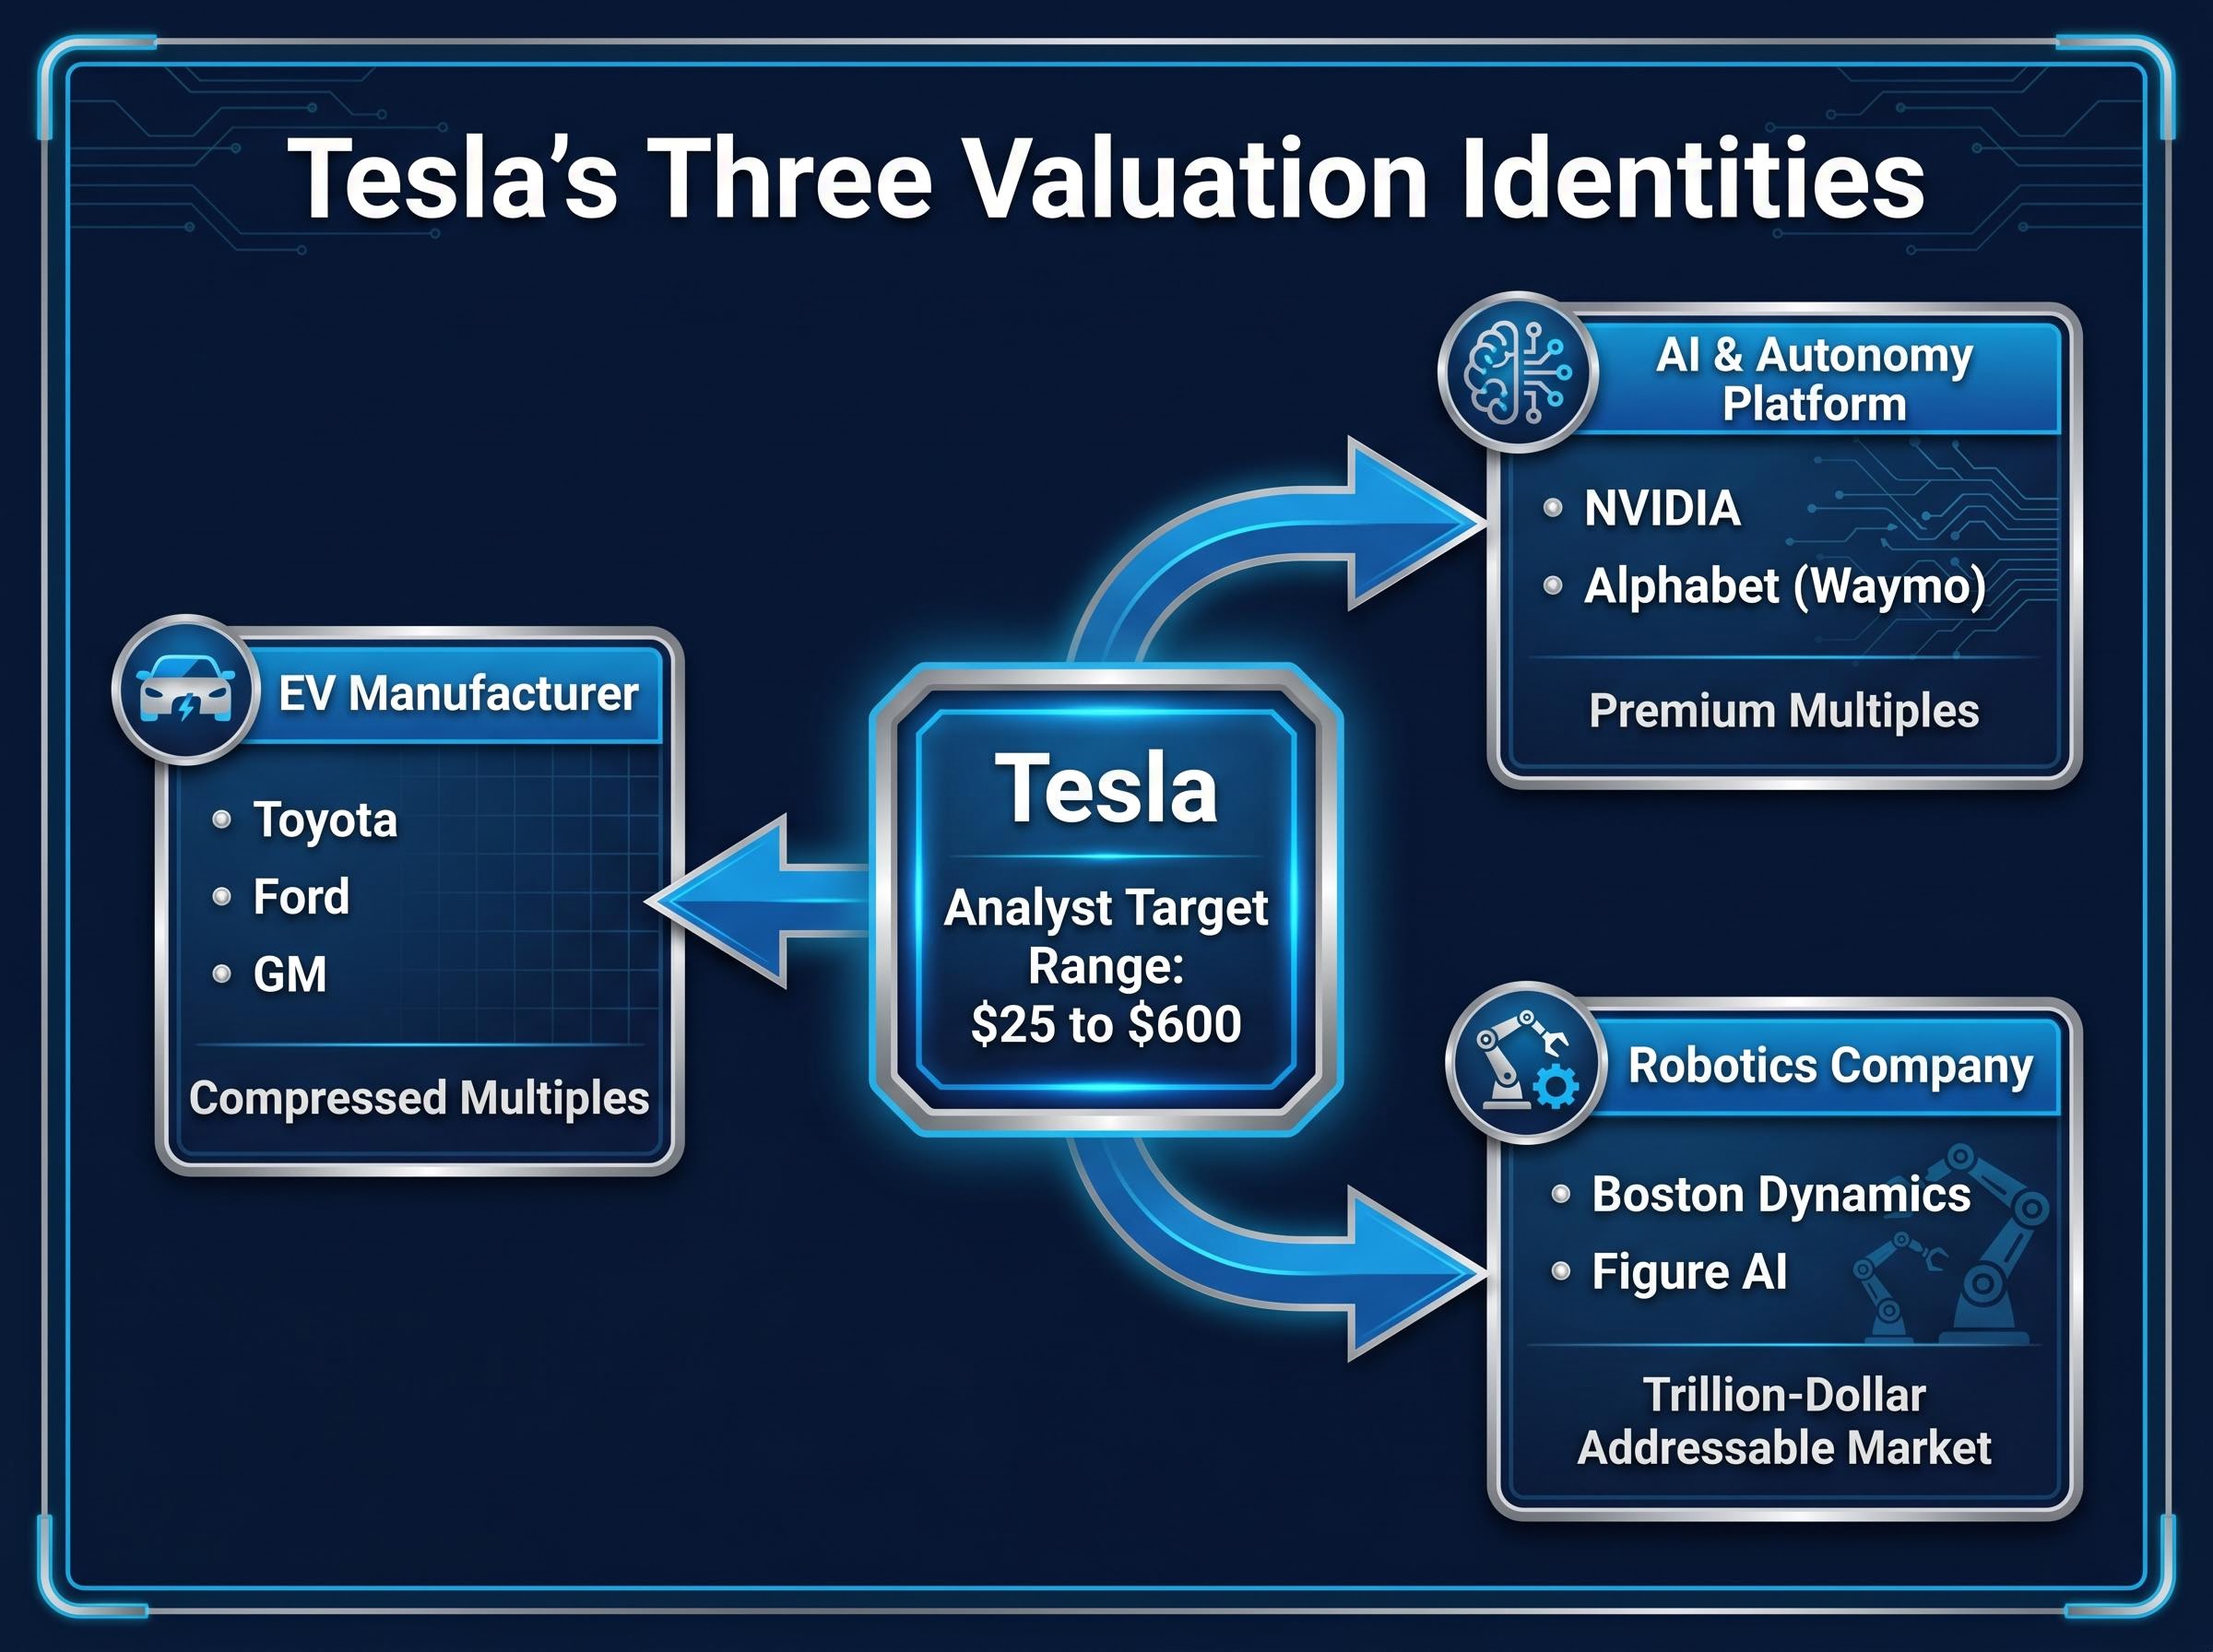
The analyst price target range on Tesla stretches from $25 to $600. That is not noise. It is the clearest signal in the market that two legitimate valuation frameworks, applied to the same set of verified financial data, produce completely opposite investment conclusions.
Analyst price target range: $25 to $600. When 12-month targets on a single stock span a 24x multiple from lowest to highest, the disagreement is not about earnings precision. It is about which company analysts believe they are valuing.
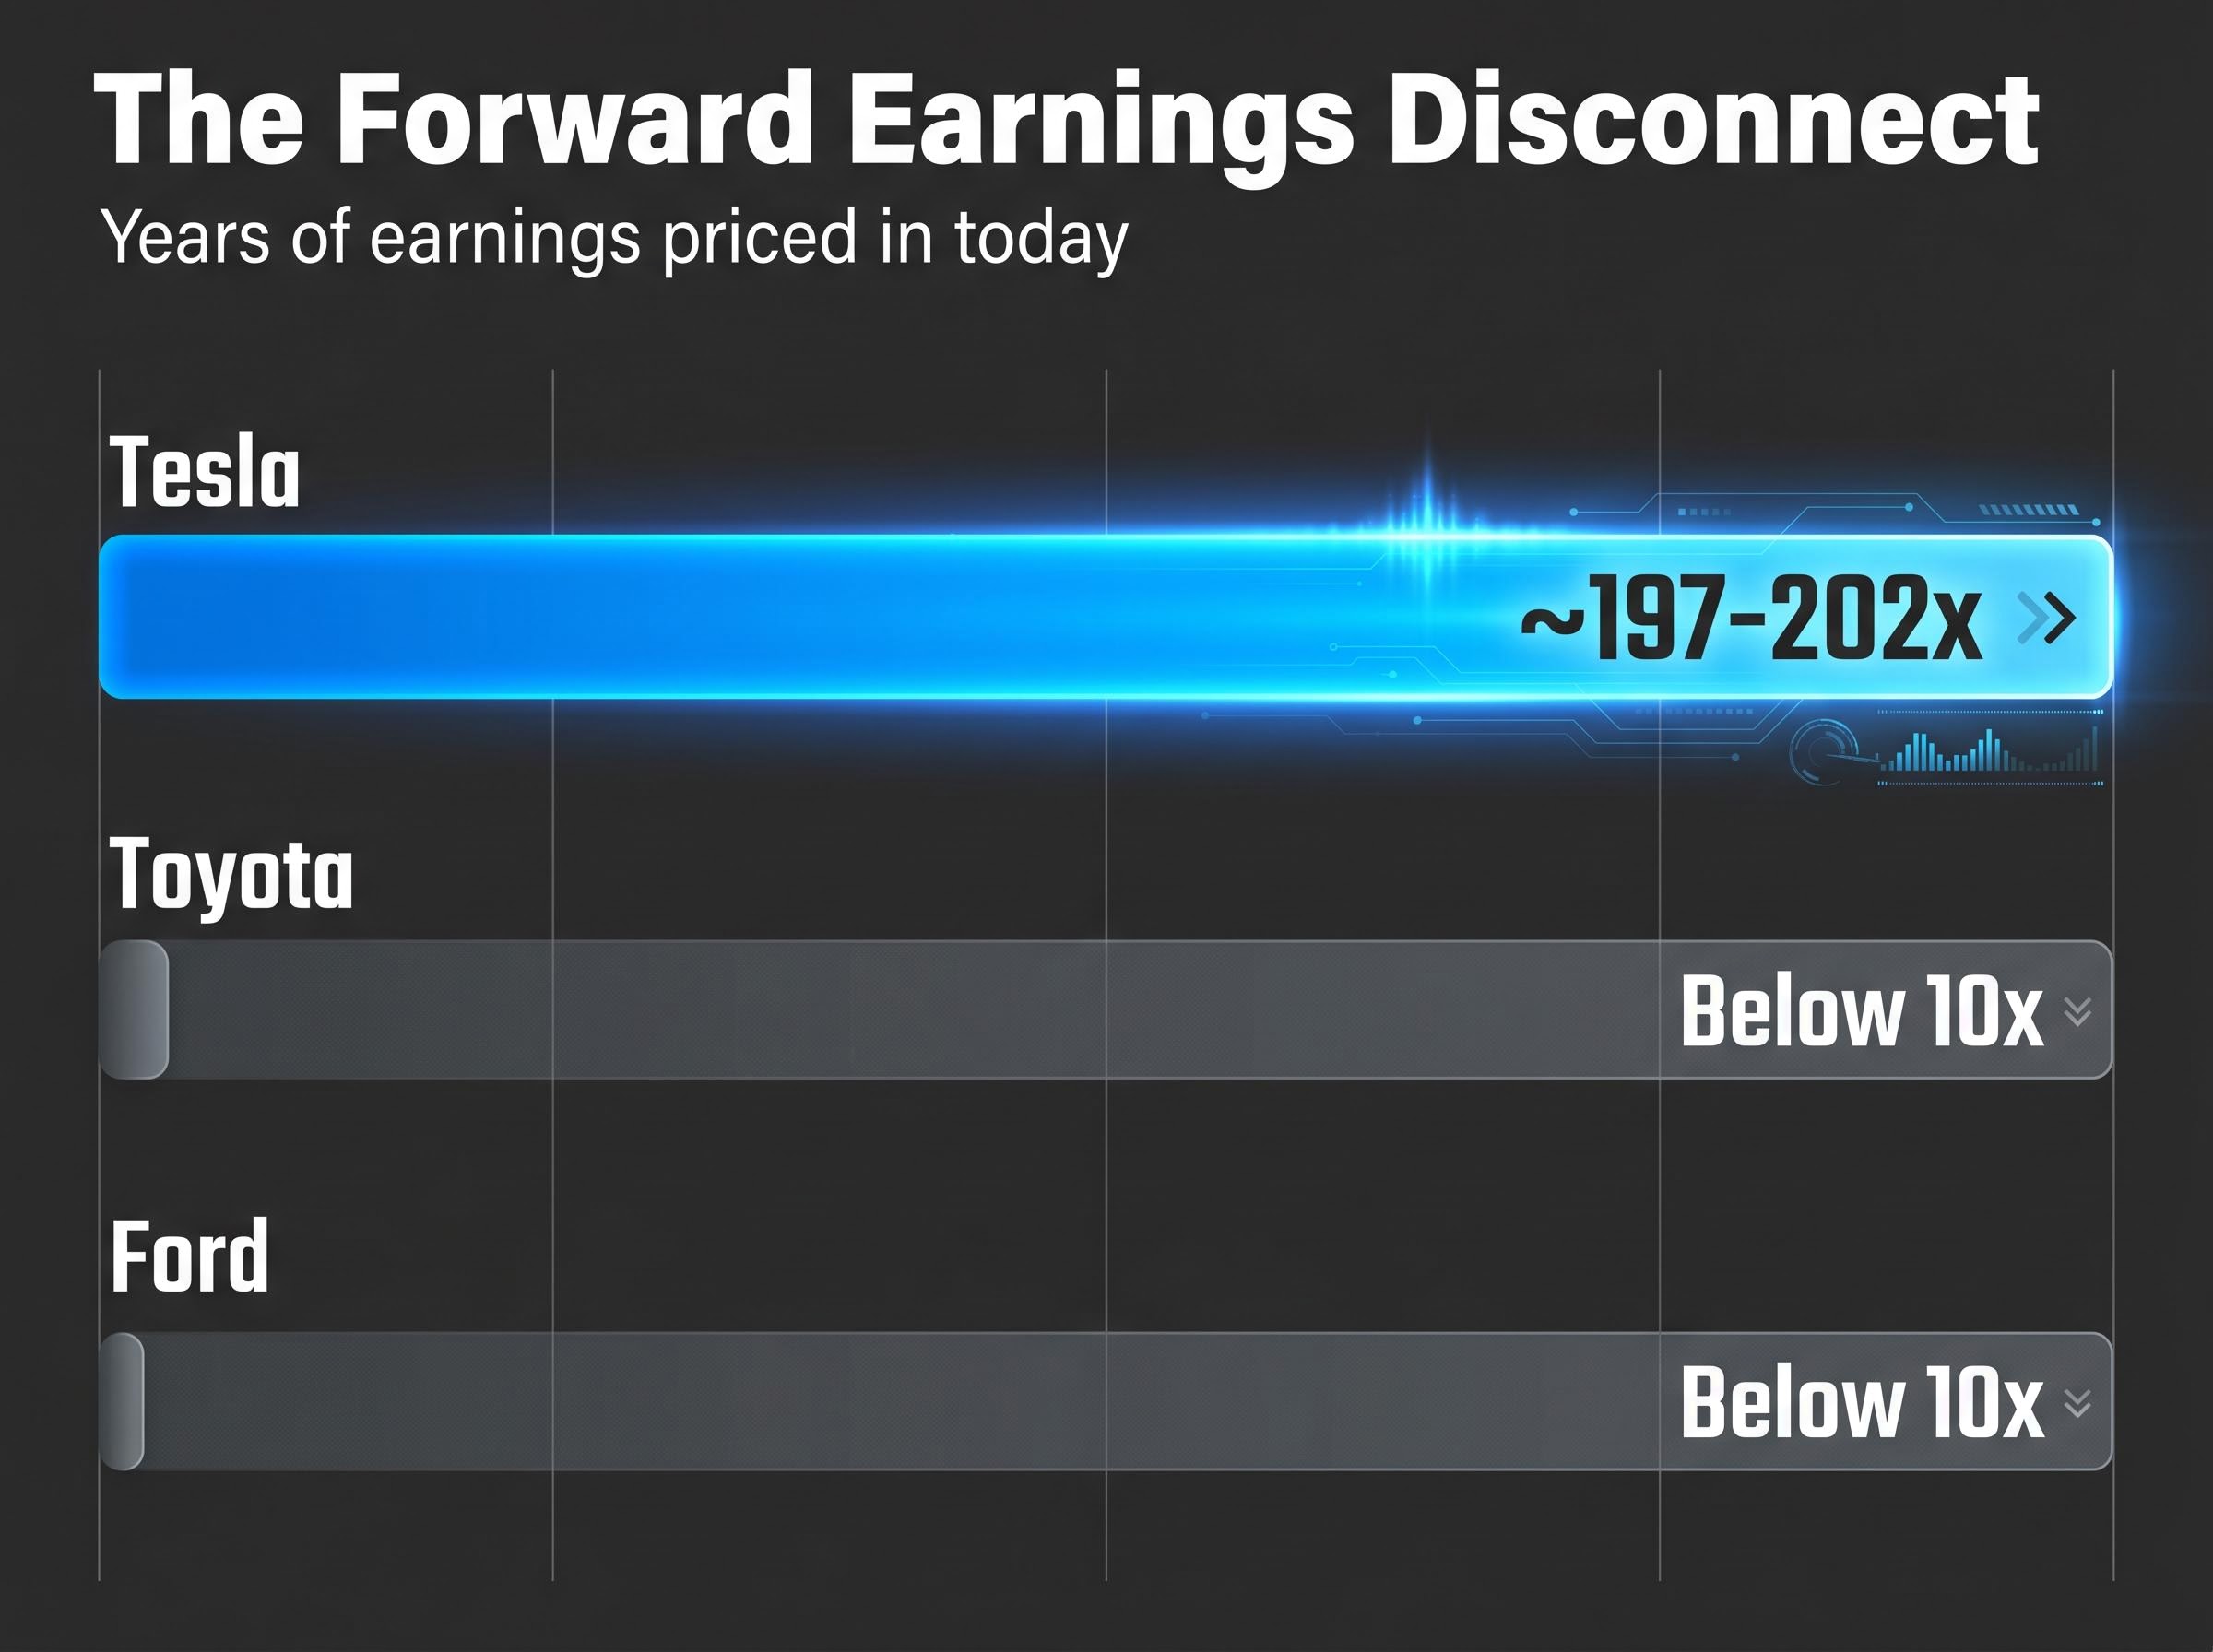
At a forward P/E of approximately 197-202x, the stock is not pricing Tesla’s car business. Toyota and Ford trade below 10x forward earnings. Tesla’s market capitalisation of approximately $1.545 trillion against trailing annualised revenue of roughly $90 billion implies approximately 17x price-to-sales. That premium reflects optionality on a company that has not yet been built.
The disagreement centres on three competing identities analysts assign to Tesla, each carrying a completely different peer set and valuation logic:
Sentiment data underscores the tension. The RSI sits at 67.67 (mildly bullish), with 57% green days over the last 30 sessions. Yet the Fear and Greed Index reads 39, firmly in Fear territory. The market is buying Tesla without being comfortable owning it.
Most investors encounter this problem not just with Tesla but with any company in transition. Understanding why the $25-to-$600 range exists is the first step toward building a framework for evaluating it.
Every valuation method asks the same question from a different angle: what is a stream of future cash or earnings worth today? The four methods below each reveal a different facet of the Tesla debate, which is why understanding all four matters more than choosing a favourite.
| Method | What it measures | Tesla application |
|---|---|---|
| Discounted Cash Flow (DCF) | Present value of projected future free cash flows | Small changes in long-term growth assumptions produce enormous swings, directly explaining the $25-to-$600 target range |
| Price-to-Earnings (P/E) | How many years of current earnings investors pay for today | At ~197-202x forward earnings, the market is pricing in decades of exceptional growth versus peers below 10x |
| Comparable Company Analysis | Valuation benchmarked against similar companies’ multiples | No single peer set captures all of Tesla’s business lines; the choice of comps is itself a valuation argument |
| Price-to-Sales (P/S) | Market cap relative to revenue, useful when earnings are thin | At ~17x trailing revenue, elevated versus auto peers but within ranges growth investors have historically accepted for high-growth tech |
A discounted cash flow model estimates what a company is worth by projecting its future free cash flows and discounting them back to today’s value using a required rate of return. It is the theoretically purest valuation method, and for Tesla, it is also the most volatile. A DCF model that assumes Tesla achieves scaled robotaxi revenue by 2030 produces a radically different output from one that assumes the same revenue arrives in 2033, or never materialises. That sensitivity to long-term assumptions is precisely why the analyst target range spans $25 to $600.
DCF assumption sensitivity is the central reason the analyst target range on Tesla stretches from $25 to $600: a small change in the long-term growth rate, applied across a decade of projected cash flows, compounds into an enormous difference in present value, which is why the same verified financial data produces opposite investment conclusions depending on who builds the model.
The P/E ratio is the market’s shorthand for DCF intuition. It tells investors how many years of earnings they are paying for at today’s price. Tesla’s forward P/E of approximately 197-202x means the market is effectively pricing in 20-plus years of exceptional earnings growth. Toyota and Ford trade below 10x. The gap is not a mistake; it is the market’s way of embedding optionality on AI, autonomy, and robotics into a single number.
Comparable company analysis benchmarks a stock’s valuation against peers using standardised multiples. The core difficulty Tesla presents is that no single peer group captures all its business lines. Bulls compare Tesla’s AI and full self-driving potential to NVIDIA, where 50x-plus multiples are accepted for infrastructure with defensible moats. Bears compare Tesla’s implied autonomous vehicle valuation to Waymo (an Alphabet subsidiary with established commercial operations in multiple US cities), arguing Tesla’s premium is stretched.
Price-to-sales is a useful supplement when earnings are thin or volatile. At approximately $1.545 trillion market cap against roughly $90 billion in annualised revenue, Tesla trades at approximately 17x trailing sales. That ratio contextualises the premium: investors are paying for the revenue that does not yet exist.
Readers who understand these four methods can apply them to any company in transition, not just Tesla. The method chosen often determines the conclusion reached, which is why rigorous analysis uses multiple frameworks rather than relying on a single number.
The bull case for Tesla is not a feeling. It is a chain of connected requirements, each of which must materialise for the current price to deliver strong returns over the next decade.
The specific inputs: revenue growth of 20-35% annually (midpoint approximately 27%), net profit margins expanding to 20-30% from the current 7-10%, and valuation multiples of 25-35x earnings. Under these assumptions, projected annualised returns over a 10-year horizon range from approximately 11% to 35%.
Each assumption maps to a specific operational milestone that has not yet been achieved:
The cost of pursuing this scenario is real. Tesla has indicated $25 billion-plus in planned 2026 capital expenditure, reflecting the investment required to build the infrastructure these milestones demand.
AI infrastructure investment in the United States reached 4.9% of GDP in Q1 2026, surpassing both the dot-com era peak and the cloud buildout peak, with combined hyperscaler capital expenditure commitments for 2026 sitting in the $600-$805 billion range; these figures set the scale of the market Tesla’s autonomy and robotics bets are positioned against, and they also define the competitive intensity of the environment in which Tesla must execute.
Estimated probability of full bull case materialisation: 5-10%. That does not make it a bad investment thesis. It means the position size should reflect the probability. High-upside, low-probability bets have a place in portfolios; they should not be the portfolio.
Constructing a bull case with explicit assumptions and probability weights is a discipline that separates rigorous analysis from wishful thinking. Tesla’s bull case is a template for any company where the current price embeds a transformation that is not yet proven.
The bear case does not require Tesla to fail. It requires Tesla to remain very good at what it already does. The current price cannot survive that outcome.
The inputs: revenue growth of 6-12% annually (midpoint approximately 9%), net margins of 8-14%, and valuation multiples compressing to 18-22x earnings. These assumptions still reflect a well-run company with above-average margins relative to Ford and GM.
The finding is direct: at approximately $375-$411 per share, every projected return outcome under bear case assumptions was negative.
| Metric | Bull case | Bear case |
|---|---|---|
| Revenue growth (annual) | 20-35% | 6-12% |
| Net margin | 20-30% | 8-14% |
| Valuation multiple | 25-35x earnings | 18-22x earnings |
| Projected annualised return (10-year, from ~$411) | ~11-35% | Negative |
Several data points support treating these assumptions as the more probable outcome rather than a worst case. FY2025 revenue declined approximately 3%. Q1 2026 gross margin of 21.1% remains below historical peaks. BYD has surpassed Tesla as the largest EV producer by volume, applying competitive pressure on pricing and margins.
On the autonomy timeline, the track record introduces additional caution. Elon Musk projected one million robotaxis by end of 2020, which did not materialise. Optimus was described as deployment-ready in 2022, which also did not materialise. A 2016 claim stated that all then-current Tesla vehicles had full self-driving hardware capable of autonomy. Waymo now operates established commercial autonomous vehicle services in multiple US cities, providing a real-world benchmark against which Tesla’s promised timelines can be measured.
The bear case is not pessimism. It is the scenario where Tesla continues growing as a premium automaker with strong margins, but the AI and robotics transformation arrives later than the share price currently assumes, or at smaller scale.
Two investors can hold the same stock, believe in the same thesis, and experience completely different outcomes. The difference is what they paid.
Tesla was available at approximately $100 per share a few years prior. It peaked near $450. At the current price of approximately $411, forward analyst EPS estimates project more than 5x growth from current levels. That growth is the embedded assumption in today’s price; it is not upside, it is what needs to happen for the price to be justified.
At current prices, the bull scenario implies annualised returns of approximately 11-35% over 10 years. The bear scenario implies negative returns. Investors who bought near the $450 peak may still be sitting on losses or minimal gains despite a subsequent multi-year holding period.
At a high enough entry price, even being mostly right about a company’s future may not be sufficient to generate positive returns. The price paid determines which version of the future an investor needs to survive.
Margin of safety is the structural concept underlying this insight: paying less leaves room for the bear case to partially materialise without destroying returns. Three entry price principles apply to any transition-stage company:
Entry price is the one variable every investor controls. In a polarised stock, the difference between a $100 entry and a $400 entry is not a detail. It is the difference between whether the partial-execution middle scenario, likely the most probable outcome, delivers acceptable returns or not.
For investors who want to translate the margin-of-safety principle into a concrete action plan, our comprehensive walkthrough of margin-of-safety positioning covers how to build a pre-researched watchlist with pre-calculated buy prices, how to monitor Berkshire Hathaway’s quarterly 13F filings as a deployment signal, and why short-duration Treasuries currently yield more than the S&P 500 earnings yield, making cash a mathematically defensible position while waiting for better entry points.
Broader market valuation signals in mid-2026 add another layer to this entry price question: the Buffett Indicator at 223.6% of GDP, approximately 2.4 standard deviations above its long-run trend and above dot-com bubble peaks, means that even if Tesla’s individual transformation scenario plays out, the macro multiple compression risk applies to every stock purchased at today’s market-wide premium.
The framework this analysis has walked through applies wherever a company’s share price embeds a transformation that has not yet occurred:
Tesla’s actual future likely falls somewhere between the two scenarios. Partial execution on autonomy and robotics while the core car business continues. That middle outcome may well be good for the company. Whether it is good for the investor depends entirely on what was paid.
The more ambitious a company’s stated transformation, the more discipline explicit scenario analysis demands. Optimism embedded in a share price is invisible until the assumptions behind it are written down and tested. That is where valuation analysis begins.
This article is for informational purposes only and should not be considered financial advice. Investors should conduct their own research and consult with financial professionals before making investment decisions. Past performance does not guarantee future results. Financial projections are subject to market conditions and various risk factors.
—
—
Stock valuation analysis is the process of estimating a company's intrinsic worth using methods such as discounted cash flow modelling, price-to-earnings ratios, comparable company analysis, and price-to-sales ratios. It matters because the price an investor pays at entry determines whether even a correct long-term thesis produces positive returns.
The wide range exists because analysts disagree on which company they are valuing: an EV manufacturer, an AI and autonomy platform, or a robotics company. Each identity carries a completely different peer set and valuation logic, so the same verified financial data produces opposite conclusions depending on the framework applied.
At Tesla's current price of roughly $411 per share, the bull scenario implies annualised returns of approximately 11-35% over ten years, while the bear scenario implies negative returns, meaning the margin of safety is zero and positive returns require the full transformation to materialise. Investors who bought near the $450 peak may still be sitting on losses despite a multi-year holding period, illustrating how entry price can matter more than the underlying thesis.
A discounted cash flow model estimates a company's present value by projecting future free cash flows and discounting them back using a required rate of return. For transition-stage companies like Tesla, small changes in long-term growth assumptions compound into enormous differences in present value, which is why the analyst target range spans $25 to $600 despite all analysts working from the same financial data.
Investors should size the position to the probability of the bull case materialising, not to the conviction of the narrative. If the full bull case has a 5-10% probability of materialisation, the position should reflect that probability, ensuring the portfolio is not overexposed to a single high-upside, low-probability outcome.


