How to Value Stocks When the Future Looks Nothing Like Today
25 mins ago

Tesla trades at roughly 185x forward earnings. The S&P 500 average sits near 22x. That gap is not a mistake or an oversight. It is a collective bet on a future that has not yet happened, and it raises a question every serious investor needs to answer: how do you value a company whose current price is set by projections, not performance?
Tesla’s Q1 2026 earnings season crystallised a debate that extends far beyond any single stock. With the company simultaneously building humanoid robots, expanding a driverless ride-hail service, and navigating an NHTSA probe, the distance between bull and bear price targets is arguably the widest among any major-cap name in the market. JPMorgan sits at $145. ARK Invest’s scenario model reaches $5,800. That spread is not noise. It is a teaching instrument.
This guide uses Tesla’s bull and bear valuation scenarios as a practical framework for learning how to evaluate any company in transition: how to construct revenue and margin assumptions, how to apply appropriate multiples, and why the price paid at entry may matter more than almost any other decision in the stock valuation analysis process.
Most investors begin with a reasonable assumption: read the financial statements, apply a multiple, and arrive at a fair value. For a mature, stable business, this works. For a company like Tesla, it produces outputs that are either absurd or meaningless.
The scale of the gap: Tesla’s forward P/E of approximately 185-202x (per GuruFocus, May 2026) sits roughly 8-10x the S&P 500 average of ~22x and more than 10x the 15-20x range typical of traditional automotive peers.
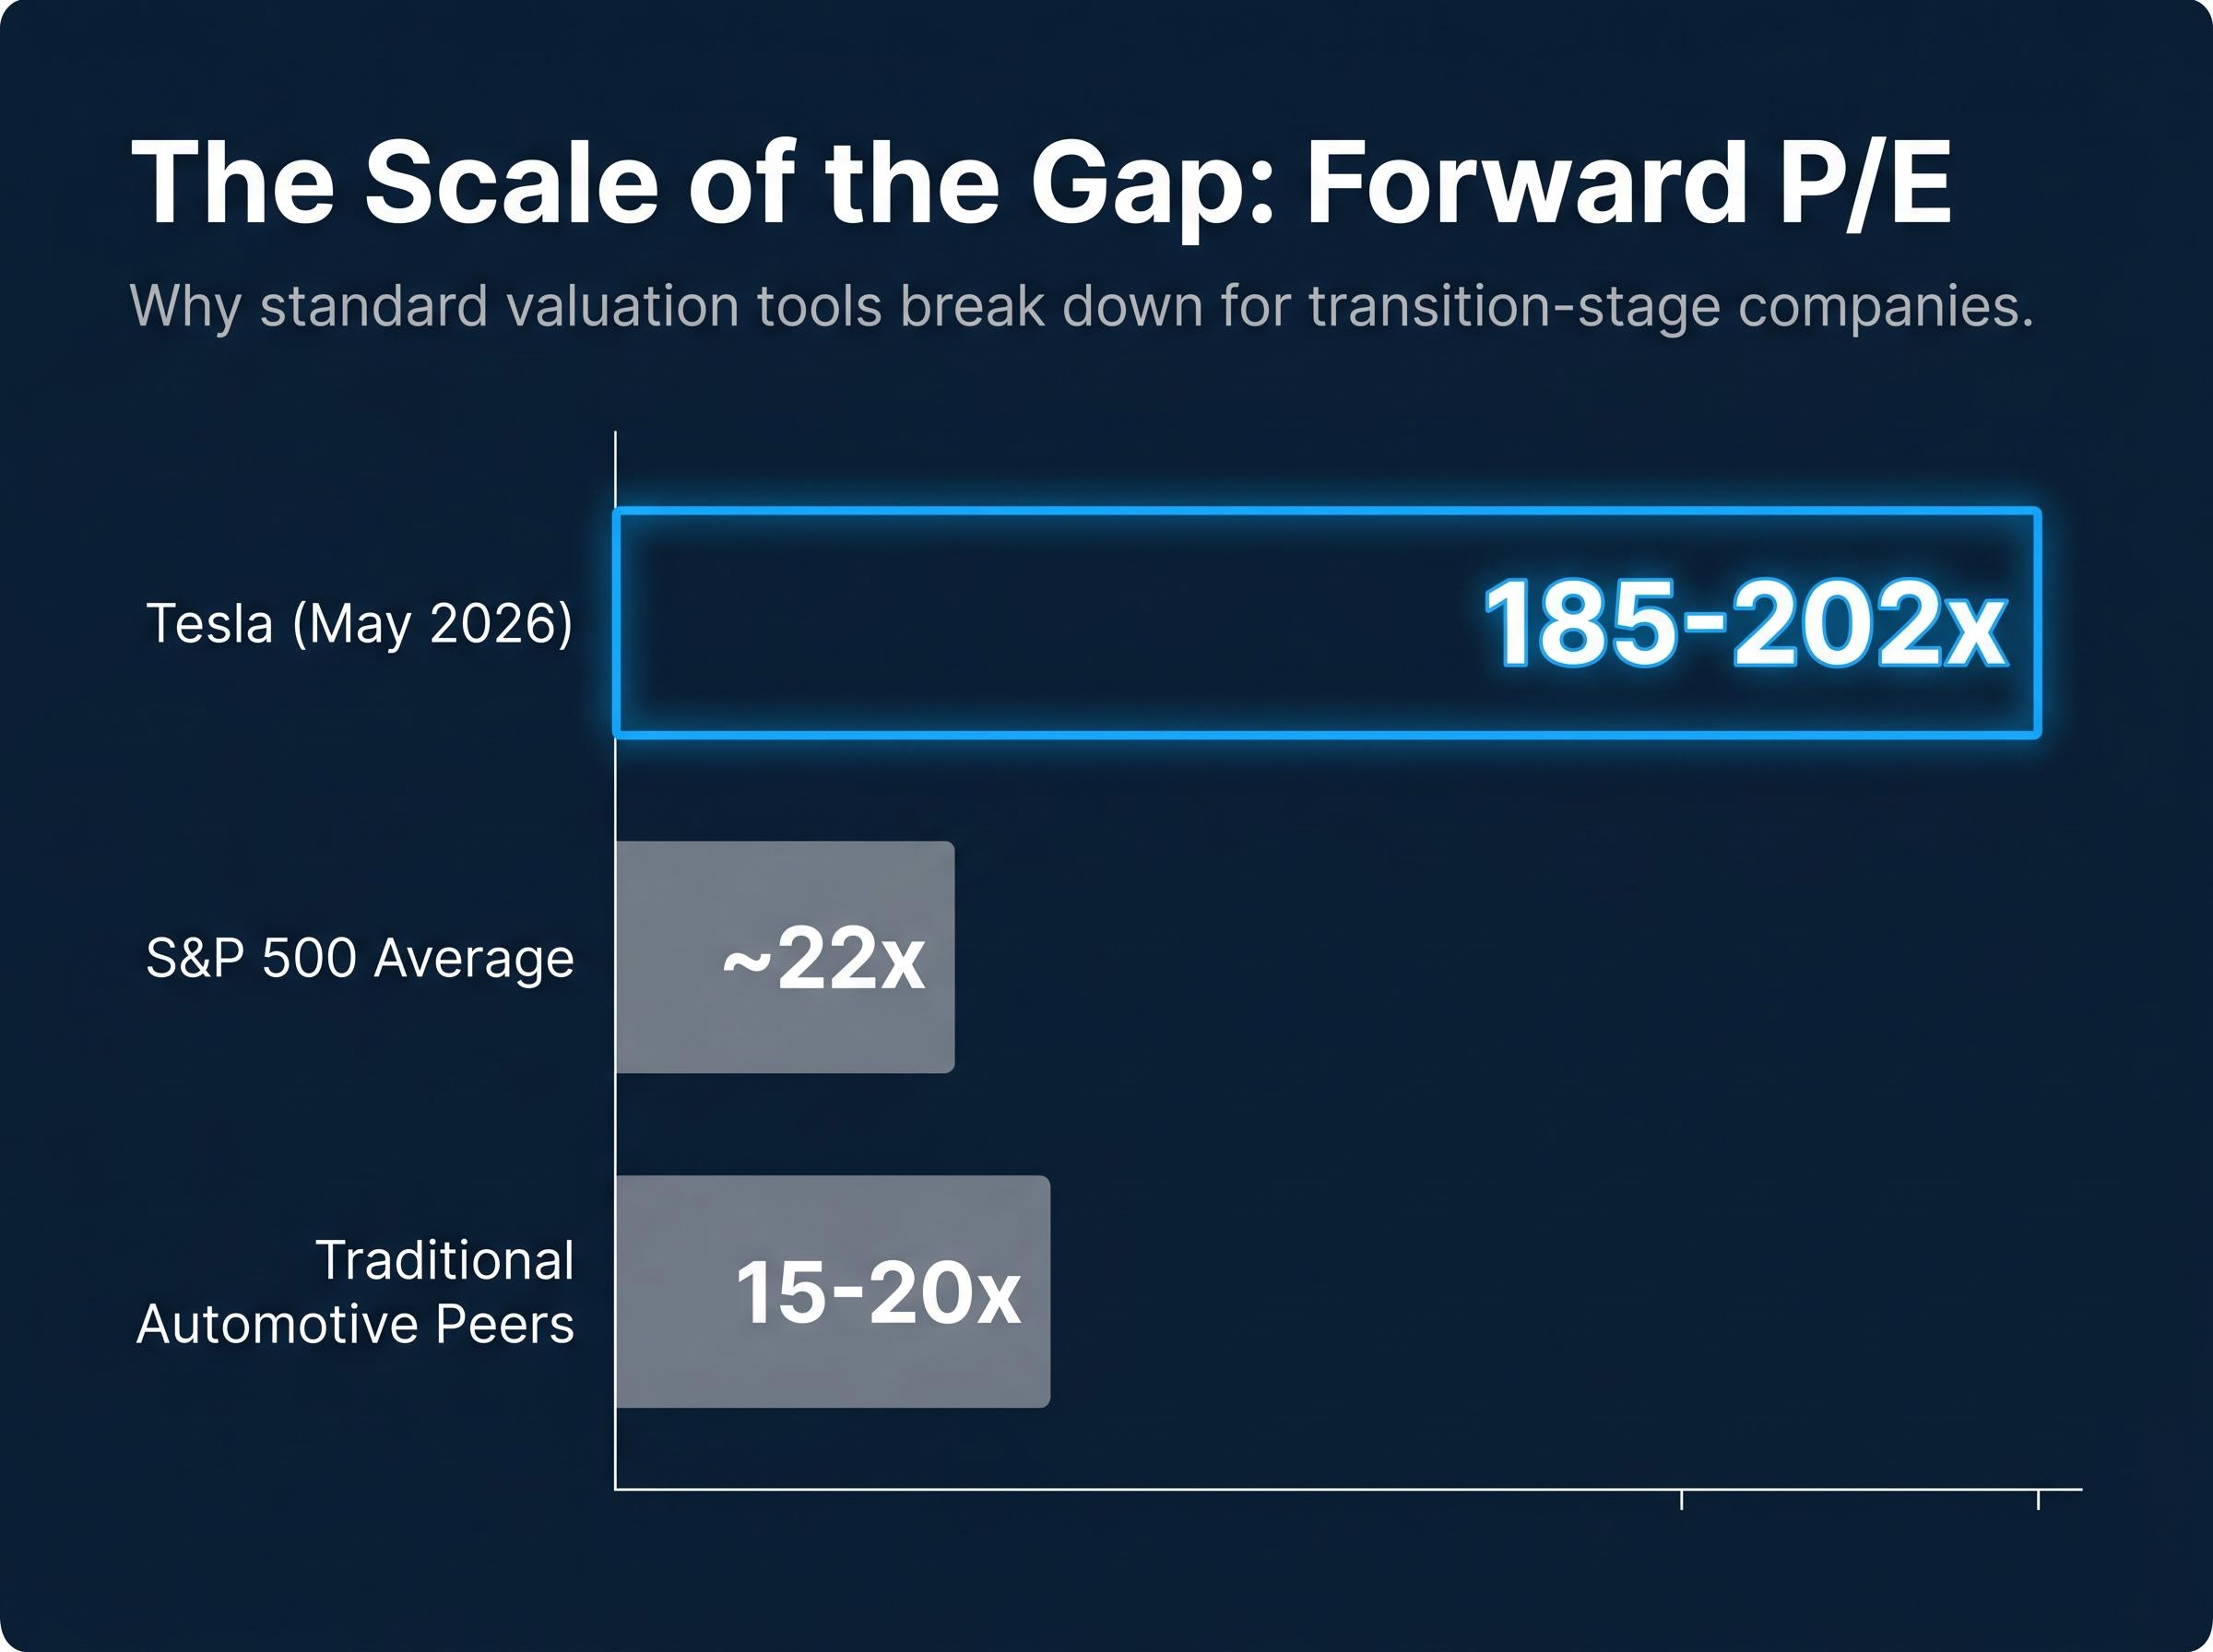
That multiple is not an analyst error. It reflects the market pricing in artificial intelligence, a robotaxi network, and humanoid robotics optionality rather than automotive fundamentals alone. Tesla’s forward earnings per share (EPS) consensus of approximately $2.00-$2.50 against a market capitalisation of roughly $1.53 trillion (as of 7-8 May 2026) makes the arithmetic plain: current earnings cannot justify the current price.
Three standard valuation approaches each distort in a specific way when applied to a transition-stage company:
The methodological challenge is clear: the investor must decide which version of the company they are actually buying, because the current price cannot be justified by the existing business alone.
The dividend discount model, which values a stock as the present value of all future dividend payments, illustrates precisely why standard valuation tools struggle with transition-stage companies: it requires a stable, predictable income stream that businesses like Tesla have not yet established and may never prioritise.
Scenario-based valuation replaces the question “what is this company worth?” with a more honest one: “what does this company need to become for the current price to make sense?”
The framework rests on three input variables that determine every scenario outcome. First, the revenue growth rate, which reflects how fast the business expands. Second, the net profit margin, which captures how much of that revenue converts to profit. Third, the exit valuation multiple, which represents what the market is willing to pay per dollar of earnings at the end of the projection period.
Bull and bear cases are not optimism versus pessimism. They are two internally consistent sets of assumptions about which version of the business materialises. The bull case assumes new business lines (robotaxi, humanoid robotics, full self-driving licensing) deliver at scale. The bear case assumes Tesla remains primarily an automotive company with software upside but without the full AI platform transformation.
| Scenario | Revenue Growth Range | Net Margin Range | Exit Multiple Range |
|---|---|---|---|
| Bull case | 20-35% (midpoint ~27%) | 20-30% | 25-35x |
| Bear case | 6-12% (midpoint ~9%) | 8-14% | 18-22x |
A 10-year horizon is standard for transition-stage companies. Shorter horizons undercount the optionality value embedded in businesses that have not yet launched their highest-margin products. Very long horizons introduce excessive uncertainty that makes the model’s outputs unreliable.
The discount rate applied to future cash flows (the rate used to express future earnings in today’s dollars) means that projections beyond 10-15 years contribute diminishing present value regardless. A dollar of earnings in year 15 is worth far less in today’s terms than a dollar in year 5, which naturally limits the model’s sensitivity to assumptions about the distant future.
The bull case connects directly to specific business lines. Revenue growth of 20-35% requires Tesla’s robotaxi network to reach commercial scale, its Full Self-Driving (FSD) software to generate meaningful licensing revenue, and its Optimus humanoid robot to begin commercial deployment within the projection horizon. Net margins of 20-30% assume these software and service-oriented revenue streams carry margin profiles far above automotive manufacturing. As of Q1 2026, Tesla reported a gross margin of 21.7%, a figure that reflects the current automotive-heavy mix; the bull case assumes this improves materially as higher-margin revenue scales.
The bear case assumes Tesla remains primarily an automaker with incremental software advantages. Revenue growth of 6-12% reflects continued vehicle sales growth without a step-change from new business lines. Net margins of 8-14% remain above Ford or General Motors (reflecting Tesla’s brand premium and software capabilities) but never reach the levels that would justify a technology-sector multiple. The exit multiple of 18-22x prices the stock closer to a premium industrial than a platform company.
| Scenario | Key Business Assumption | Projected Return (Annualised) | Implied Price Direction |
|---|---|---|---|
| Bull case | Robotaxi, Optimus, and FSD licensing reach commercial scale | Approximately 11-35% over 10 years | Significant upside from current levels |
| Bear case | Tesla remains primarily an automotive company | All projected outcomes negative at ~$375 entry | Material downside from current levels |
The starkest institutional bear anchor: JPMorgan maintains a $145 price target on Tesla as of April 2026, implying approximately 60% downside from the $411.79 closing price on 8 May 2026.
ARK Invest’s scenario model, which uses Monte Carlo simulation, projects a base case of approximately $4,600 per share, a bull case of approximately $5,800 (assigned a 25% probability), and a bear case of approximately $2,900 (also 25% probability). These figures are illustrative of the bull thesis at its most expansive, though the model’s vintage and specific assumptions warrant independent verification.
The gap between these outputs is the point. Two legitimate analytical frameworks, applied to the same company with different assumptions, produce return projections that range from significant capital loss to extraordinary wealth creation. The framework does not resolve this uncertainty. It makes it visible.
Analyst price target dispersion for Tesla reached a record for large-cap stocks in early May 2026, with targets ranging from $119 to $600, a spread that quantifies in concrete terms what the scenario framework here makes visible: two analysts applying legitimate methodology to the same company can produce outputs that differ by a factor of five.
Two investors can agree entirely on Tesla’s future business trajectory and still experience dramatically different outcomes. The variable that separates them is the price they paid at entry.
This shifts the analytical question from “is Tesla a good company?” to “is Tesla a good investment at this price?” The distinction is not academic. It is the difference between a profitable position and a loss-making one across every scenario.
Tesla shares were available near $100 a few years prior to the current trading range of approximately $411-$412 (as of early May 2026). The stock has also traded near $450 at recent peaks. That range creates vastly different return profiles for the same set of forward assumptions.
The arithmetic works in three steps:
Overpaying for a great company is a well-documented investment failure mode. Investors who purchased Tesla near its previous peaks have, in some cases, waited years without positive returns even as the underlying business improved. Post-Q1 2026 earnings, shares moved from approximately $381 in late April to approximately $412, a shift that illustrates how quickly entry price context changes. Forward analyst EPS estimates project growth greater than 5x from current levels, but those gains accrue very differently depending on the starting price.
This dynamic applies universally. Amazon, Netflix, and other transformative companies experienced extended periods where entry price alone determined whether long-term holders profited.
Every scenario model carries an implicit assumption: that the company is capable of executing on its projections. Execution risk is the probability-weighted question of whether those projections are achievable at all within the assumed timeline. No valuation multiple captures it.
Tesla’s current regulatory and permit status offers a concrete illustration. As of early May 2026, the company holds no commercial robotaxi permit in California. A DMV permit application for unsupervised FSD trials was submitted on 28 April 2026 and remains pending. A similar filing was submitted in Texas on 2 May 2026 for Austin operations. Neither has been approved. Meanwhile, Waymo (owned by Alphabet) received CPUC approval for unsupervised operations in San Francisco in February 2026 and had reportedly completed approximately 2 million paid rides by March 2026.
Four categories of execution risk apply to Tesla’s transition:
The NHTSA preliminary evaluation of FSD, opened in October 2025, specifically documents concerns about Tesla vehicles proceeding through red traffic signals and travelling against the proper direction of travel while Full Self-Driving is engaged, giving the Q1 2026 probe escalation a formal regulatory paper trail that scenario models must treat as a material risk to autonomous deployment timelines.
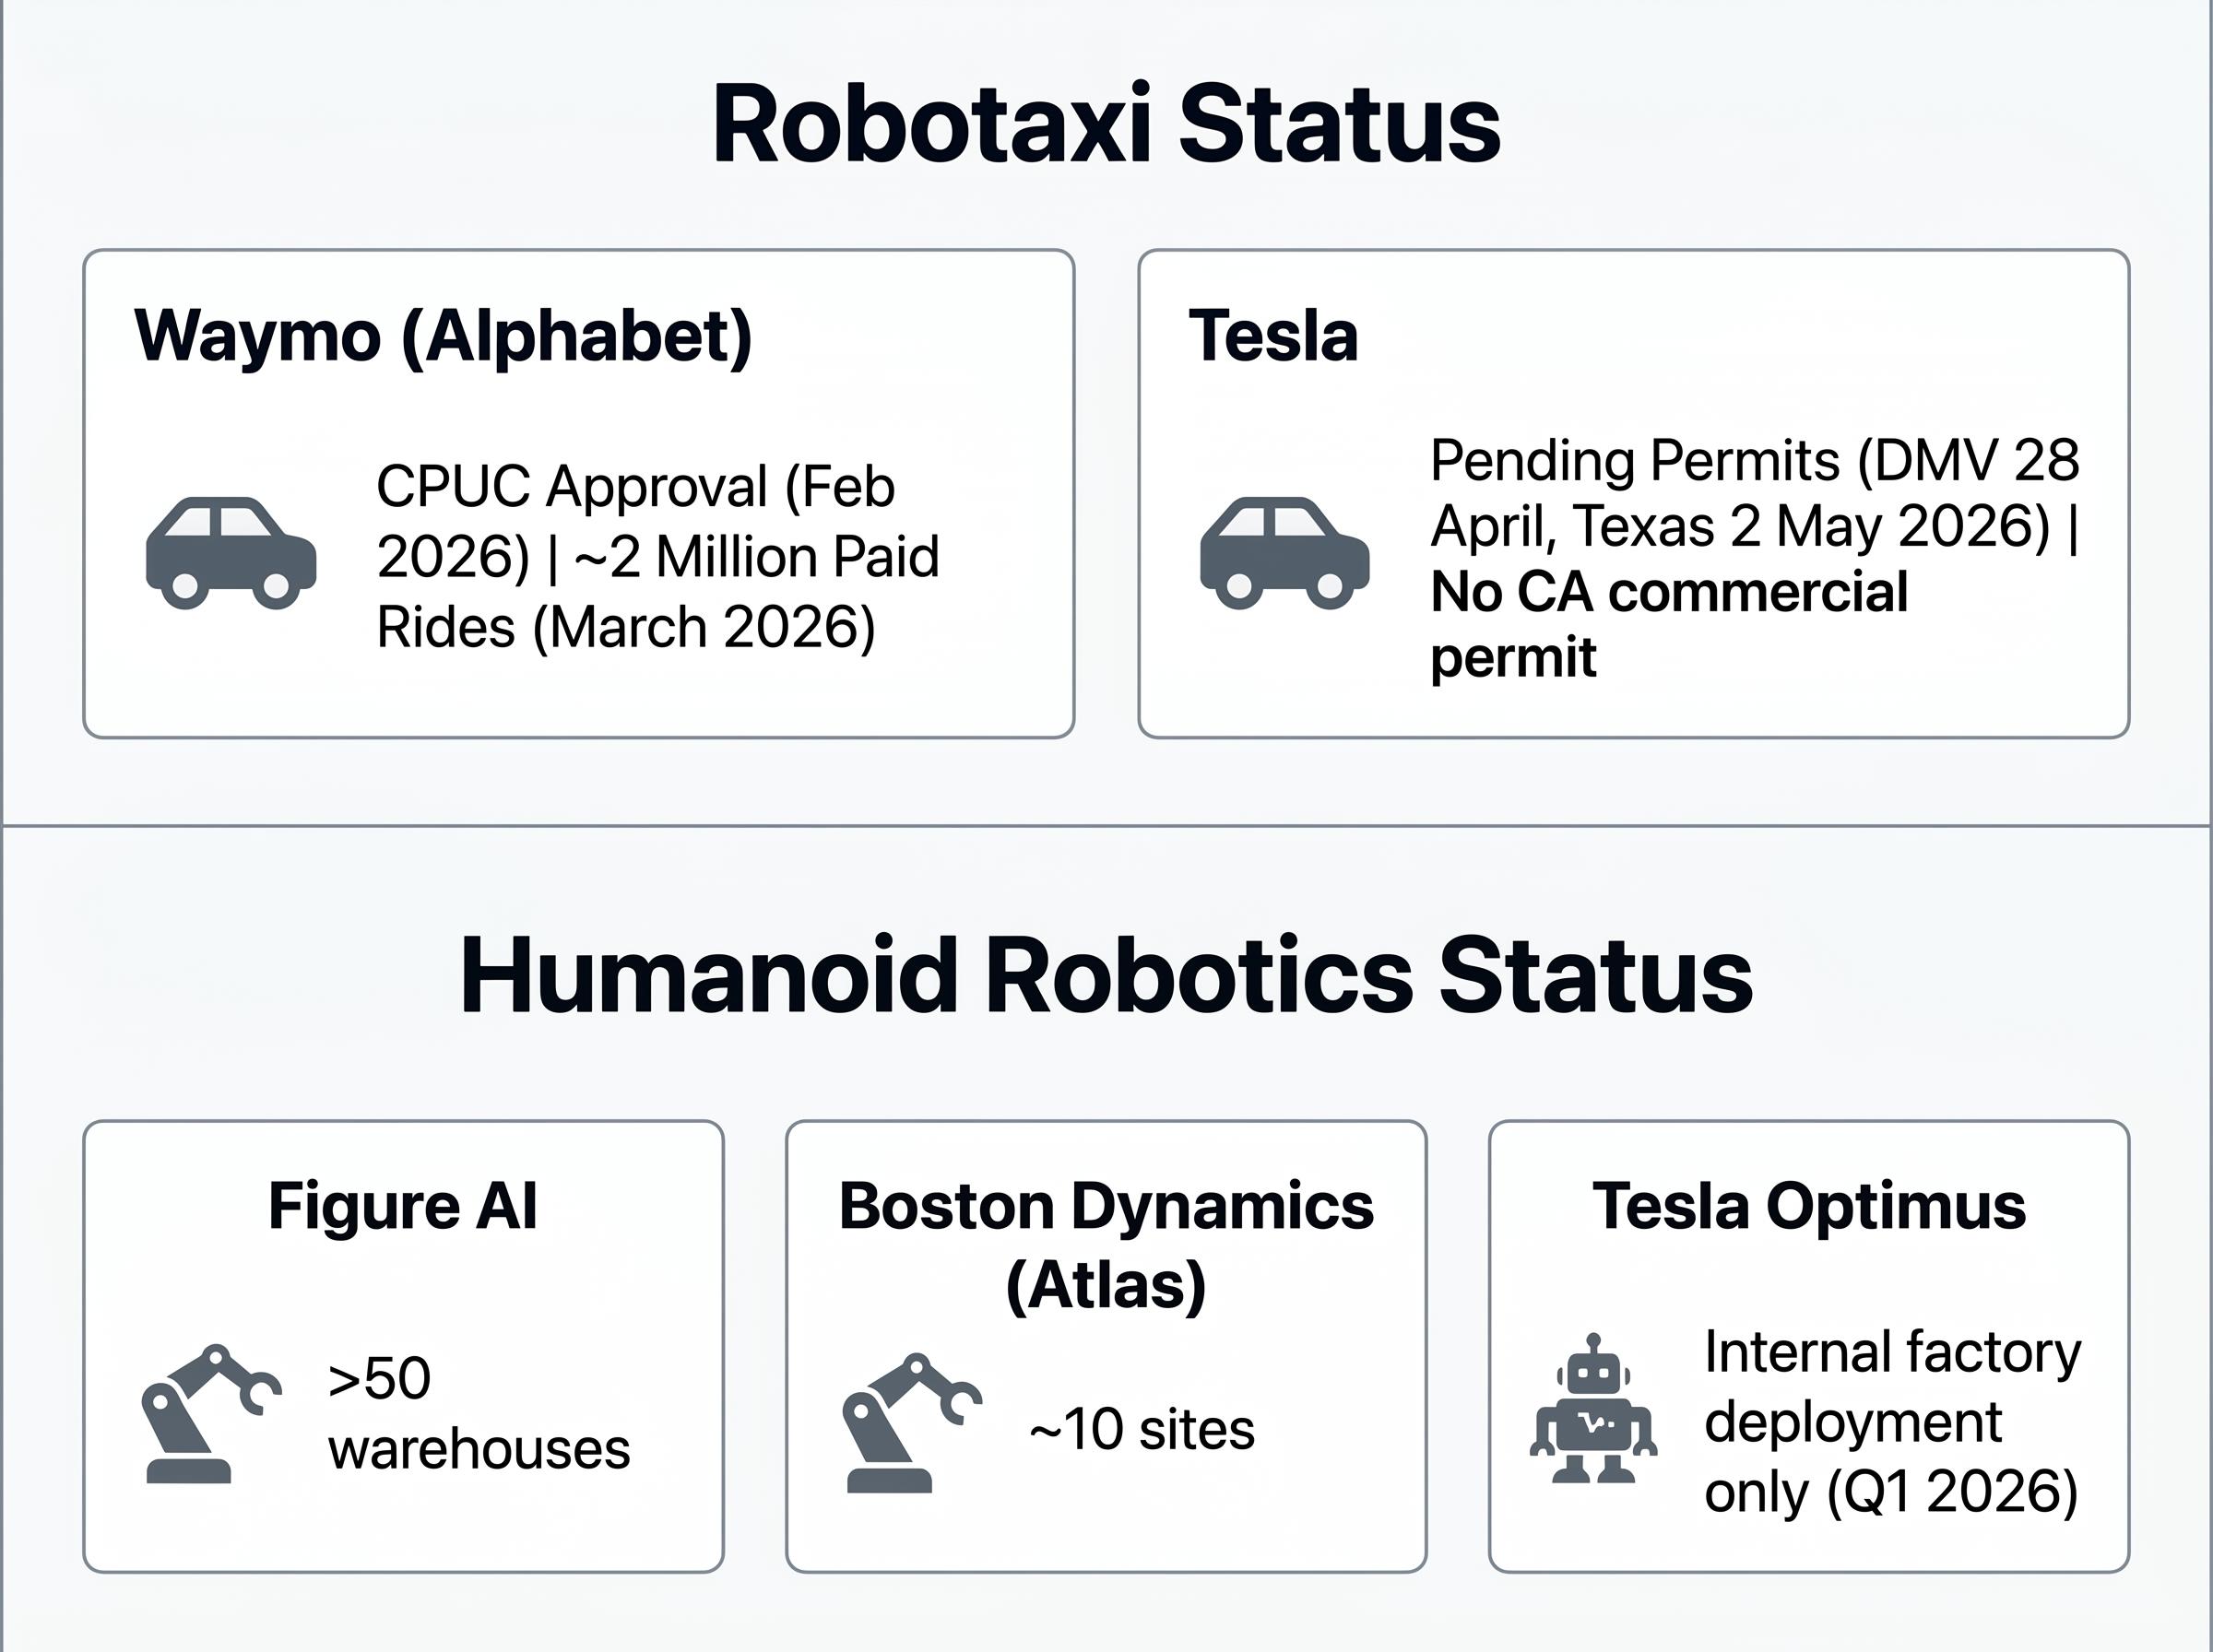
A pattern worth noting: From the 2016 claim that all Tesla vehicles had the hardware for full self-driving, through the 2019 projection of one million robotaxis by 2020, to the 2021 target of deployment-ready Optimus by 2022, Tesla’s stated timelines for its most ambitious programmes have consistently slipped by years. Optimus remains in internal factory deployment only as of the Q1 2026 earnings call.
Bulls counter with the competitive moat argument: Tesla’s real-world FSD data at fleet scale, proprietary AI chip development, and the conversion of its Fremont facility to Optimus production represent structural advantages that competitors cannot easily replicate. These advantages are real. They are also only valuable if execution follows.
The framework built across the preceding sections, scenario construction, return projection, entry price sensitivity, and execution risk assessment, converges on a final discipline: probability-weighting.
Once bull and bear return projections are established, the investor assigns a realistic probability to each and calculates an expected return that reflects genuine uncertainty rather than conviction in a single outcome.
Before applying scenario analysis to any company in transition, three questions clarify the analytical task:
Applied to Tesla specifically: if the full bull case (annualised returns of 11-35%) has a 5-10% probability of complete materialisation, and the bear case (all outcomes negative at approximately $375 entry) carries a substantially higher probability, the expected value at $411 requires careful examination. The source analysis suggests the most likely outcome is partial execution, where autonomous driving and robotics materialise partially while the core automotive business continues, a scenario that falls between the two poles.
The four-step process for any transition-stage investment:
This is the skill that separates investors who use scenario analysis to clarify decisions from those who use it to confirm what they already wanted to believe. The same three-variable framework used here applies to any company where the current valuation embeds a future business that does not yet exist in the financials, from early-stage biotech to established industrials pivoting to software.
The gap between Tesla’s bull and bear case is not a reason to buy or sell. It is a map of the analytical work every investor must complete before entering a position in a transition-stage company.
The framework built here rests on three core variables (revenue growth, net profit margin, and exit valuation multiple) and two additional layers that sit outside the model itself: entry price sensitivity and execution risk probability. Together, these five elements form a portable methodology applicable to any company whose current valuation cannot be justified by its existing business alone.
Tesla’s robotaxi permit outcomes, Optimus commercial deployment progress, and margin trajectory over the next two to four quarters will be the data points that begin to resolve which scenario is closer to reality. That makes this a framework worth revisiting as new evidence arrives.
For investors who want to situate Tesla’s premium within the wider market context, our full explainer on broad US equity overvaluation signals examines the Buffett Indicator at 223.6%, the unfavourable equity earnings yield versus Treasury yield spread, and Berkshire Hathaway’s $373 billion cash reserve as three converging frameworks that raise questions about the risk-adjusted return available across US equities, not just in single high-multiple names.
This article is for informational purposes only and should not be considered financial advice. Investors should conduct their own research and consult with financial professionals before making investment decisions. Past performance does not guarantee future results. Financial projections are subject to market conditions and various risk factors.
Readers looking to practise the methodology might apply the scenario framework to a company in their own portfolio that currently trades at a premium to conventional valuation metrics, using the three-variable structure and honest probability assignments as the starting discipline.
Scenario-based stock valuation analysis replaces a single fair-value estimate with two or more internally consistent sets of assumptions (bull and bear cases), each built from three variables: revenue growth rate, net profit margin, and exit valuation multiple. The investor then assigns probabilities to each scenario to calculate an expected return that reflects genuine uncertainty.
Standard tools like price-to-earnings ratios are anchored to current or near-term earnings, which are suppressed by heavy investment spending in transition-stage companies. A high multiple can look irrational if earnings never grow, but reasonable if earnings expand significantly over the next decade, so the investor must decide which version of the company the current price actually reflects.
Two investors who agree on a company's future trajectory can experience dramatically different outcomes based solely on their entry price. For example, at a bear-case entry price of approximately $375 for Tesla, all projected bear-case outcomes are negative, while an investor who entered near $100 would likely see positive returns even in the bear scenario.
Scenario models cannot capture whether a company will actually deliver on its projections within the assumed timeline. For Tesla specifically, the four key execution risk categories are regulatory approvals (no commercial robotaxi permit in any major US market as of early May 2026), technology readiness (an active NHTSA probe into FSD incidents), competitive displacement from rivals like Waymo and Figure AI, and a historical pattern of stated timelines slipping by years.
Once bull and bear return projections are established, the investor assigns a realistic probability to each scenario and calculates a weighted average expected return. If the full bull case carries a 5-10% probability of complete materialisation while the bear case carries a substantially higher probability, the expected return at the current entry price may not justify the risk, even if the upside scenario is extraordinary.