How to Value Stocks When the Future Looks Nothing Like Today
25 mins ago

Tesla trades at a trailing price-to-earnings ratio of roughly 317 to 366 times earnings as of early May 2026, yet the Wall Street consensus price target sits almost exactly where the stock is trading now. That contradiction is not a data error. It is the entire valuation puzzle in a single statistic.
Tesla’s Q1 2026 results beat expectations on revenue ($22.39 billion, up 16% year-over-year), earnings per share ($0.41), and gross margin (21.1%, the highest since Q4 2024). The stock still fell 3.56% the day after the announcement. For investors trying to understand why a company can beat estimates and drop, or why a stock can trade at 300-plus times earnings without being obviously irrational, Tesla in mid-2026 offers a masterclass in what happens when a business is priced for a transformation that has not yet arrived.
This guide uses Tesla’s actual Q1 2026 numbers, published analyst scenarios, and a structured bull/bear stock valuation analysis framework to teach a transferable methodology: how to model divergent scenarios for any high-optionality company, how entry price shapes the probable return range, and how to use that spread to make a disciplined decision about risk.
The confusion is understandable. Standard screening tools were built for businesses with a stable revenue mix, where trailing earnings provide a reasonable proxy for future earnings. Tesla breaks that assumption.
When a company’s future revenue composition is expected to differ radically from its current revenue composition, the most common valuation anchors lose their anchoring power:
These metrics work well for Ford and GM, which trade at roughly 5 to 10 times earnings. They struggle with Tesla precisely because the market is pricing in business segments that do not yet contribute material revenue.
The core automotive business is healthy. A 21.1% GAAP gross margin confirms that. But that margin alone does not come close to justifying a 300-plus trailing P/E. The gap is being filled by investors pricing in a version of the company that may exist in a decade: one where robotaxi fleets and humanoid robots become majority revenue contributors.
Tesla’s Q1 2026 earnings beat every Wall Street consensus metric on revenue, adjusted EPS, and gross margin, yet the stock fell roughly 3.56% the day after the announcement, a reaction that reflects how little weight the market assigned to automotive performance relative to the unresolved questions around Cybercab permitting, Optimus commercialisation, and the $25 billion-plus capital expenditure programme the company has committed to funding in a single year.
For transition-stage companies, the central valuation question shifts. It moves from “what is this company worth today?” to “which version of this company will exist in ten years, and what is that version worth?”
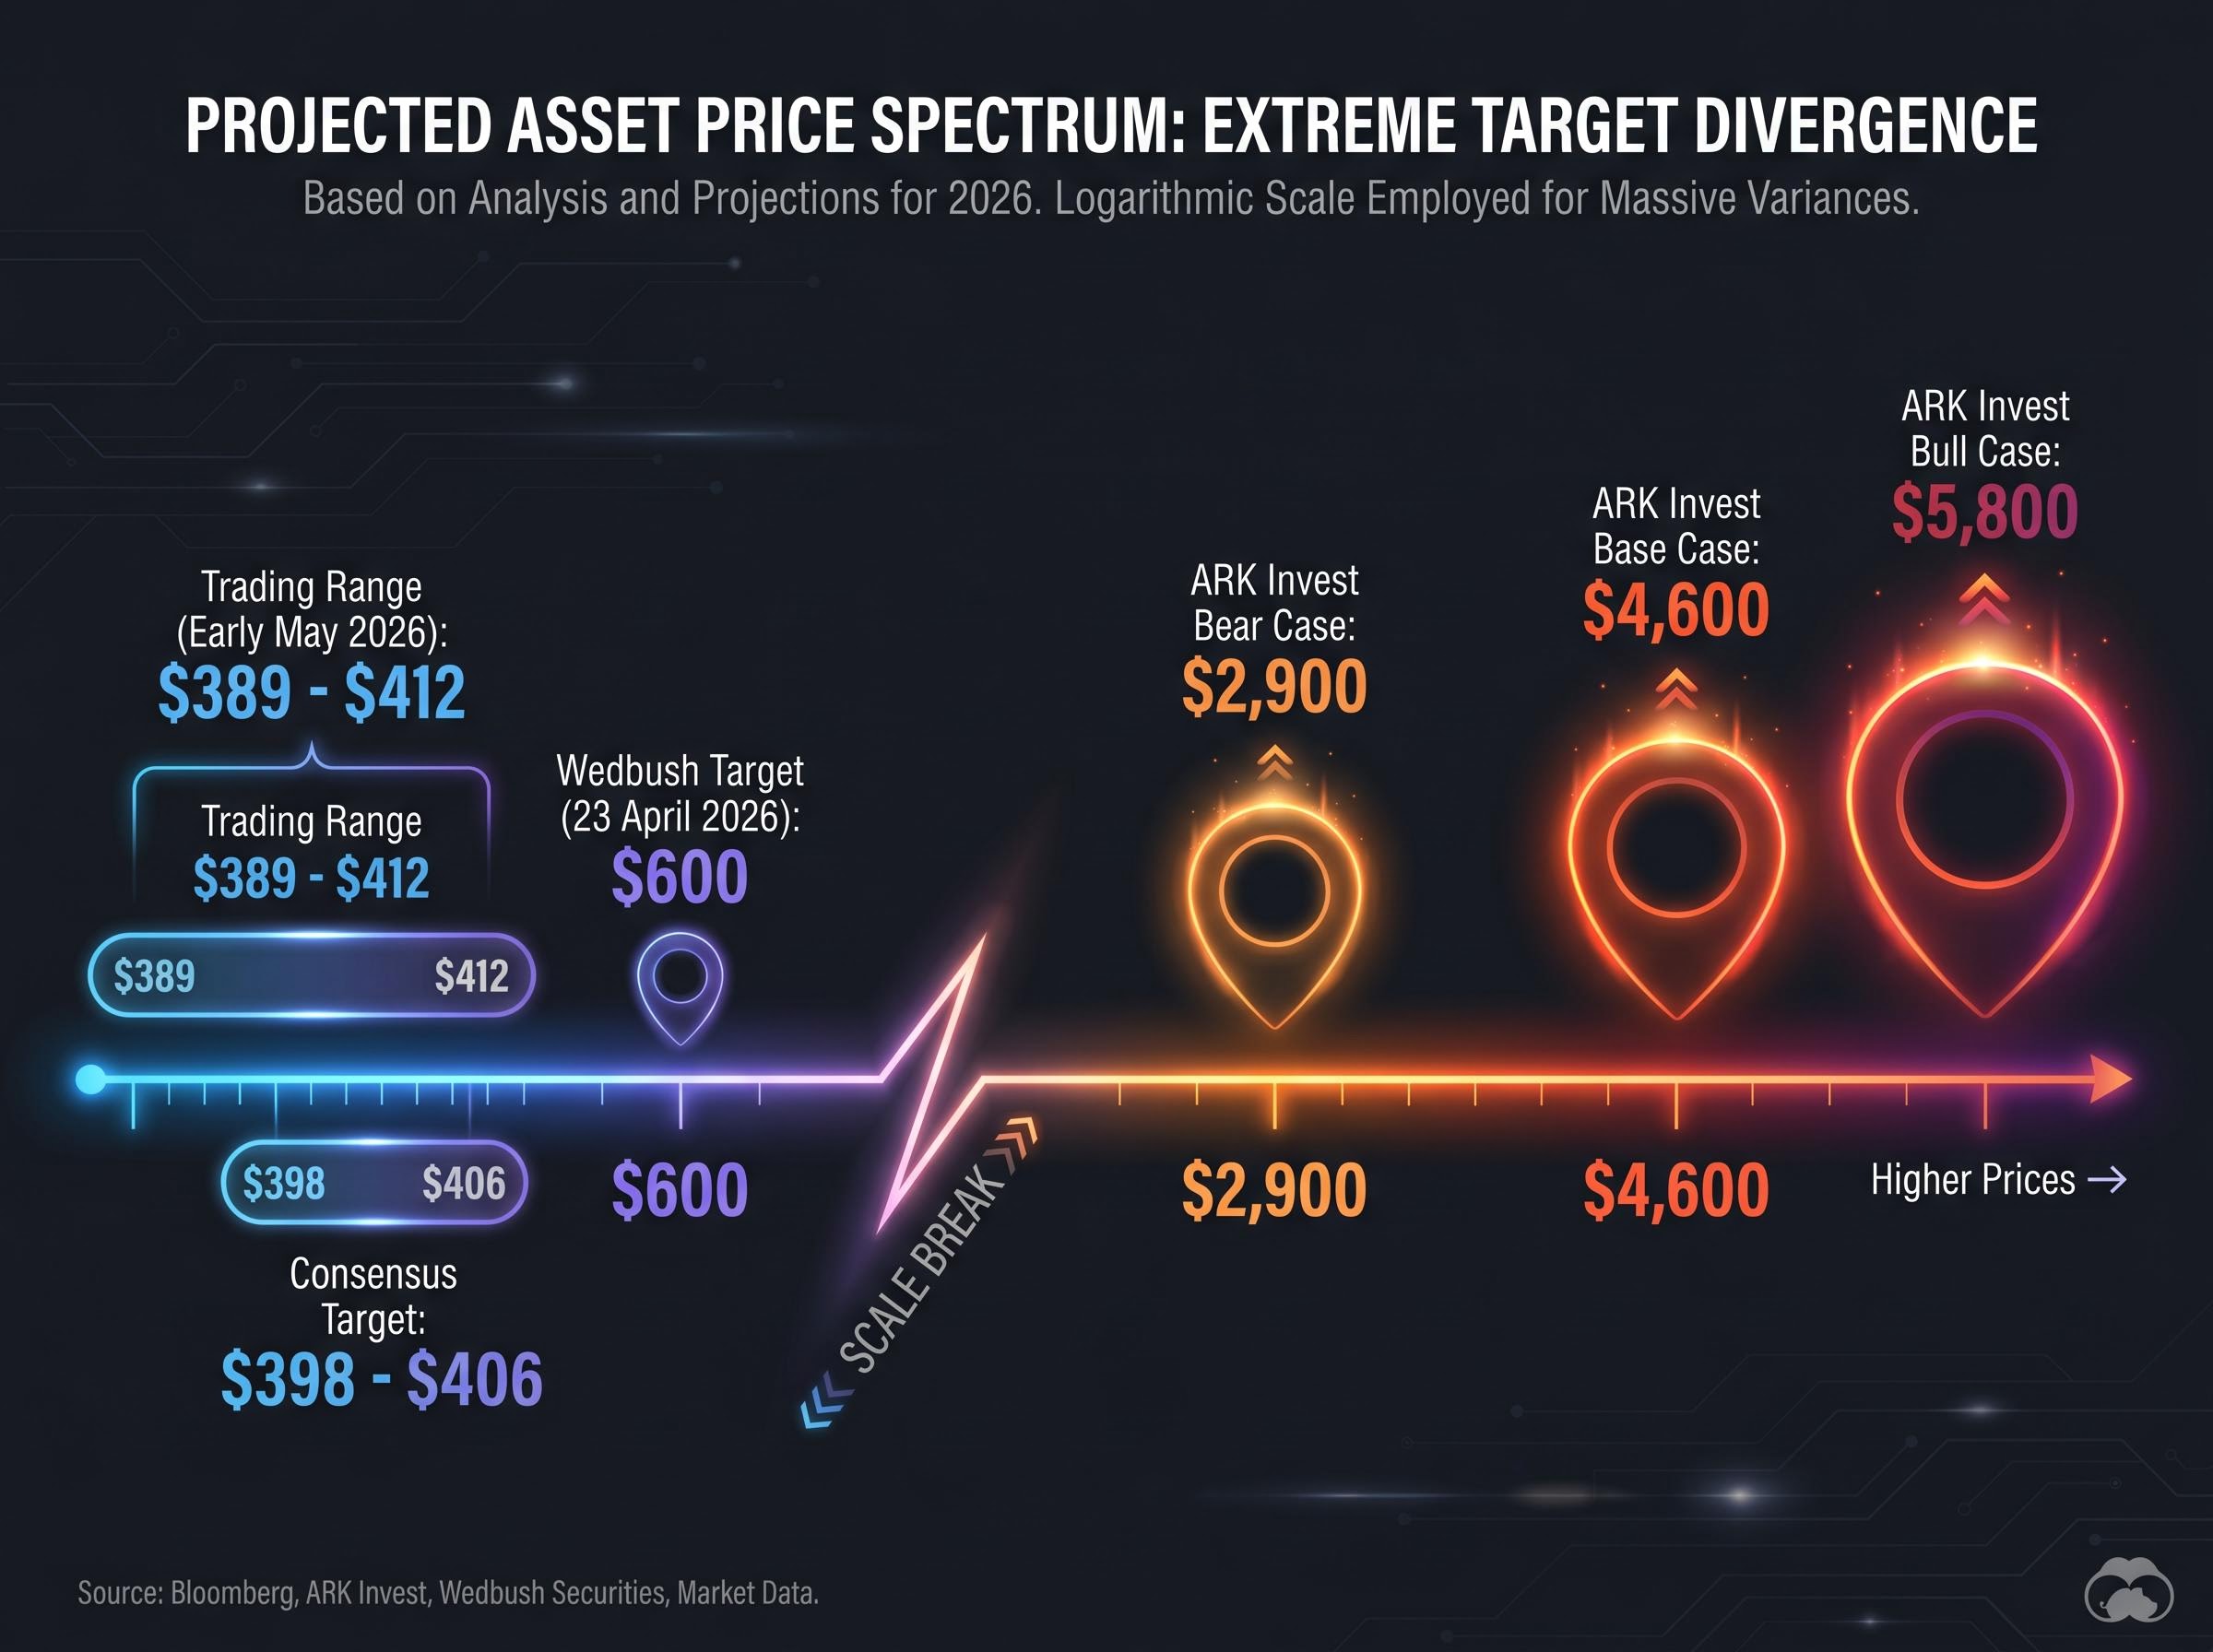
ARK Invest’s open-source valuation model illustrates how wide that disagreement can be: its bear case sits at $2,900 per share, while its bull case reaches $5,800, a spread that represents two fundamentally different companies sharing the same ticker symbol.
Two intelligent analysts can examine the same set of financials and reach price targets that differ by a factor of two or more. That divergence is not a sign someone is wrong. It reflects genuinely different assumptions about which business Tesla becomes.
The bull case requires three linked conditions to materialise. First, autonomous deployment reaches commercial scale, with Tesla’s robotaxi network generating the majority of revenue. Second, Optimus humanoid robot production begins contributing commercial revenue by 2027. Third, the margin profile shifts from automotive economics toward software economics.
In modelled terms, this translates to revenue growth in the 20% to 35% range, net profit margins expanding to 20% to 30% (from a current 7% to 10%), valuation multiples of 25x to 35x earnings, and projected annualised returns of 11% to 35% over a ten-year horizon.
ARK Invest attributes approximately 60% of its expected value and more than 50% of expected EBITDA to the robotaxi segment alone. Forward analyst earnings-per-share estimates project more than 5x growth from current levels, likely incorporating autonomous and Optimus contributions. Research from ARK assigns a 5% to 10% probability to the full bull case materialising.
The bear case assumes Tesla remains primarily an electric vehicle manufacturer. Revenue growth moderates to 6% to 12%, margins settle between 8% and 14% (above Ford and GM but well below the bull scenario), and the appropriate multiple compresses to 18x to 22x earnings.
At an entry price of approximately $375, every modelled bear case outcome produces negative returns. That finding does not reflect a company failure thesis. The bear case still gives Tesla credit for being a well-run automaker with above-average margins. Negative returns in this scenario are a function of entry price, not business quality.
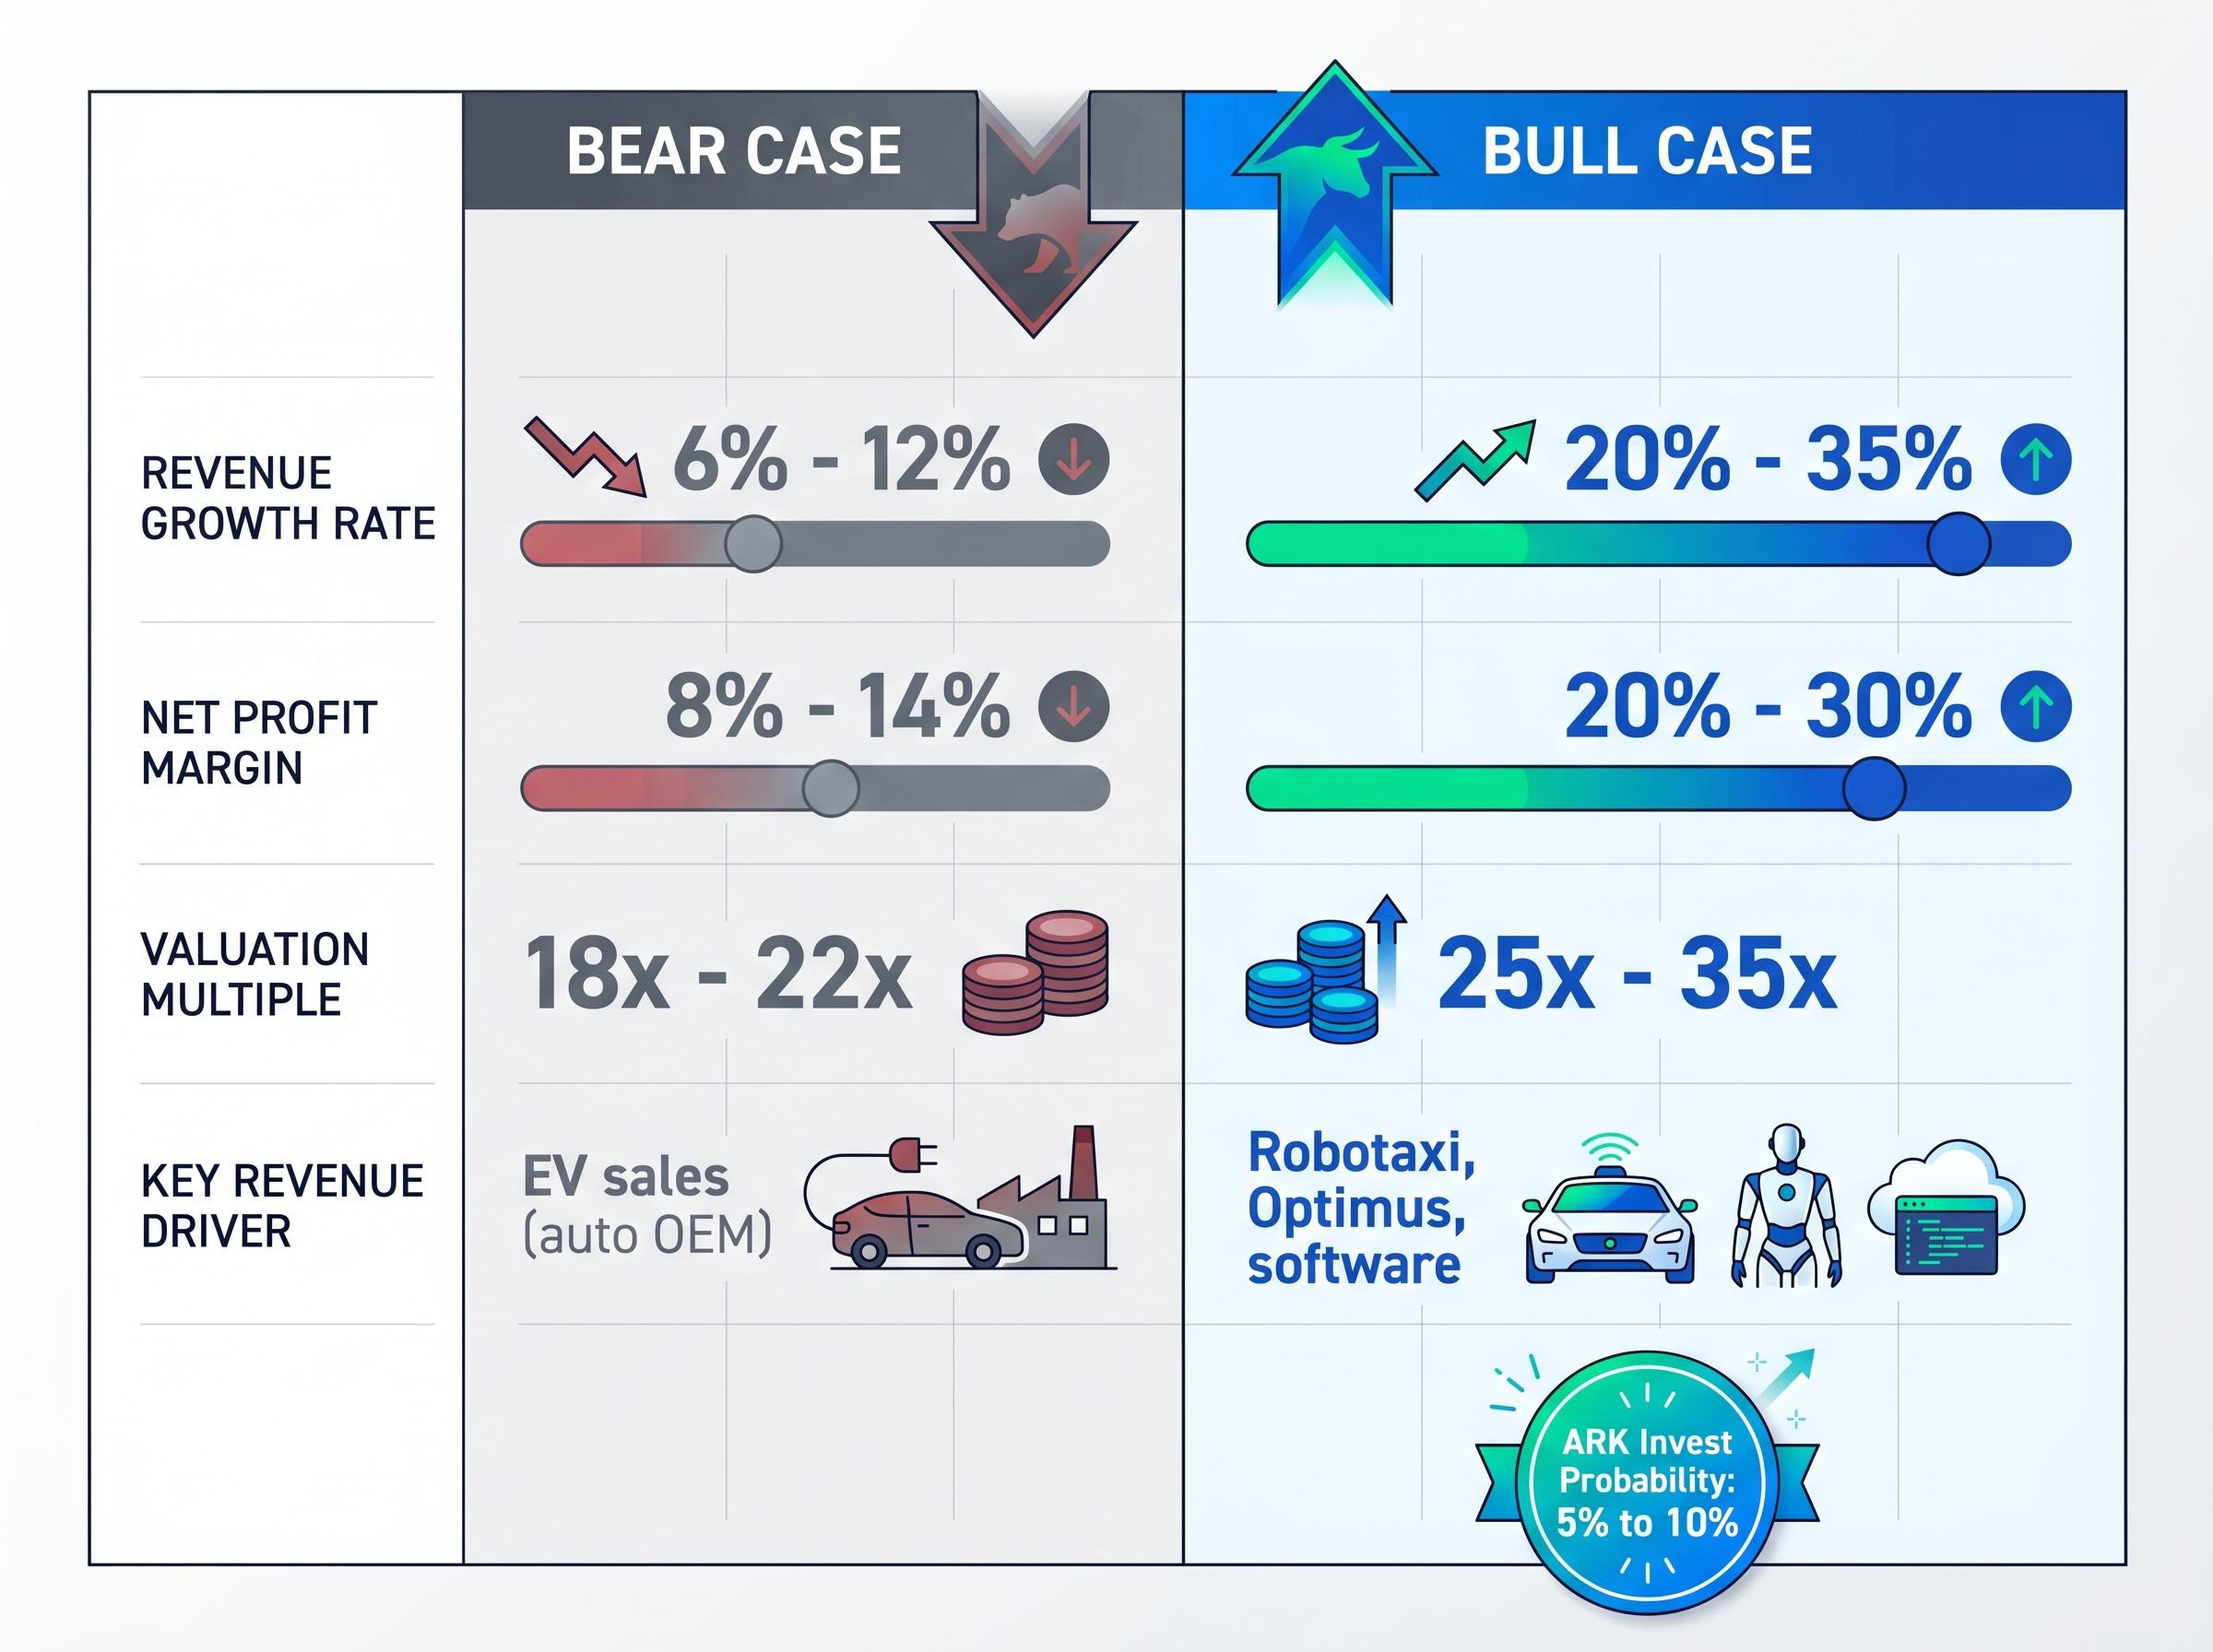
| Assumption | Bear Case | Bull Case | Current Reality |
|---|---|---|---|
| Revenue growth rate | 6%-12% | 20%-35% | 16% YoY (Q1 2026) |
| Net profit margin | 8%-14% | 20%-30% | ~7%-10% |
| Valuation multiple | 18x-22x | 25x-35x | ~317-366x trailing P/E |
| Key revenue driver | EV sales (auto OEM) | Robotaxi, Optimus, software | ~57% EV, 43% services |
The return an investor ultimately earns is more a function of the price paid than the quality of the business purchased. Tesla’s own price history over the past several years makes this viscerally concrete.
A buyer who acquired shares at approximately $100 a few years prior and a buyer entering at $400 to $450 in late 2025 are investing in the same company. They face entirely different probable return ranges under the same set of future outcomes. The business they own is identical; the mathematics of their investment are not.
Consider three entry price scenarios under the same bear and bull assumptions:
“At approximately $375 per share, all projected return outcomes under the bear case were negative.”
Tesla closed at $449.72 on 31 December 2025. By early May 2026, shares traded in the $389 to $412 range, approximately 8% to 11% below that year-end level. Investors who bought near the $450 peak may still be sitting on losses even after a Q1 2026 earnings beat.
Entry price is the one variable every investor controls completely. Understanding its leverage on future returns may be the most practical skill any valuation framework can deliver.
The concept of margin of safety, where an investor only commits capital when the price paid sits sufficiently below the estimated intrinsic value to absorb execution error, is precisely the discipline that the bear case analysis above is designed to test; at approximately $375 to $400 per share, the spread between the bull and bear outcomes leaves very little buffer if the key autonomous assumptions slip.
Tesla illustrates a broader principle. When a company operates multiple business segments at different stages of maturity, a single blended metric obscures more than it reveals. Sum-of-the-parts valuation, where each segment is assessed independently before being combined into a consolidated estimate, is the appropriate structure.
Tesla’s automotive segment operates with margin profiles comparable to (though above) legacy auto manufacturers: approximately 5% to 8% operating margin for the peer group, implying a lower revenue multiple. The robotaxi and software segment, if and when operational at scale, could generate margins of 25% to 50-plus percent, implying a SaaS-style or platform-style revenue multiple.
Sum-of-parts valuation becomes essential whenever a single consolidated earnings multiple distorts the picture, a dynamic that appears not only in Tesla’s automotive-versus-robotaxi split but also in Meta’s Family of Apps segment carrying the full weight of Reality Labs losses, where the widely cited forward P/E understates the core advertising business’s actual profitability.
| Dimension | Auto OEM Segment | Robotaxi/Software Segment |
|---|---|---|
| Margin profile | 5%-8% operating margin | 25%-50%+ if operational |
| Comparable peers | Ford, GM, Toyota | Uber, Waymo (private), SaaS platforms |
| Appropriate multiple | Lower revenue multiple (auto norms) | Higher revenue multiple (platform economics) |
| Key risk | EV competition, margin pressure | Regulatory delay, execution failure |
The blended valuation depends critically on which segment is expected to dominate the long-term revenue mix. ARK Invest’s model assumes robotaxi becomes the majority contributor, which is why its price targets are multiples of the consensus. The model is open-source on GitHub and invites users to stress-test individual assumptions.
A structured scenario-building process applies to any high-optionality company:
Five sensitivity variables matter most for Tesla specifically: robotaxi total addressable market penetration rate, vehicle unit growth, blended gross margin evolution, regulatory timeline risk, and competitive encroachment on full self-driving market share.
A structured sum-of-the-parts approach forces the investor to make assumptions explicit. That is where honest risk assessment actually happens.
The scenario framework identifies what needs to go right. The question now is what stands in the way.
Tesla announced Cybercab production beginning in April 2026, marking the formal launch of its autonomous vehicle manufacturing programme. Production is one thing. Permission to operate commercially is another.
Elon Musk’s track record shows a pattern of eventual delivery on core innovations paired with consistent slippage on stated timelines. This pattern matters for valuation because the current share price embeds assumptions about speed of execution, not merely eventual arrival.
Each of these milestones was missed. That does not mean the technology will never arrive. It does mean that timelines embedded in current price targets carry execution risk that has historically materialised.
Tesla’s projected 2026 capital expenditures are expected to exceed $25 billion, generating substantial negative free cash flow while simultaneously funding robot manufacturing, AI chip development (AI5), and Cybercab production.
The Q2 2026 delivery and production report, expected in early July 2026, is identified as the next concrete data point for assessing whether robotaxi execution is on track.
Three legitimate analytical frameworks look at the same company and reach wildly different conclusions. The consensus analyst target sits at approximately $398 to $406. Wedbush issued a $600 price target on 23 April 2026. ARK Invest’s base case is $4,600. The disagreement is structural, not a sign that any single analyst is wrong.
With approximately 3.538 billion shares outstanding, each $1 move in Tesla’s stock represents roughly $3.5 billion in market capitalisation. That figure contextualises how much capital is riding on which version of the future proves correct.
The most likely outcome for most investors may fall between full bull and full bear. Partial execution, where some assumptions prove correct and others do not, is the scenario that probability distributions actually favour. Returns in that middle ground will depend on which specific inputs materialise and at what speed.
The framework built across this guide applies wherever a stock price embeds a transformation that has not yet been confirmed:
“When the bear case at today’s price produces no positive return outcome, the market has already priced in execution success. The decision becomes whether that execution will happen.”
This article is for informational purposes only and should not be considered financial advice. Investors should conduct their own research and consult with financial professionals before making investment decisions. Past performance does not guarantee future results. Financial projections are subject to market conditions and various risk factors.
Valuation is not about finding the right number. It is about understanding which version of the future is already embedded in the price and deciding whether there is sufficient conviction to accept that bet.
Three concrete actions apply this week:
For investors who reach a fair value estimate but remain uncertain about near-term execution risk, the relationship between entry price and position sizing becomes the practical mechanism through which conviction is expressed: a smaller initial position at a higher price preserves the ability to add at lower entry points if the bear case begins to materialise.
For investors monitoring Tesla specifically, three catalysts define the near-term reassessment calendar:
The methodology outlined here, segment the business, model the scenarios, weight the probabilities, and test the entry price, converts uncertainty from a reason for paralysis into a structured decision. The numbers will change. The process does not.
Scenario-based stock valuation analysis involves constructing explicit bull, base, and bear cases with stated assumptions for revenue growth, profit margins, and valuation multiples, then assigning probability weights to each to calculate an expected value. This approach is particularly useful for companies in transition, where a single blended metric like trailing P/E fails to capture fundamentally different possible futures.
Tesla's trailing P/E of roughly 317 to 366 times earnings reflects investors pricing in future revenue segments, such as robotaxi networks and humanoid robotics, that do not yet contribute material profit. Traditional automakers like Ford and GM trade at 5 to 10 times earnings because their revenue mix is stable and well understood, while Tesla's current multiple embeds assumptions about a business transformation that has not yet been confirmed.
Entry price directly determines the probable return range before any business decision is made. At approximately $100 per share, both bull and bear scenarios for Tesla produce positive returns, while at approximately $400 per share the bull case still projects 11% to 35% annualised returns but every modelled bear case outcome produces negative results, meaning the investor is betting that execution succeeds.
Sum-of-the-parts valuation assesses each business segment independently using margin and multiple assumptions appropriate to that segment, then combines the results into a consolidated estimate. It is most useful when a company operates multiple units at different maturity stages, such as Tesla's automotive segment and its prospective robotaxi or software segment, where blending them into a single metric distorts the picture.
The primary risks include regulatory delays on commercial robotaxi permits (no new California DMV or CPUC permits had been confirmed as of early May 2026), a historical pattern of timeline slippage on autonomous and robotics milestones, competition from Waymo's established commercial operations and humanoid robotics rivals, and capital expenditure exceeding $25 billion in 2026 generating substantial negative free cash flow.