On a $100,000 portfolio, the yield gap between concentrated and broadly diversified covered call ETFs translates to roughly $10,000 in annual distributions. Whether that extra income represents genuine premium capture or a disguised return of capital depends entirely on the mechanics underneath the headline number. In the current volatility environment, with the VIX averaging approximately 18.93 in 2025 (elevated relative to the 12-15 pre-2023 baseline), income investors face a genuine fork: funds like QDVO and DIVO posting 18-25% distribution yields versus JEPI, XYLD, and JEPQ in the 9-11% range. Both categories sell options against equity holdings. The structural reasons they produce such different income numbers matter enormously to anyone allocating real capital. This analysis unpacks what drives the yield gap, what total return data reveals about sustainable income versus NAV erosion, and how investors can deploy both approaches strategically rather than treating the choice as binary.
The observed yield gap: a quantitative look across major funds
The trailing twelve-month distribution yields as of April-May 2025 illustrate the scale of the divide.
| Fund | Category | TTM Yield | AUM | Holdings |
|---|---|---|---|---|
| QDVO | Concentrated | ~21% | ~$500M | 20-40 |
| DIVO | Concentrated | ~18.5% | ~$2.5B | 20-30 |
| GPIX | Concentrated | ~22.4% | ~$500M-$1B | 30-40 |
| GPIQ | Concentrated | ~21.8% | ~$500M-$1B | 30-40 |
| XYLD | Diversified | ~10.5% | ~$7B | S&P 500 |
| QYLD | Diversified | ~11.5% | ~$7-8B | Nasdaq-100 |
| JEPI | Diversified | ~9.2% | ~$28B | S&P 500 (ELN) |
| JEPQ | Diversified | ~10.5% | ~$12B | Nasdaq-100 (ELN) |
The equally weighted average of the concentrated group reaches approximately 21.6%, versus approximately 11.86% for the diversified equivalents. On a $100,000 allocation, that translates to roughly $21,000 annually from the concentrated category versus approximately $11,000 from diversified funds.
The gap is real, but so is a qualification that headline screeners do not surface. High distribution yields in concentrated ETFs frequently include a return of capital (ROC) component, where part of each distribution draws from the fund’s asset base rather than option premium income alone. ROC can erode NAV by 5-10% annually. QDVO, launched in August 2024, carries a partial track record that limits the ability to evaluate long-term NAV sustainability. Updated 2026 figures show JEPI with AUM approaching $35B and a TTM yield of approximately 8.5%, reflecting modest yield compression as volatility moderates.
For investors evaluating whether the ROC classification in concentrated ETFs is a feature or a risk, our full explainer on ROCQ and ROCY covers how JP Morgan engineered FLEX options call spreads into two new covered call funds specifically to produce return-of-capital distributions for taxable accounts, including a detailed breakdown of how the tax treatment differs from JEPI and JEPQ and what to verify on your 1099-DIV before treating ROC distributions as confirmed.
When big ASX news breaks, our subscribers know first
The risk profile gap: volatility, drawdowns, and premium compression
Past returns describe what happened. The risk profile describes what could happen next, and the two fund categories diverge more sharply on risk than on yield.
| Risk Factor | Concentrated ETFs | Diversified ETFs |
|---|---|---|
| NAV erosion (annual) | 5-10% possible | 3-5% in bull markets |
| Typical drawdown range | ~-12% in vol spikes | ~-6% in vol spikes |
| Premium compression exposure | High (single-stock vol dependent) | Moderate (index vol mean-reverts faster) |
| Distribution sustainability | Variable; ROC common | More stable; income-dominant |
| Non-US withholding tax | 30% (15% under treaty) | 30% (15% under treaty) |
During 2024 volatility spikes, DIVO drew down approximately -12% while JEPI absorbed roughly -6%. JEPI has been cited in adviser circles for delivering a steady approximately 9% yield with roughly half the volatility of concentrated alternatives. WealthManagement.com recommends a maximum 5% portfolio allocation to concentrated covered call ETFs to limit erosion risk. Community polling data from Kitco and Seeking Alpha (2024-2025) indicates approximately 65% of income investors prefer broadly diversified options for sustainability.
Premium compression represents an underappreciated forward risk. Potential rate cuts in 2025-2026 could compress option premiums by 10-15% across both categories, but concentrated funds face steeper income reductions because their yield depends on sustained single-stock volatility in AI and technology names. If that volatility normalises, the yield advantage narrows from a structural feature to a cyclical artefact.
Tax drag for non-US investors
Non-US investors holding US-listed covered call ETFs face a 30% withholding tax on distributions, reducible to 15% under applicable tax treaty rates. On a 21% gross yield, that tax drag materially compresses net income.
IRS Publication 515 withholding rules establish the statutory 30% rate applied to US-source distributions paid to non-resident aliens and foreign entities, with treaty-reduced rates available only where a qualifying bilateral agreement is in force and the recipient meets certification requirements.
UCITS-compliant alternatives available via iShares/BlackRock on EU exchanges reduce this drag, with expanded product availability following ESMA updates in mid-2025. Australian investors typically access US-listed ETFs directly or through UCITS equivalents. Canadian investors have TSX-listed covered call products from providers like BMO and Horizons covering both Canadian and US equity strategies.
How concentrated and diversified covered call ETFs actually generate income differently
Most investors understand the surface mechanic: a covered call ETF sells call options against its equity holdings and collects the premium as distributable income. The structural difference that explains the yield gap sits one layer deeper, in what type of options are being sold and against how many positions.
Three variables drive the premium divergence between concentrated and diversified funds:
- Number of holdings: Concentrated funds hold 10-40 positions; diversified funds hold 100-500, typically tracking the S&P 500 or Nasdaq-100.
- Call coverage ratio: Concentrated strategies write calls against 80-90% of their portfolio; diversified funds often cap coverage at 30-50%, preserving more upside participation.
- Option type: Concentrated funds sell single-stock options on individual holdings (often high-volatility tech names); diversified funds write calls on broad indices such as SPX or NDX.
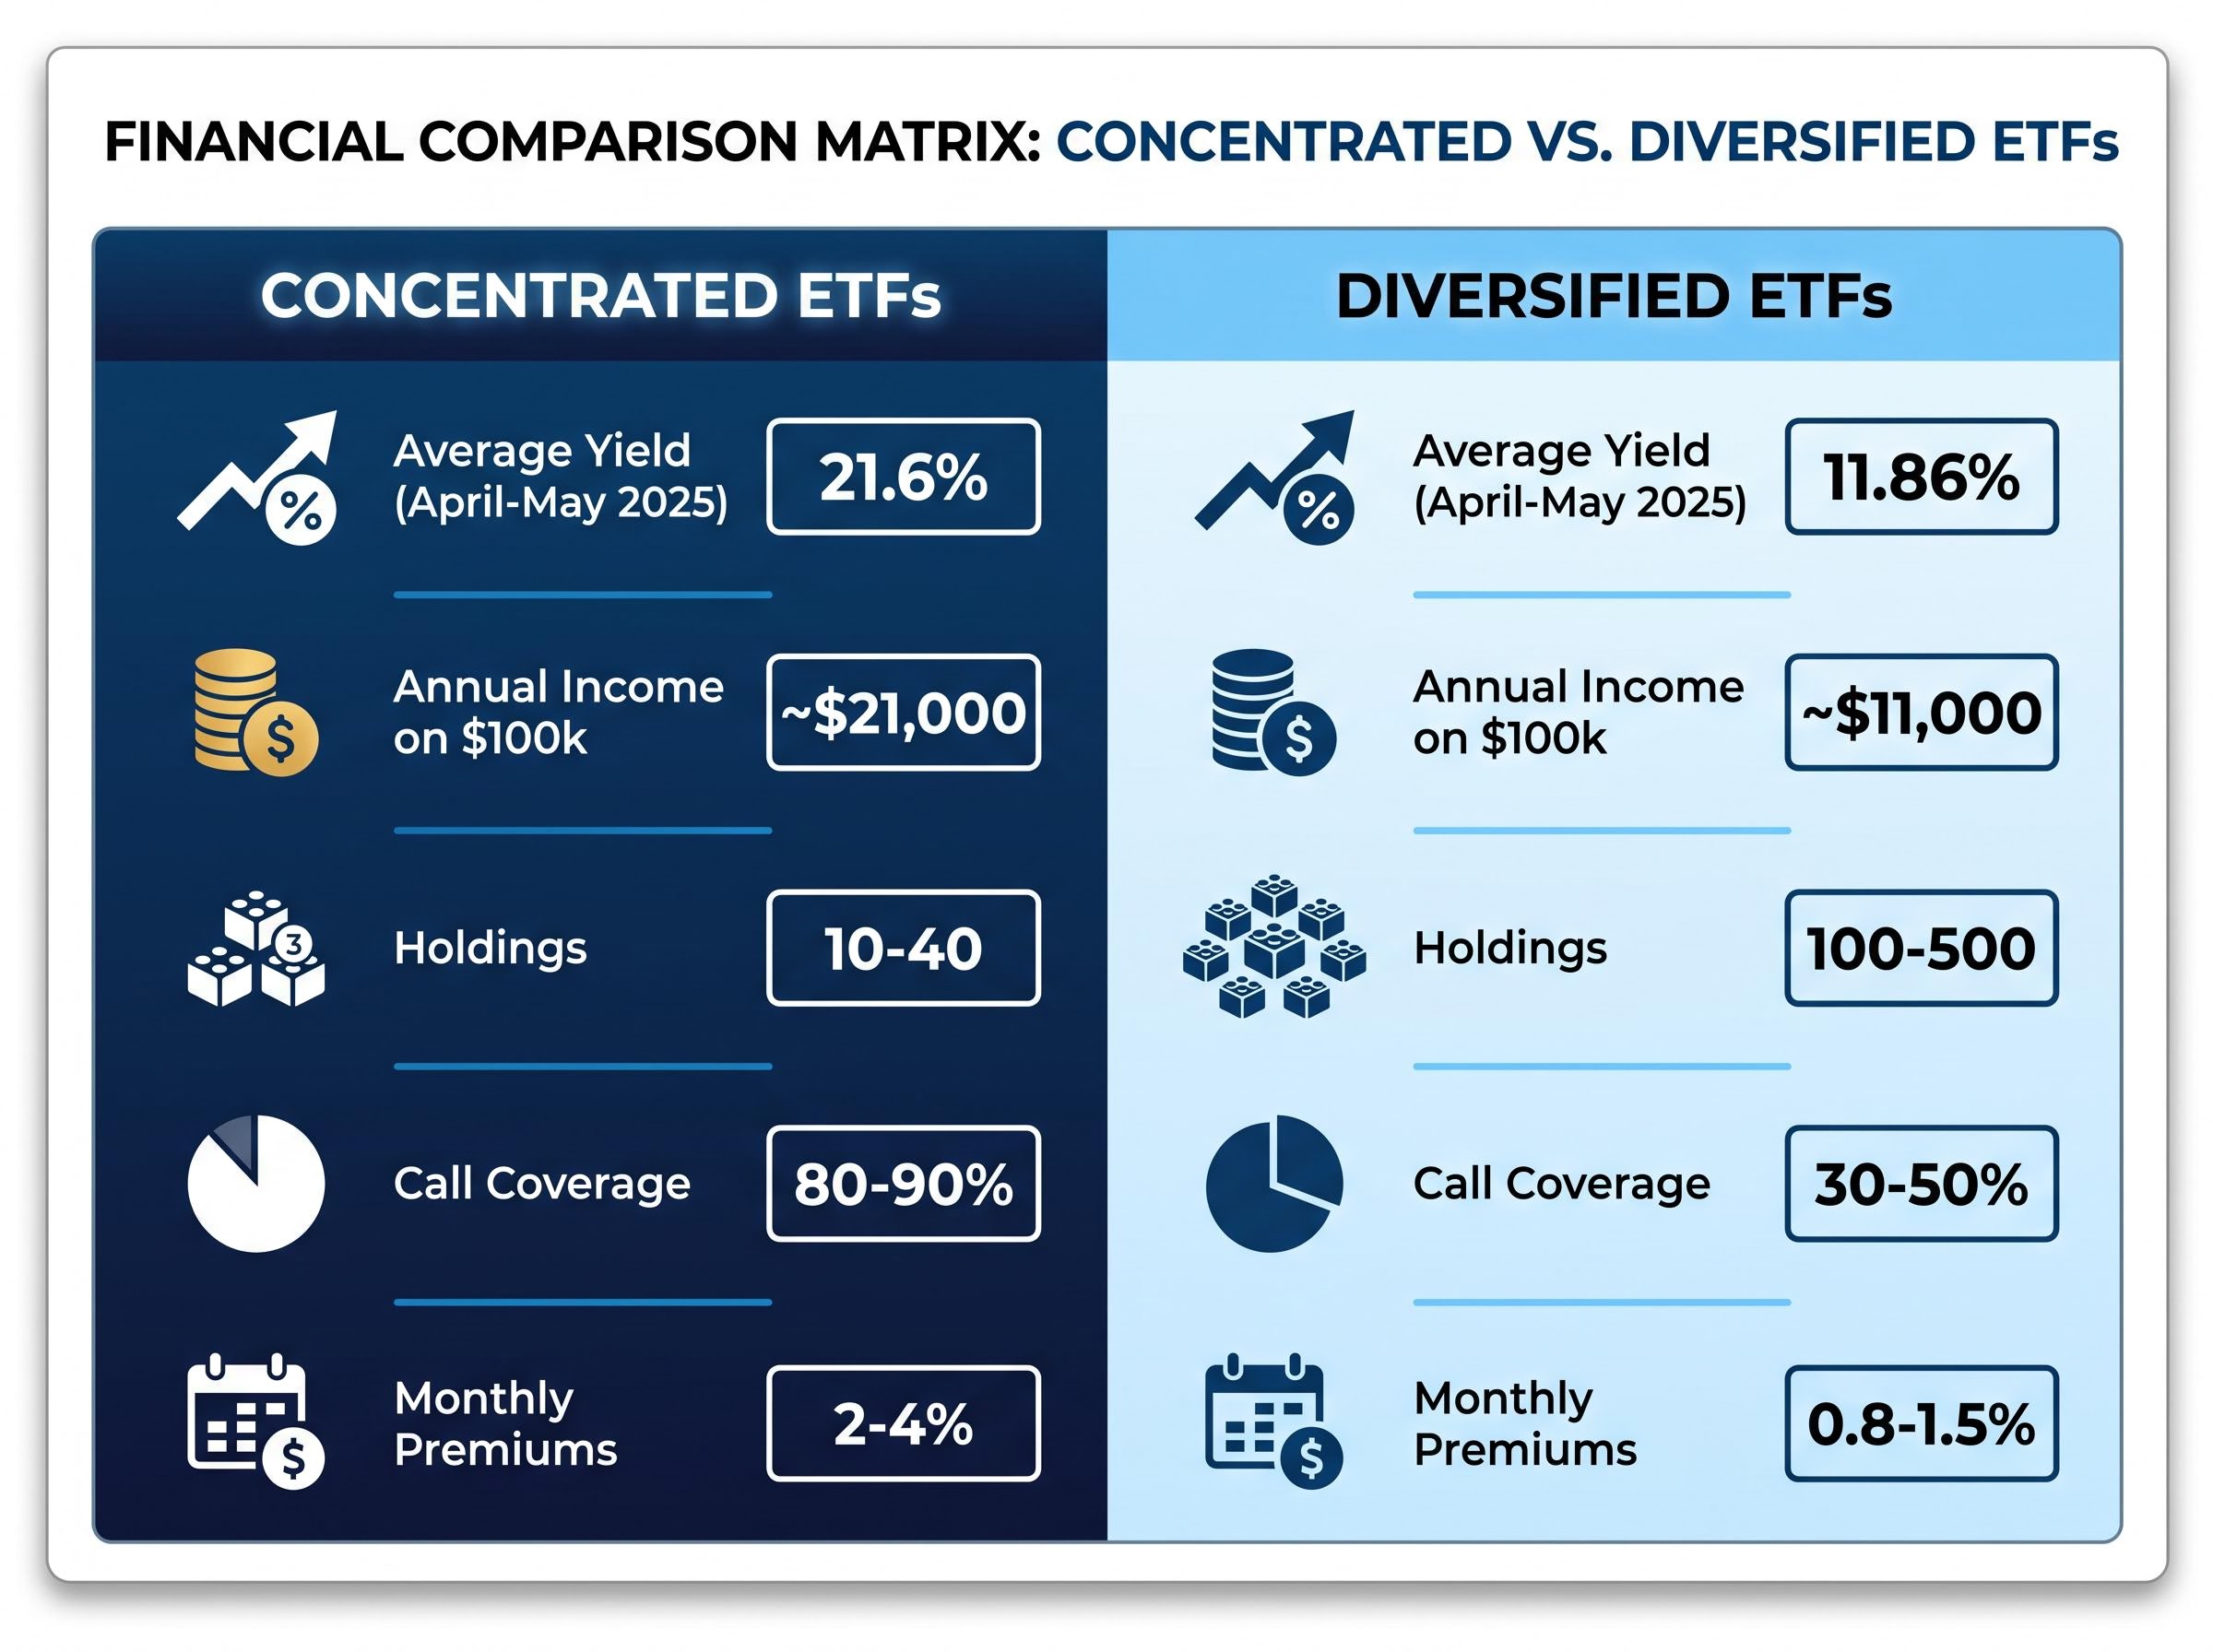
The premium difference is mechanical. Single-stock options on volatile names generate 2-4% monthly premiums. Broad index options on SPX or NDX produce 0.8-1.5% per month. Individual stock prices swing more than indices, and option buyers pay more for that volatility.
The Cboe BXM index methodology documents the buy-write strategy benchmark that underlies much of the industry’s premium measurement framework, providing the standardised basis against which both concentrated and diversified covered call fund premiums are typically evaluated.
According to CBOE data from Q1 2025, the premium gap boosted concentrated ETF yields by approximately 8-12% over broad equivalents during elevated volatility periods in 2024.
The 2024 VIX averaged approximately 15.55, and the 2025 figure rose to approximately 18.93. Both sit above the pre-2023 baseline of 12-15, meaning the single-stock premium advantage has been unusually wide. The yield gap is mechanically real, not manufactured. The question is whether it compensates for the structural risks that follow.
Beyond yield: total return as the ultimate performance metric
The concentrated funds’ yield advantage narrows sharply when the lens shifts from distribution income to total return.
Year-to-date figures through April 2025 reveal the structural tension. Concentrated funds delivered approximately 8.55% total return (income plus price change combined) versus approximately 7.76% for diversified equivalents. The outperformance is less than one percentage point, despite the concentrated group distributing roughly double the income.
The composition of that return exposes the trade-off:
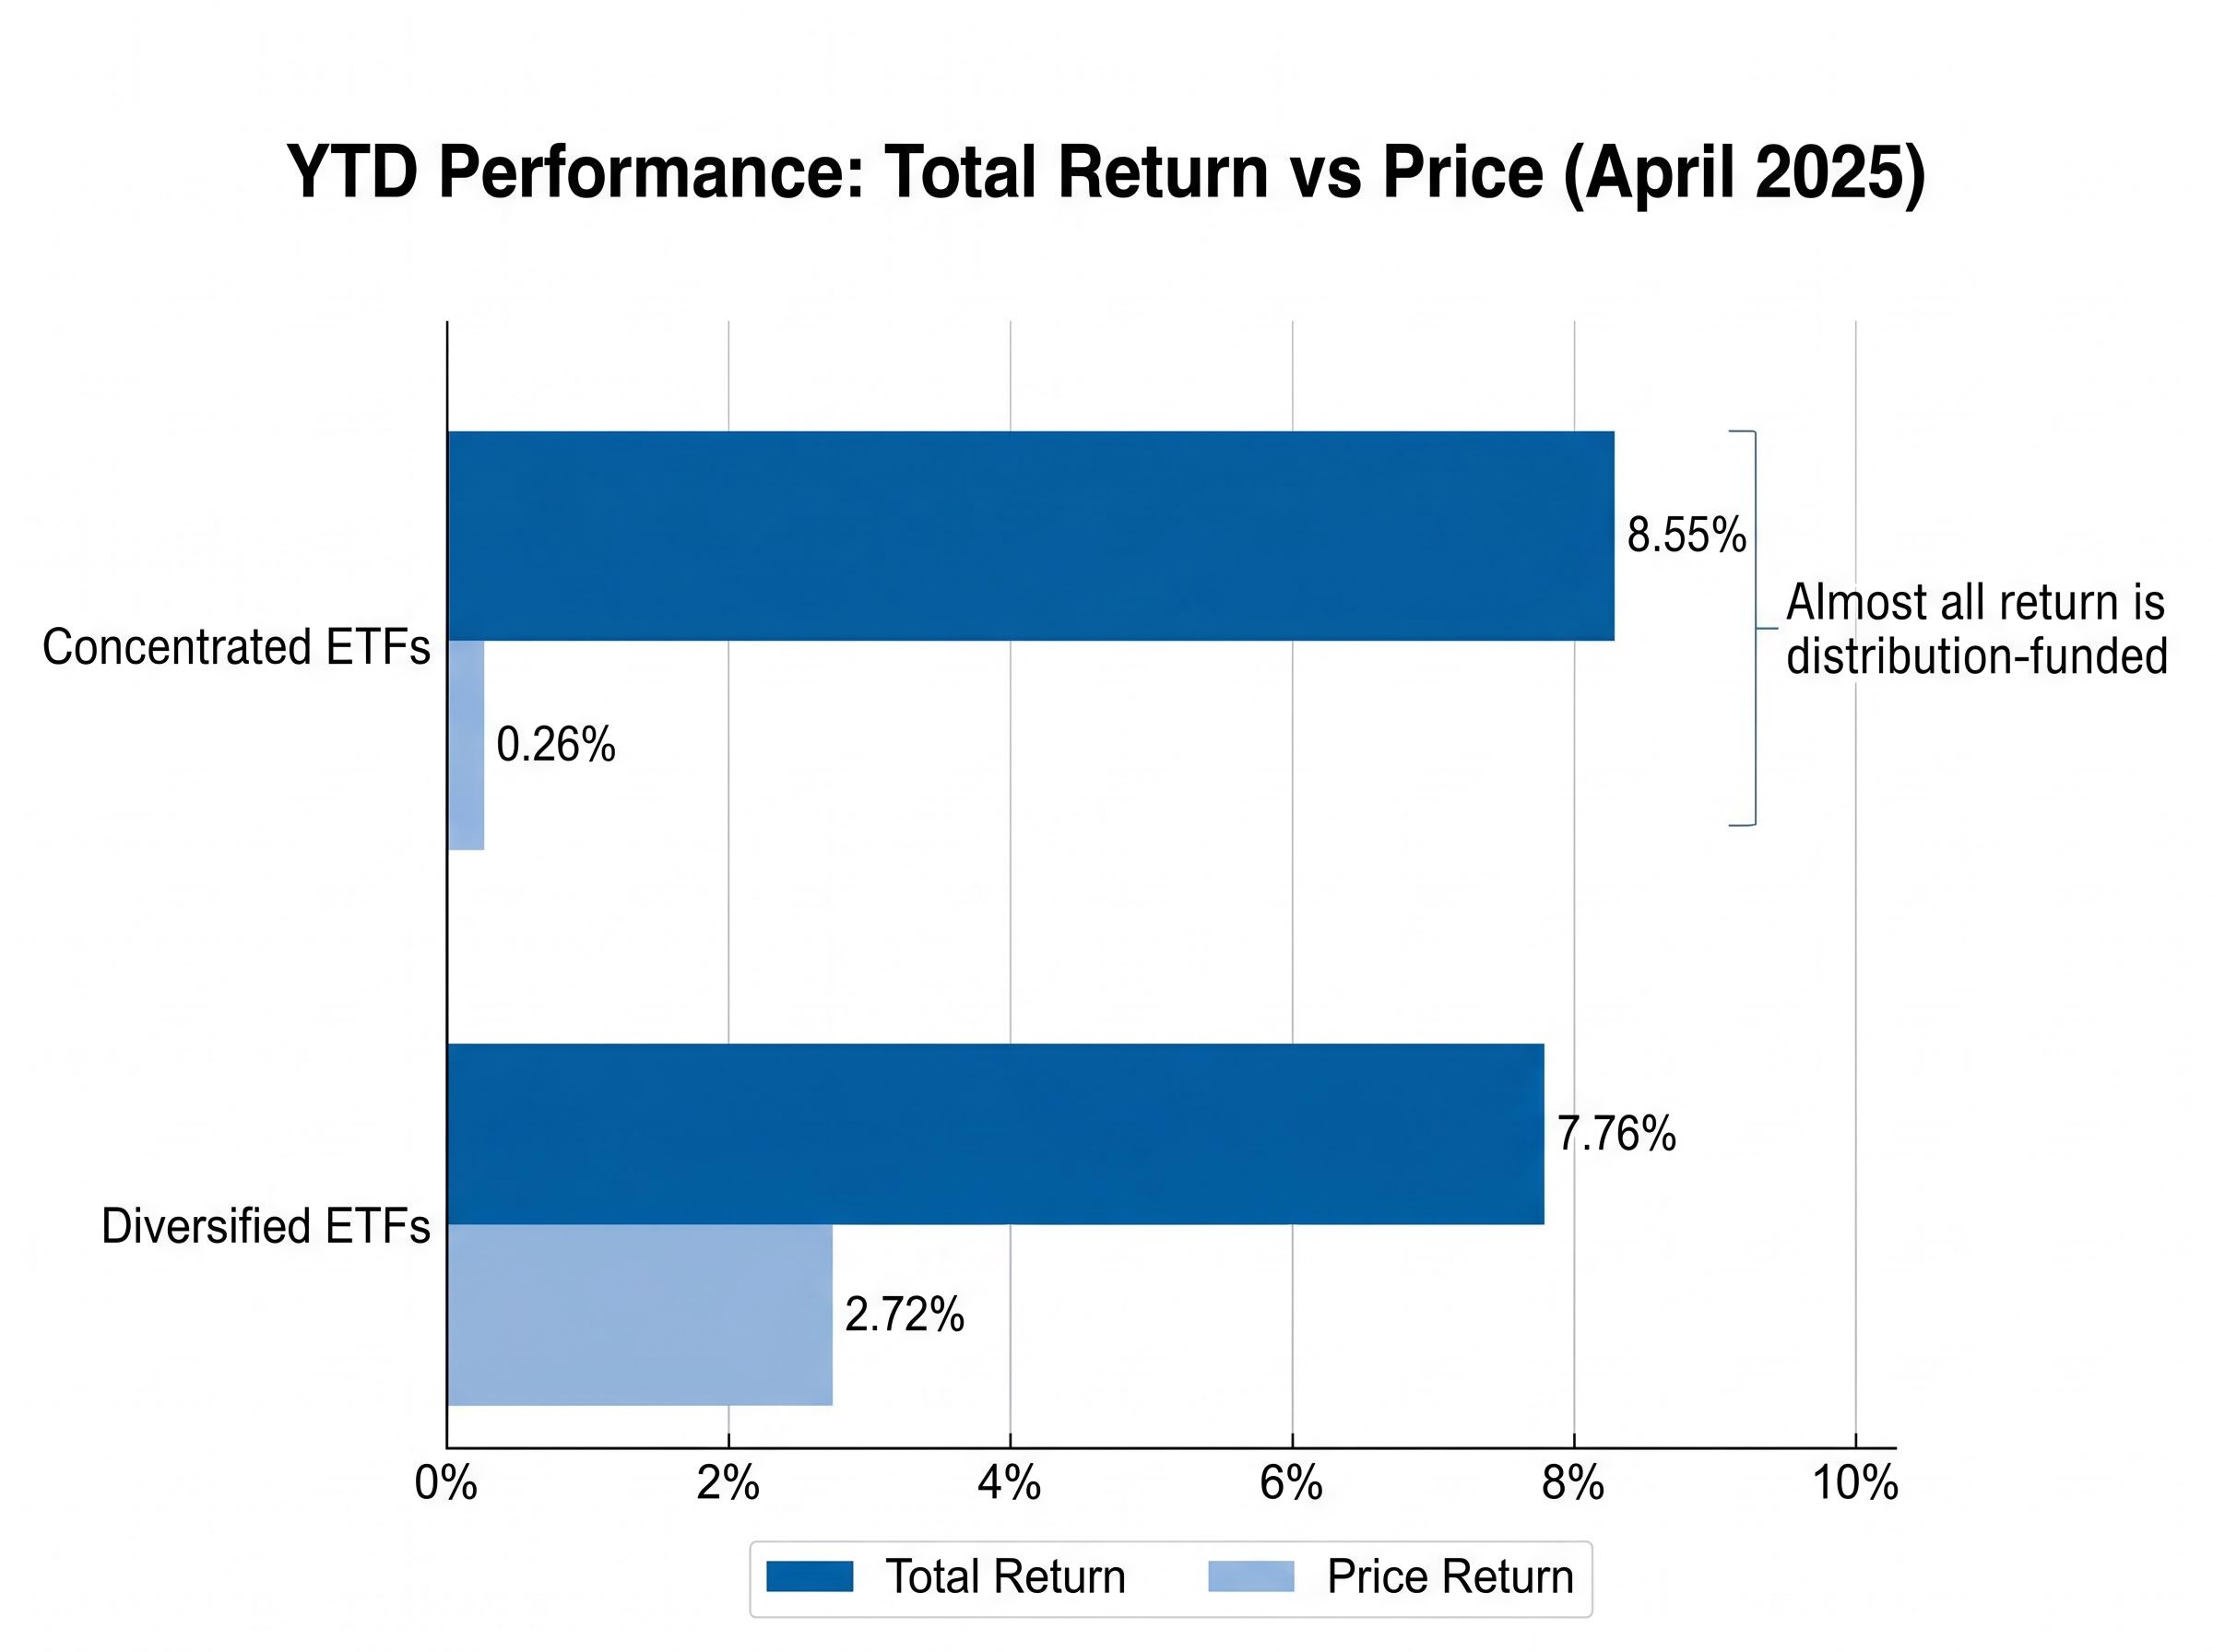
- High call coverage caps upside participation. Concentrated funds writing calls against 80-90% of holdings forfeit most price appreciation when underlying stocks rise. Year-to-date price performance (excluding distributions) for the concentrated group averaged approximately 0.26%.
- Bull market gains flow to option buyers, not ETF holders. When a stock rallies through the strike price, the call buyer captures the upside. The ETF retains only the premium collected.
- Distributions fill the gap but draw partly from NAV. The concentrated group’s total return is almost entirely distribution-funded, meaning investors are largely receiving their own capital back in a different form during rising markets. Diversified funds posted approximately 2.72% in price-only performance over the same period, preserving more of the equity appreciation.
Morningstar’s Q1 2025 assessment confirmed this pattern, finding that concentrated covered call ETFs underperformed total return benchmarks during 2024 bull conditions. XYLD experienced NAV decline of approximately 5-7% during the 2023-2024 bull period; JEPI saw approximately 3-4% over the same window.
“Concentrated covered calls deliver yield porn but NAV decay in bulls; index-proxies trade 10% yield for longevity.” (Dividendology, February 2025)
For investors who plan to spend distributions rather than reinvest them, the distinction matters. A high yield that erodes the principal base is a structural headwind, not a bonus.
Building a covered call portfolio that uses both strategies intentionally
The analysis above does not declare a winner. It maps a structural complement. Diversified funds and concentrated funds serve different portfolio functions, and the informed approach sizes each deliberately rather than choosing one category in isolation.
Diversified funds (JEPI, JEPQ, XYLD) function as the stable income core. JEPI has not cut distributions in more than five years of operation. NAV stability in these funds supports organic distribution growth over time if underlying equity prices appreciate, a feature that matters most to investors spending distributions rather than reinvesting them. ELN-based structures (JEPI, JEPQ) offer the most tax-efficient delivery for US investors.
The ELN versus FLEX options distinction sits beneath the yield comparisons that screeners surface, and it carries a larger impact on after-tax returns for US taxable-account investors than the 1-2 percentage point yield differences between individual funds; ELN-based structures like JEPI generate predominantly ordinary income taxed at marginal rates, while FLEX options funds can classify distributions as return of capital and defer the tax liability until sale.
Concentrated funds serve as tactical satellites. Consistent with the 5% maximum allocation guidance from WealthManagement.com, a modest position captures the higher premium environment without dominating the portfolio’s risk profile. Concentrated funds have limited capacity for distribution growth because their high coverage ratios prevent the NAV appreciation that supports organic income increases over time.
Investors exploring what lies beyond the concentrated versus diversified binary will find our deep-dive into leveraged covered call ETFs, which examines how combining 1.25x equity exposure with a call-writing overlay produces a portfolio delta of approximately 0.92, the performance record of USCL.TO over 20 months of live trading, and the borrowing cost spread that determines whether the leverage amplifies returns or compounds losses across a full market cycle.
Three portfolio construction principles anchor the framework:
- Core/satellite sizing: Allocate the majority of covered call exposure to diversified funds; cap concentrated positions at 5% of total portfolio value.
- Rebalancing trigger: Monitor the yield gap between concentrated and diversified funds. When the gap compresses (signalling falling single-stock volatility), reduce concentrated exposure, as the risk premium no longer compensates for the structural drawbacks.
- Spending versus reinvesting: Investors drawing income for living expenses should weight diversified funds more heavily for NAV stability. Investors reinvesting distributions can tolerate a modestly higher concentrated allocation because NAV erosion matters less when distributions are recycled.
When to favour concentrated over diversified
Concentrated covered call ETFs perform best under specific conditions: range-bound or sideways markets where limited upside participation costs less, elevated single-stock volatility in held sectors that inflates premium income, and shorter distribution-spending horizons where long-term NAV erosion has less time to compound.
Sustained bull markets systematically disadvantage concentrated strategies. Upside is capped, NAV erodes without equity appreciation to offset it, and diversified funds capture more of the rally through lower coverage ratios and out-of-the-money call positioning.
The yield gap is real, but so is the cost of chasing it
Concentrated covered call ETFs generate roughly double the distribution yield of their diversified equivalents. The mechanism is genuine: single-stock option premiums are structurally higher than index premiums, and the 2025-2026 volatility environment has amplified the gap. The cost is equally real: lower price appreciation, higher drawdown exposure, and return of capital risk that can silently erode the asset base over time.
Concentrated funds have a legitimate role as income amplifiers within a structured allocation capped at modest weightings. Broadly diversified strategies carry the stronger risk-adjusted case for investors prioritising long-term sustainability, particularly those spending distributions.
The current environment has been unusually generous to concentrated premiums. Investors should monitor VIX trends and rate cut signals as leading indicators of whether the yield gap will compress. A falling VIX does not eliminate the concentrated category, but it narrows the compensation for bearing its structural risks.
Investors should review the current TTM yield, NAV trajectory, and ROC proportion of any covered call ETF they hold or are evaluating, using provider factsheets updated quarterly rather than relying on screener headline yields alone.
This article is for informational purposes only and should not be considered financial advice. Investors should conduct their own research and consult with financial professionals before making investment decisions. Past performance does not guarantee future results. Financial projections are subject to market conditions and various risk factors.