Woolworths: Strong Sales, Shrinking Profits, Slim Upside
11 mins ago
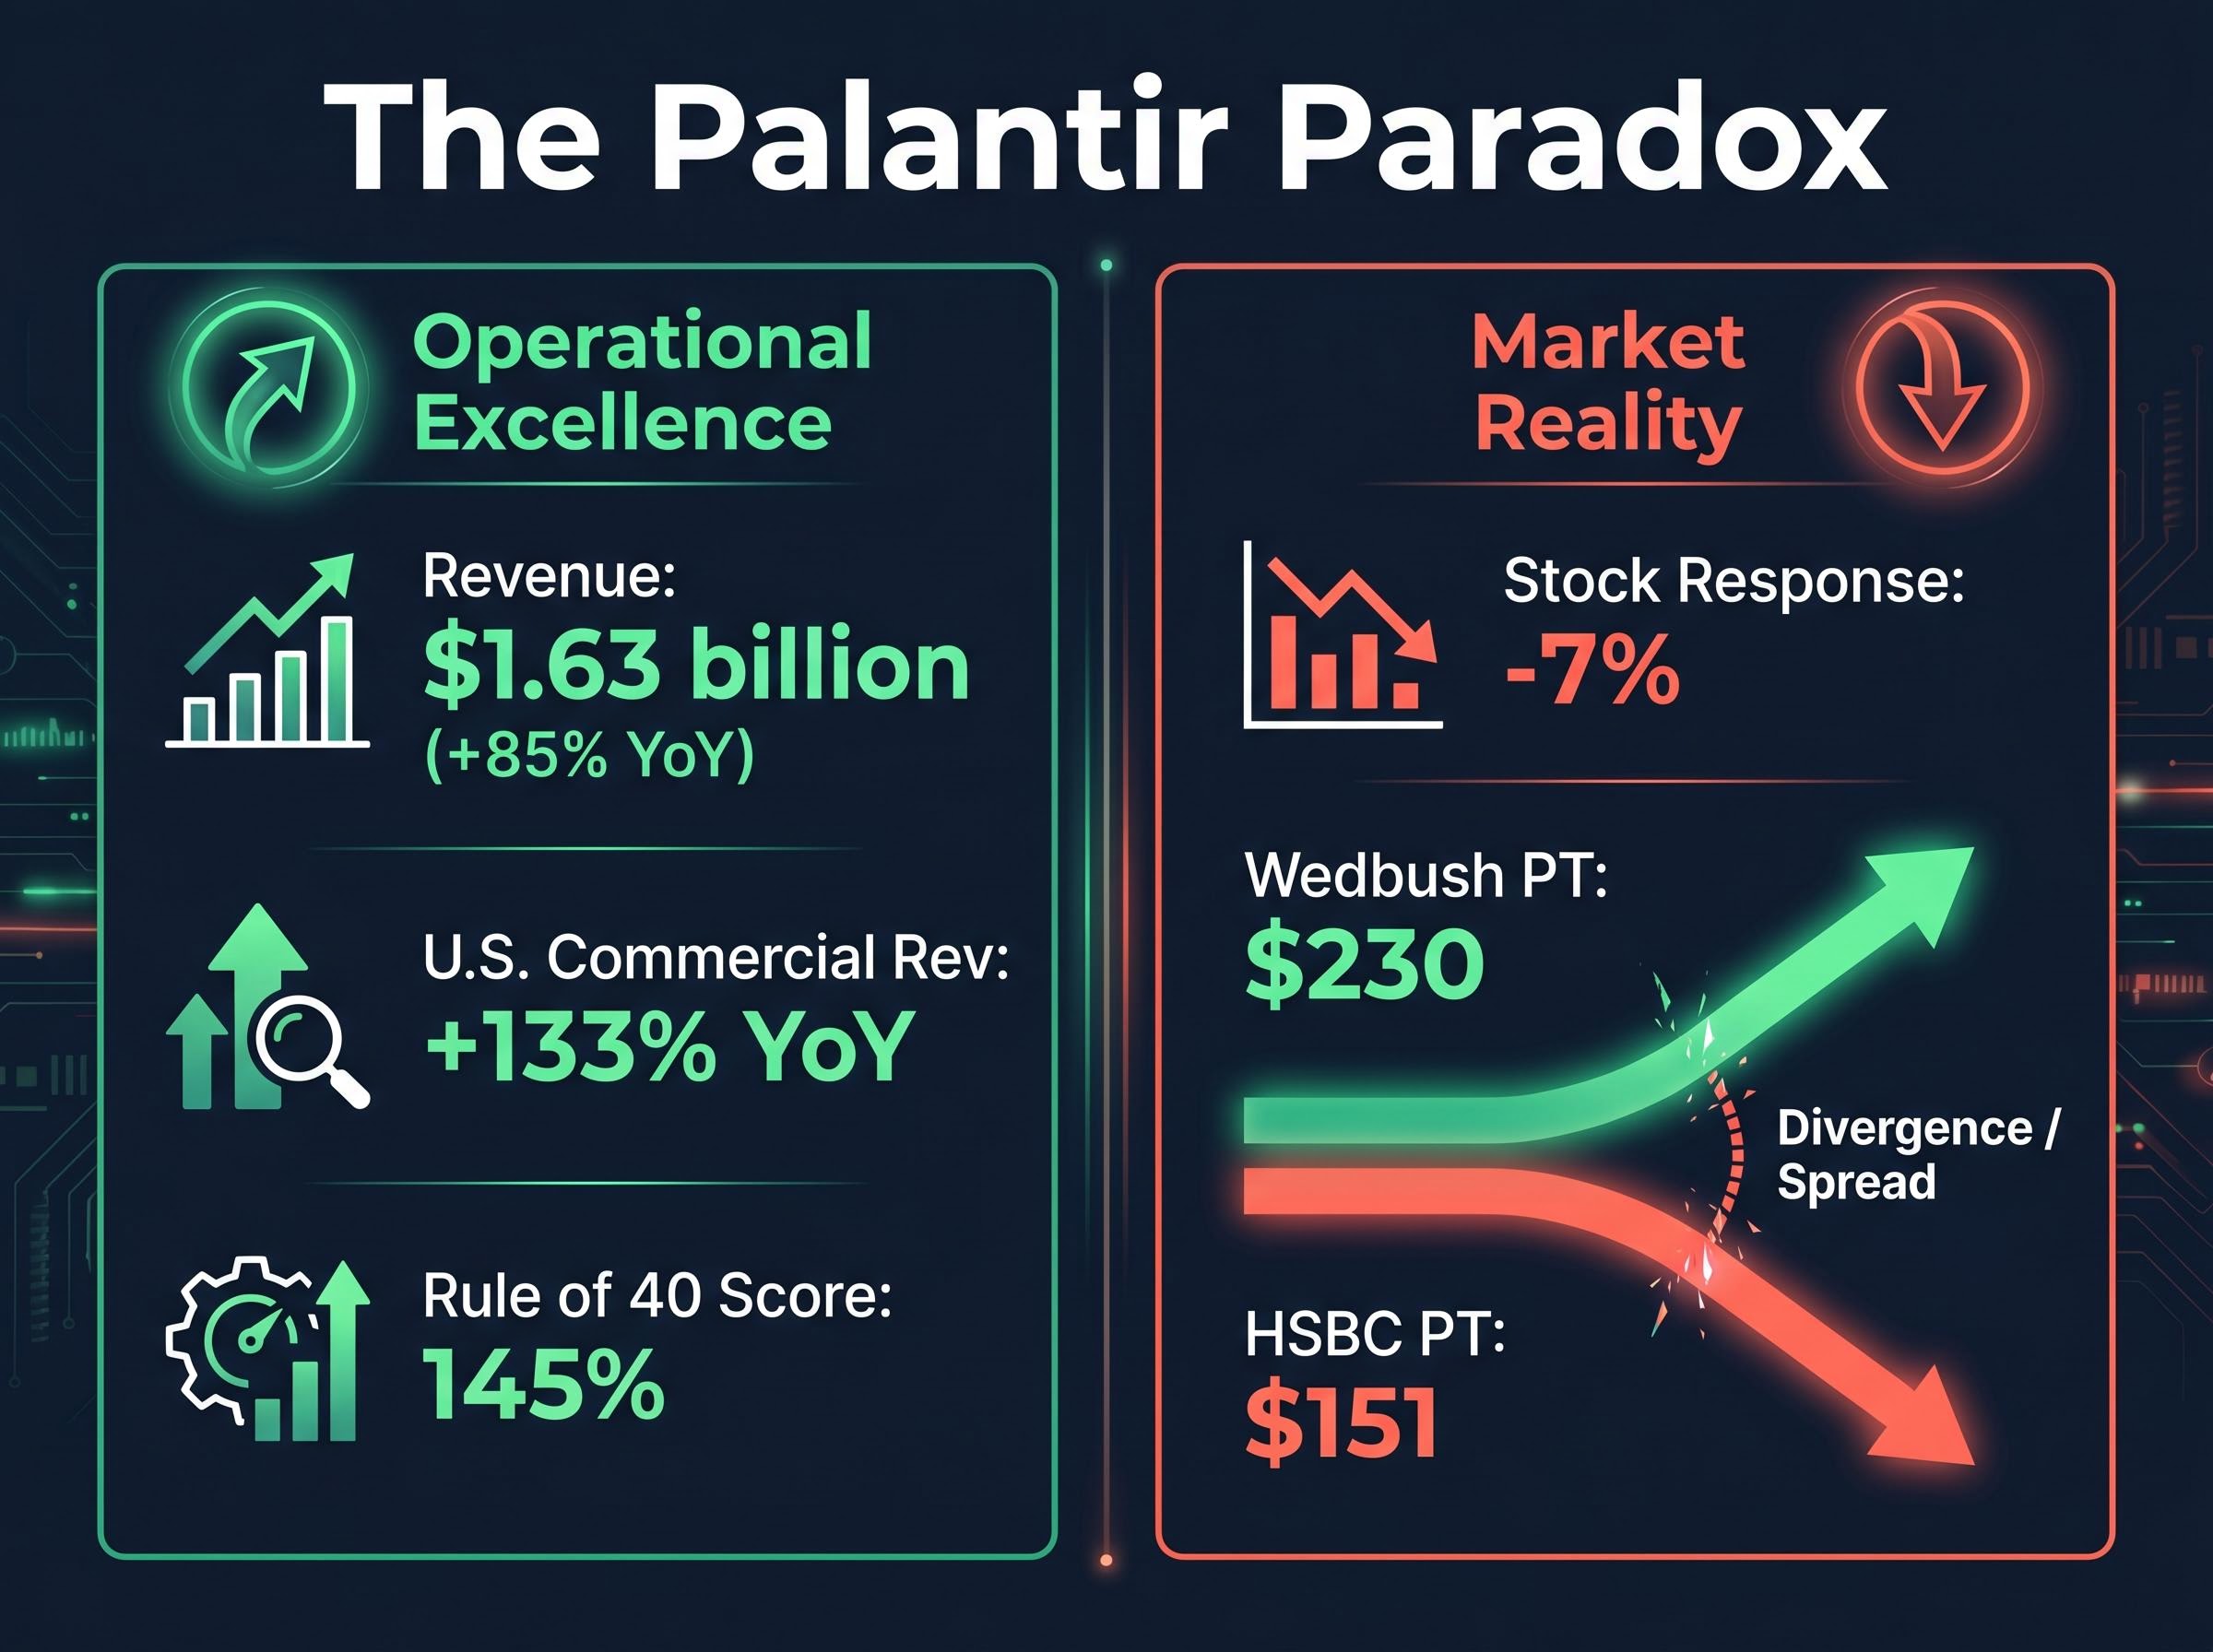
Palantir just posted 85% revenue growth, a 53% net margin, and raised its full-year guidance well above Wall Street’s expectations. Its stock fell 7%.
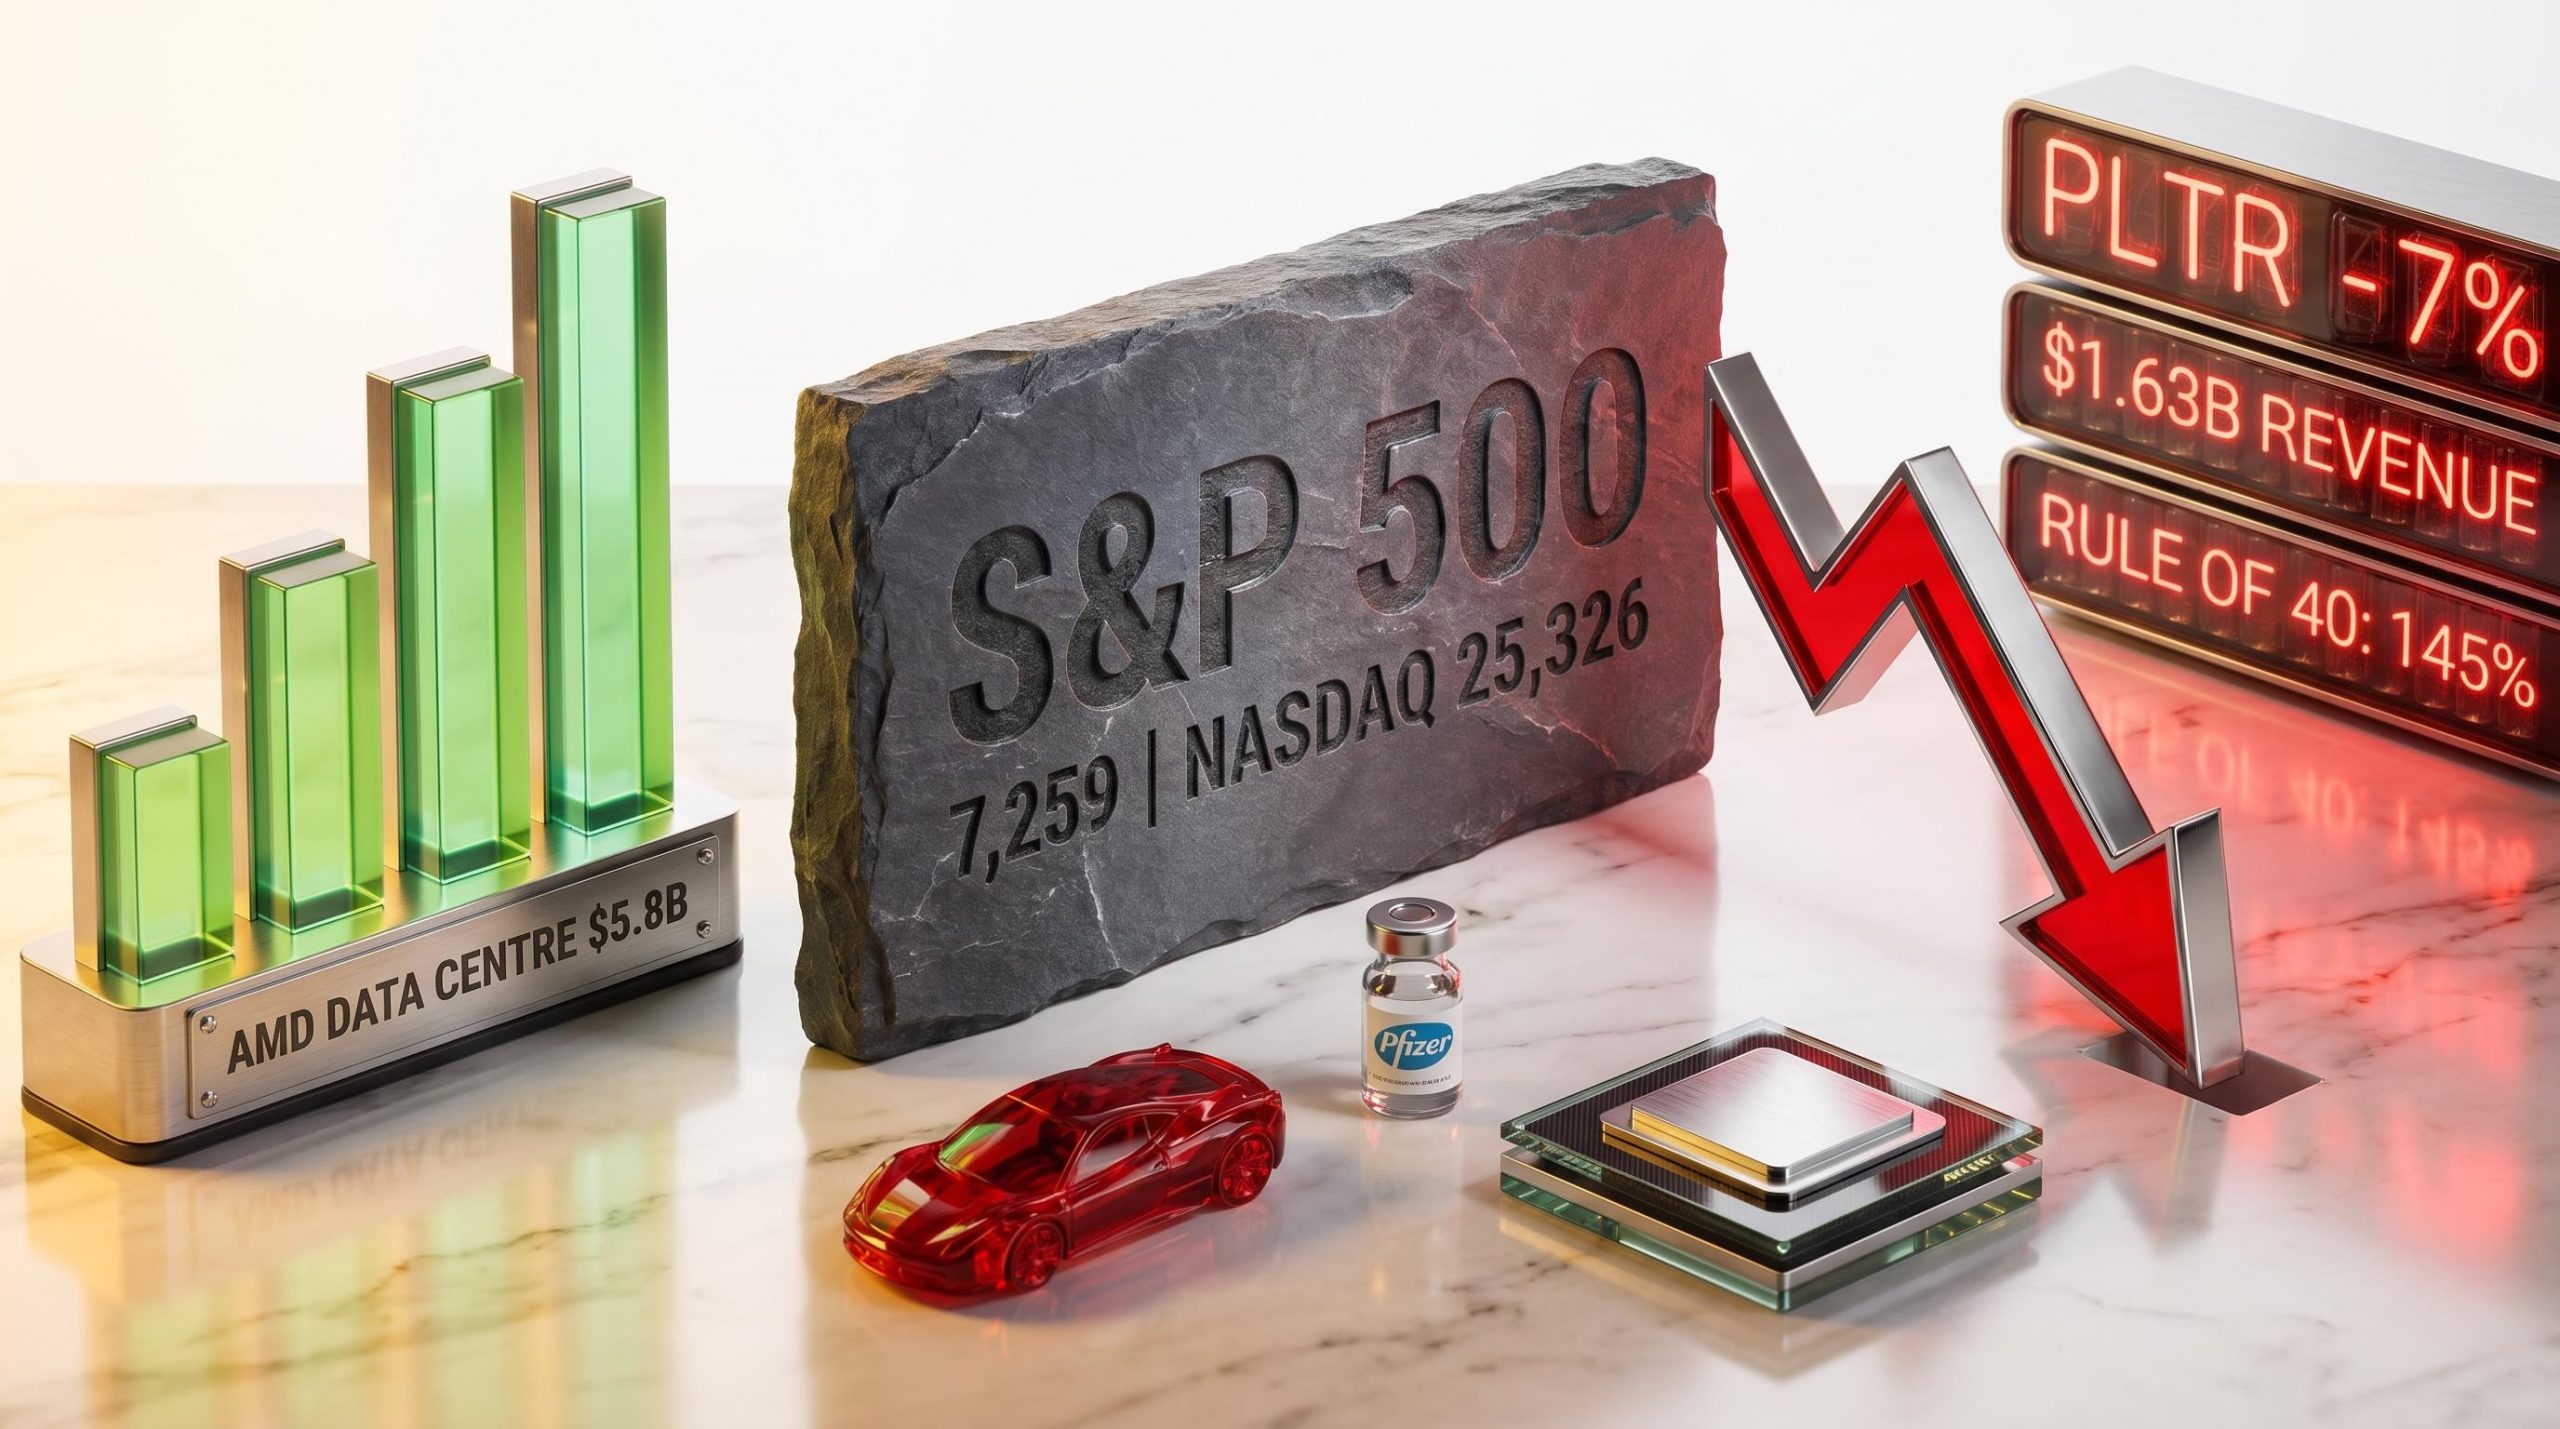
On the morning of 6 May 2026, four major companies reported Q1 2026 earnings in a single session, producing one of the starkest illustrations in recent memory of how differently markets reward strong numbers depending on context. Palantir, AMD, Pfizer, and Ferrari delivered results across AI software, semiconductors, pharmaceuticals, and luxury automobiles, while the S&P 500 sat at 7,259 and the Nasdaq touched a fresh all-time high of 25,326.
What follows is a corporate earnings analysis of what each company’s results actually mean for investors, with particular focus on the question the Palantir result raises: when can you trust an earnings beat, and when does the market’s reaction tell you something the headline number does not?
AMD reported Q1 2026 results that the market received constructively, and the distinction from Palantir is instructive. The numbers were strong, but they landed at a point where the valuation narrative and the growth story were still moving in the same direction.
Data centre revenue of $5.8 billion in a single quarter underscores how rapidly enterprise AI adoption has moved from pilot to production.
DA Davidson upgraded AMD from Neutral to Buy with a $375 price target, a concrete signal that the market sees the current valuation as growth-justified rather than growth-saturated. RBC Capital maintained a Hold at $325. Segment-level detail beyond the data centre division and data centre gross margin specifics were not confirmed at publication, but the top-line picture is clear: AI infrastructure spending remained strong through Q1, and AMD’s position in that spend is expanding. The stock’s positive reception reflects a growth story the market believes still has room to compound into its multiple.
By any conventional measure, Palantir’s Q1 2026 was exceptional. Consider the headline metrics:
Rule of 40 score: 145%. A score above 40 is considered excellent for software companies. Palantir’s score of 145, combining revenue growth and profitability, is extraordinary by any sector benchmark.
Rule of 40 research on SaaS stock selection covering more than 1,700 companies over a 20-year period found that the metric adds genuine value as a screening tool and produces a moderately high Sharpe ratio, lending academic weight to the argument that Palantir’s score of 145 represents a meaningful operational signal rather than a marketing construct.
| Metric | Q1 Result | Consensus |
|---|---|---|
| Revenue | $1.63 billion | ~$1.54 billion |
| Adjusted EPS | $0.33 | $0.28 |
| Adjusted Operating Margin | 60% | N/A |
The numbers should have sent the stock higher. They did not.
Palantir shares dropped approximately 7% after the release, with an intraday low near $138.39. The sell-off reflects a valuation regime where exceptional execution is already embedded in the price. At elevated multiples, even substantial beats are insufficient unless raised guidance dramatically exceeds what forward estimates already assume.
The analyst community is split. Wedbush’s Dan Ives maintained an Outperform rating with a $230 price target. HSBC downgraded the stock from Buy to Hold at $151. The street average sits at $180.68, but the spread between bull and bear cases illustrates how contested the valuation ceiling has become. The specific P/E and price-to-sales multiples cited as triggers for the sell-off remain unconfirmed at time of publication; what is confirmed is that the market treated a quarter of near-flawless execution as insufficient. That is not irrational. It is a coherent signal about where the stock sits in its valuation cycle.
Meta’s post-earnings selloff earlier in the same reporting season produced an almost identical dynamic: record revenue growth of 33%, a 41% operating margin, and a stock that fell roughly 9% because a revised capex trajectory changed the market’s forward cash flow calculation rather than any deterioration in the underlying business.
The Palantir and AMD results, taken together, illustrate a principle that separates experienced investors from headline-chasers: the market is a forward-looking discounting mechanism. A stock price reflects what investors already expect, not what just happened. An earnings beat only moves the stock if it changes the forward expectation.
Three conditions determine whether a strong beat translates into price appreciation:
Guidance-driven stock moves of 8-15% on a single session earlier in this earnings season confirmed the same pattern at smaller-cap names: Spotify fell 12-14% despite beating current-quarter estimates because its forward guidance disappointed, while Centene surged 8.90% on a raised full-year EPS outlook that moved ahead of consensus targets.
Palantir’s Rule of 40 score of 145% and adjusted free cash flow of $925 million (a 57% margin) confirm a business operating at an elite level. Total contract value closed reached $2.41 billion, up 61% year-on-year. U.S. commercial remaining deal value hit $4.92 billion, up 112% YoY.
By every operational metric, this is an exceptional software company. The question is not whether the business is strong. It is whether the stock price already reflects that strength.
When analysts describe a stock as “priced for perfection,” they mean the current share price assumes every future growth scenario plays out optimally. There is no margin for even minor disappointment. This dynamic is not unique to Palantir; it has historically appeared across high-multiple growth stocks at cycle peaks, from cloud software names in 2021 to social media platforms in 2014. Recognising it in real time is what distinguishes a practitioner from a spectator.
Investors wanting to situate this dynamic within the broader market cycle will find our dedicated guide to US equity valuation signals, which examines the Buffett Indicator at 223.6%, the equity earnings yield versus Treasury yield spread, and the practical portfolio positioning steps that follow from each framework.
After two high-intensity AI growth stories, Pfizer and Ferrari sent a different signal: management credibility and guidance reliability carry their own premium, particularly in a market where forward visibility is limited.
Pfizer key data:
Ferrari key data:
| Metric | Pfizer | Ferrari |
|---|---|---|
| Revenue | $14.45B (+5% YoY) | €1.848B (+6% constant currency) |
| EPS vs. Consensus | $0.75 (beat by $0.03) | €2.33 (above consensus) |
| Guidance Status | Reaffirmed | Confirmed/unchanged |
| Post-Earnings Share Move | Modest | Down ~3.5% |
Ferrari’s falling deliveries alongside unchanged guidance may appear contradictory, but for a business with Ferrari’s pricing power and order book depth, a model-transition delivery dip is a known variable rather than a demand signal. Both companies provided exactly the certainty the market wanted: steady execution, reaffirmed targets, no negative surprises. Detailed product-level and geographic breakdowns for both companies were unconfirmed at publication. The street median 12-month price target for Pfizer sits at $27; Ferrari consensus holds a Buy rating at EUR 350.
Pulling up from company-level detail, the four results triangulate two dominant themes running across this earnings session.
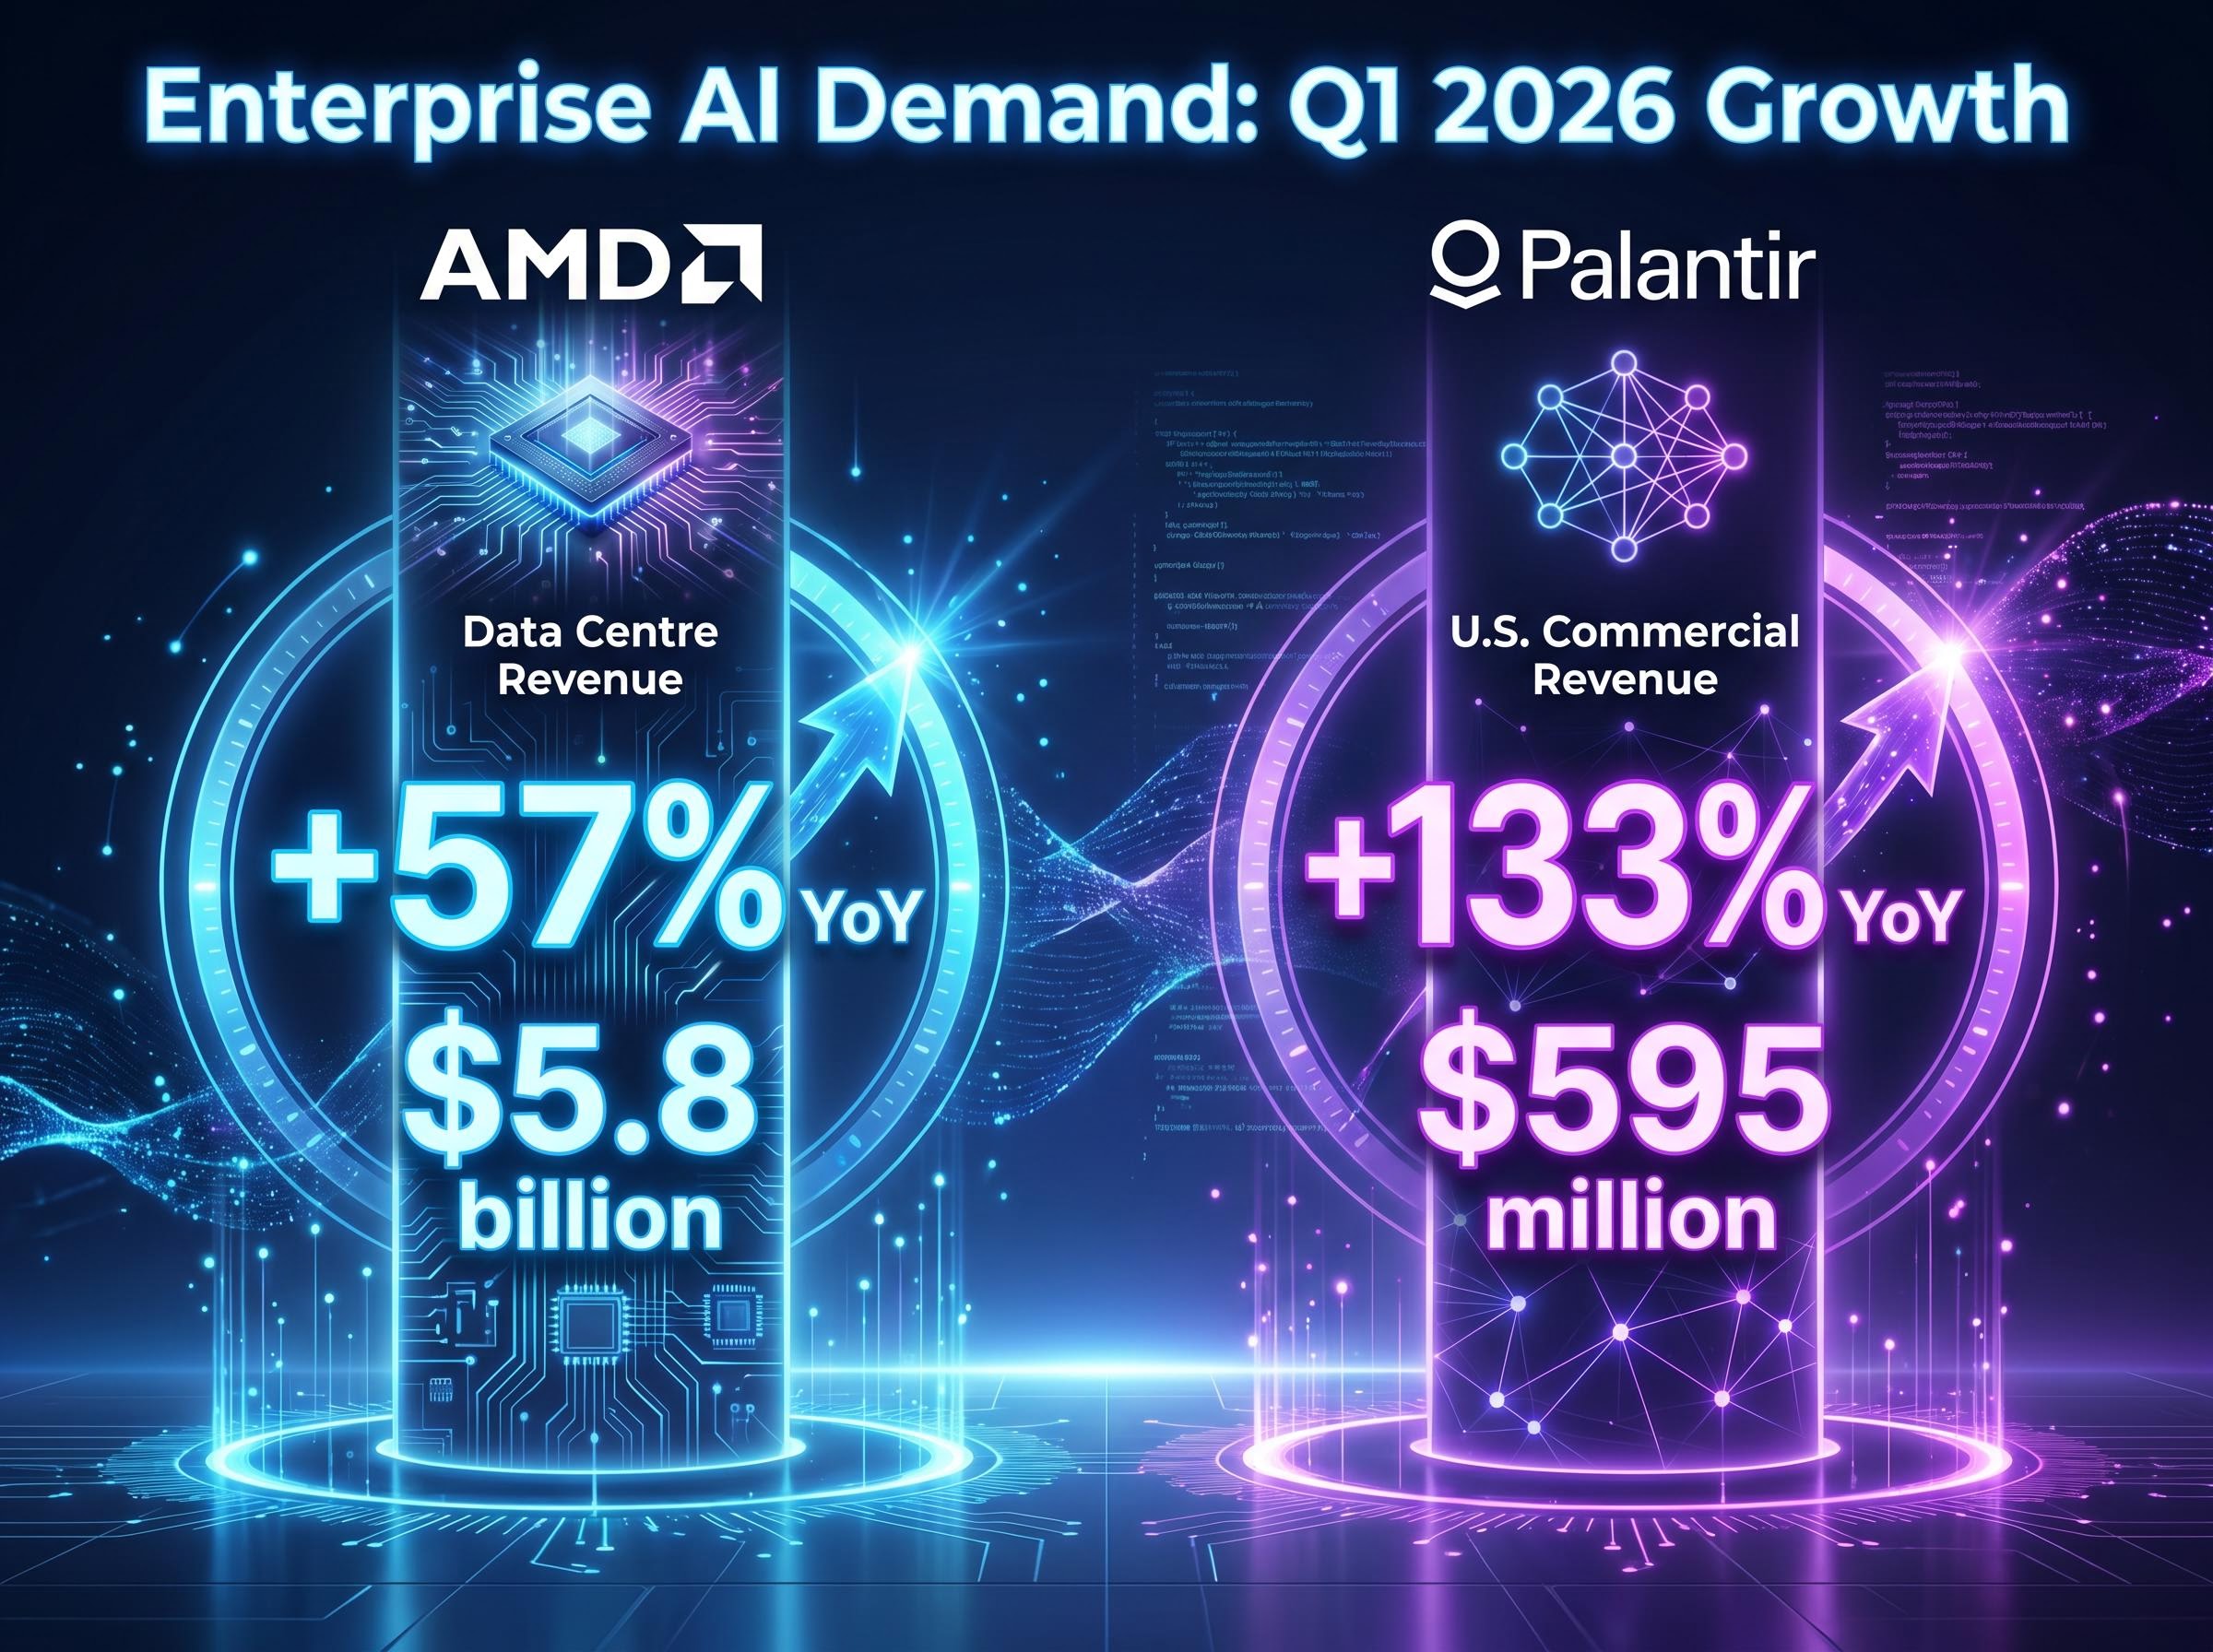
First, AI infrastructure demand is real and accelerating. Palantir’s 133% U.S. commercial revenue growth and AMD’s 57% data centre surge confirm that enterprise and hyperscaler investment continued through Q1. Semiconductor ETFs rose 4.47% over the three sessions to 6 May; cloud computing ETFs gained 4.56% over the same period.
The broader Q1 2026 earnings season has delivered a blended S&P 500 growth rate of 27.1%, nearly double pre-season analyst forecasts, with 84% of reporting companies beating EPS estimates and an aggregate earnings surprise running at almost three times the five-year average, suggesting that conservative analyst positioning entering the quarter amplified the apparent scale of beats across the index.
Second, the market is increasingly discriminating on valuation. It rewarded AMD’s growth, which appeared underpriced relative to its multiple. It sold Palantir’s growth, which appeared fully reflected in the share price. Execution quality alone no longer guarantees appreciation.
The macro backdrop adds complexity:
The steepest drop in new orders in three years, even as the headline PMI remains in expansion territory, is the kind of leading indicator that earnings beats can temporarily mask.
Investor risk appetite is elevated even as valuation sensitivity rises, a combination that historically narrows the margin for error in individual stock selection.
The session’s results distil into a three-part framework for interpreting any earnings release:
Wedbush: $230. HSBC: $151. The $79 spread between these two Palantir price targets on the same set of results illustrates that even professionals operating with full information cannot agree on where the valuation ceiling sits.
The divergence between Palantir’s operational excellence and its stock reaction is not a market anomaly. It is a signal about where the company sits in its valuation cycle. With Q2 2026 guidance from Palantir at $1.797-$1.801 billion and AMD guiding to $11.2 billion in revenue (with a projected non-GAAP gross margin of 56%), the market will reassess both companies against these targets in approximately 90 days. Palantir’s total contract value of $2.41 billion in Q1, up 61% year-on-year, suggests the revenue pipeline remains strong. Whether the stock rewards that pipeline depends entirely on whether the current multiple has already consumed the upside.
Across four major companies in four distinct sectors, Q1 2026 earnings largely confirmed corporate health. Revenue grew, margins held or expanded, and guidance was reaffirmed or raised. Yet the market’s selective reactions reveal that execution quality alone no longer guarantees price appreciation. The goalposts have shifted.
The forward-looking question this session has raised is specific: as Q2 2026 guidance targets become the new benchmark, which companies have set a bar they can clear, and which have set a bar that already reflects the most optimistic outcome?
Investors may find it useful to examine their own holdings through the valuation-context lens this analysis has introduced. The next round of answers arrives in approximately 90 days, when Q2 results begin landing.
This article is for informational purposes only and should not be considered financial advice. Investors should conduct their own research and consult with financial professionals before making investment decisions. Past performance does not guarantee future results. Financial projections are subject to market conditions and various risk factors.
—
The Rule of 40 is a performance benchmark for software companies calculated by adding revenue growth rate and profit margin; a score above 40 is considered excellent. Palantir posted a Rule of 40 score of 145% in Q1 2026, combining 85% revenue growth with a 53% net margin, which academic research covering over 1,700 companies identifies as a meaningful operational signal.
Palantir shares dropped approximately 7% despite reporting 85% revenue growth and a 53% net margin because the stock was trading at a valuation that already embedded exceptional growth expectations, meaning even a strong beat was insufficient to move the price higher without dramatically exceeding what forward estimates had already modelled.
Experienced investors focus on three factors: whether the results exceed what was already priced into the multiple, whether guidance shifts the forward earnings trajectory meaningfully beyond what the market had modelled, and whether the current valuation still offers room for further multiple expansion.
AMD reported Q1 2026 revenue of $10.25 billion (approximately 4% above consensus) with data centre revenue of $5.8 billion, up 57% year-on-year, and non-GAAP EPS of $1.37, roughly 10% above expectations; the market received the results constructively, with DA Davidson upgrading the stock to Buy with a $375 price target.
A stock priced for perfection is one whose current share price assumes every future growth scenario plays out optimally, leaving no margin for even minor disappointment; this dynamic has historically appeared across high-multiple growth stocks at cycle peaks and is why Palantir's near-flawless quarter still produced a sell-off.