Australia’s central bank raised rates on 5 May 2026 while the Federal Reserve, the Bank of England, and the European Central Bank all held steady. That divergence is visible in a single line on a chart, and reading it correctly matters more than tracking any individual rate decision. The yield curve, one of the oldest forward-looking tools in economics, is flattening in Australia right now, and most retail investors either ignore it or misread what it signals. The RBA’s third consecutive hike, bringing the cash rate to 4.35%, has produced a compression in the spread between short-term and long-term bond yields that is worth understanding in real time. By the end of this article, the reader will know how to identify any yield curve shape, understand what Australia’s current flattening means for the economy and portfolios, and appreciate the lag that separates a rate decision from its real-world consequences.
Australia’s inflation data heading into the May meeting showed headline CPI at 4.6%, nearly double the top of the RBA’s 2-3% target band, with trimmed mean holding at 3.3%, a distinction that proved central to how the Board framed its decision.
What the yield curve actually is (and why it matters more than the cash rate)
Most investors track the cash rate. It appears in every headline after an RBA decision. It is a single number, easy to absorb.
It is also only half the picture.
The yield curve is a graph plotting bond yields across different maturities for debt of equal credit quality. According to the RBA’s own education resources, the curve captures what the bond market collectively expects about growth, inflation, and future rate moves, all at once, updated in real time. Australia’s 3-year government bond yield currently sits at 4.76%, while the 10-year yield is approximately 5.06%. Those are not random figures; they represent a spectrum of expectations about where the economy is heading at different time horizons.
The RBA explainer on bonds and the yield curve sets out how yields across different maturities encode collective market expectations about growth, inflation, and future policy moves, making it one of the most comprehensive real-time economic forecasting tools available to investors.
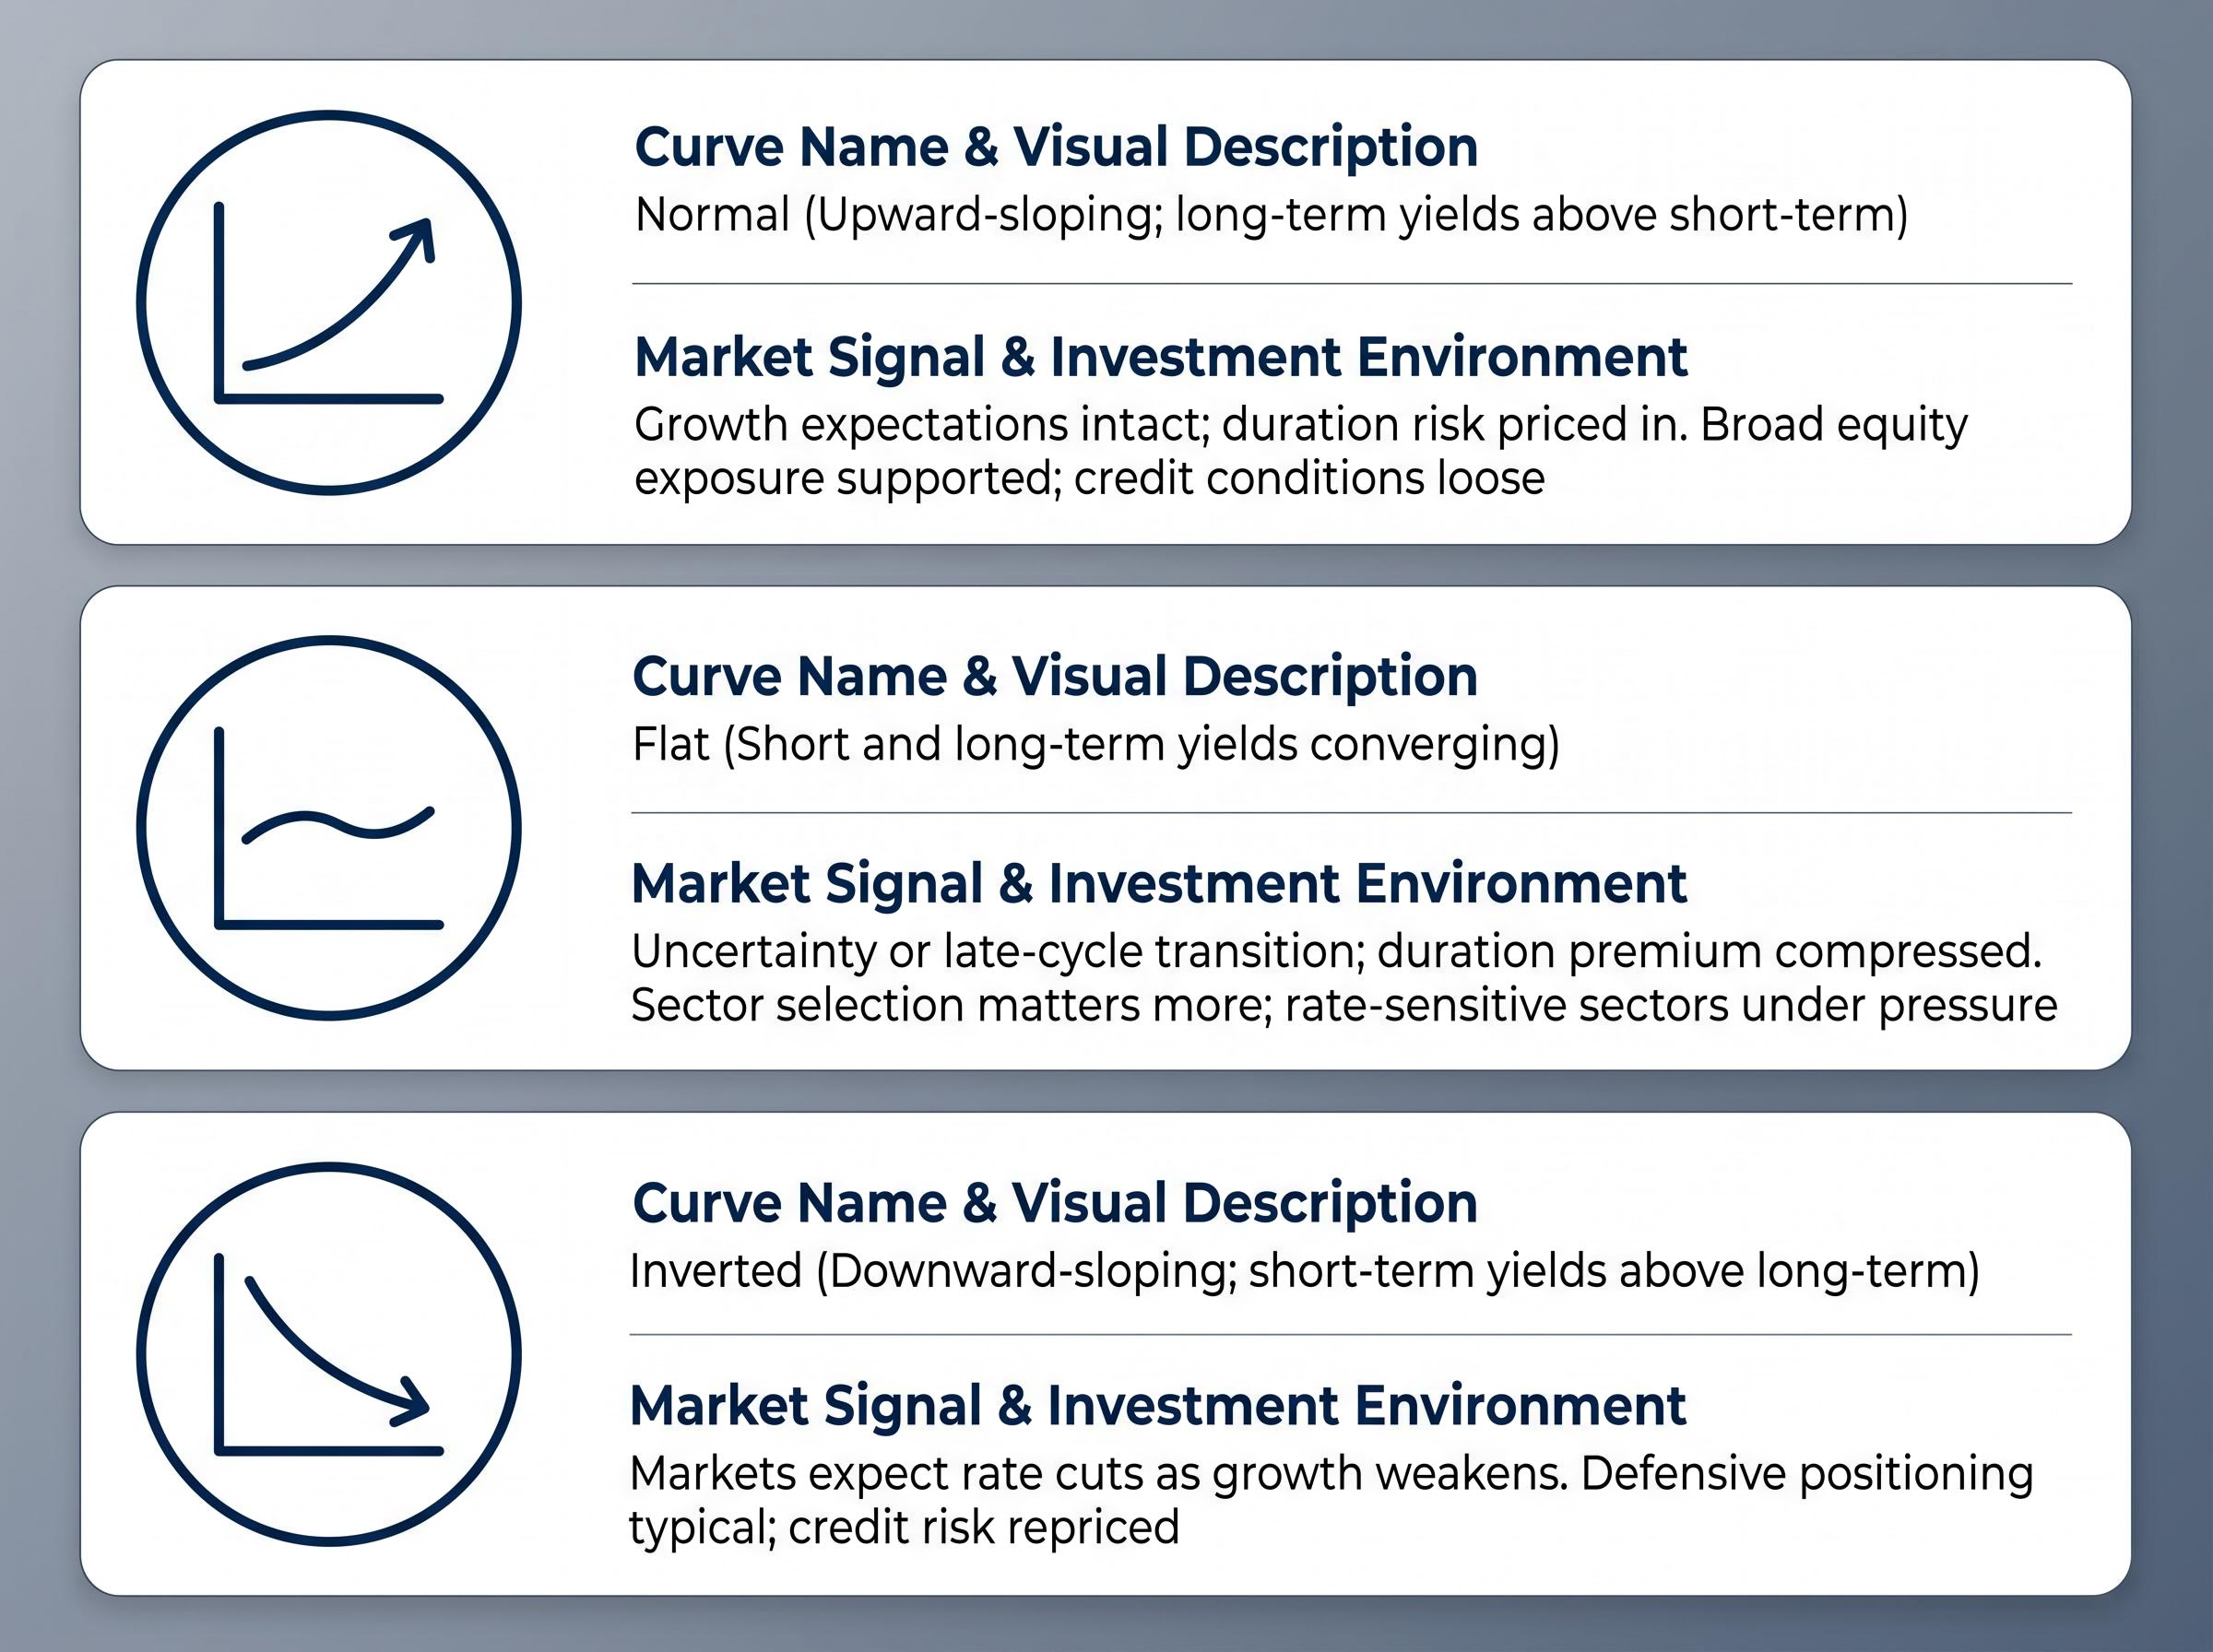
The three primary curve shapes investors should recognise:
- Normal (upward-sloping): Long-term yields are higher than short-term yields. Investors expect growth and demand compensation for duration risk.
- Flat: Short-term and long-term yields converge. The premium for holding longer-dated bonds has compressed, signalling uncertainty or transition.
- Inverted (downward-sloping): Short-term yields exceed long-term yields. Markets expect rate cuts ahead as growth weakens.
The curve as a market consensus, not a central bank announcement
The RBA sets the overnight cash rate. It does not set the 3-year or 10-year yield. Bond markets set those through supply and demand, with thousands of participants pricing in their expectations about where the economy will be in five, ten, or thirty years. The cash rate is a decision made by a board of nine people. The yield curve is a crowd-sourced economic forecast with real capital behind every position. Investors who watch only the cash rate are reading a policy announcement. Those who watch the yield curve are reading what the market believes that announcement will produce.
When big ASX news breaks, our subscribers know first
The three shapes and what they each signal
A normal yield curve is the starting position. When the economy is growing and inflation expectations are stable, investors demand higher yields for longer-dated bonds to compensate for the additional time their capital is locked away. The upward slope is not a prediction; it is the baseline cost of duration risk in a healthy economy.
A flat curve is where confidence begins to waver. The premium for lending over longer periods compresses, often because the market expects short-term rates have risen close to their peak and growth will slow. It is the transition zone: not yet a warning, but no longer a signal of assured expansion. Australia’s 10-year to 2-year spread currently sits at approximately 29.5 basis points, placing the curve firmly in flat territory.
An inverted curve is the alarm. When short-term yields exceed long-term yields, the market is pricing in a future where the central bank will need to cut rates because growth has deteriorated. The 2022 global tightening cycle produced inversions in both the US and UK that preceded the growth slowdown discussions of 2023, reinforcing the curve’s reputation as a recession predictor.
| Curve Shape | What It Looks Like | What Markets Are Signalling | Typical Investment Environment |
|---|---|---|---|
| Normal | Upward-sloping; long-term yields above short-term | Growth expectations intact; duration risk priced in | Broad equity exposure supported; credit conditions loose |
| Flat | Short and long-term yields converging | Uncertainty or late-cycle transition; duration premium compressed | Sector selection matters more; rate-sensitive sectors under pressure |
| Inverted | Downward-sloping; short-term yields above long-term | Markets expect rate cuts as growth weakens | Defensive positioning typical; credit risk repriced |
Inverted yield curves have preceded every US recession since the 1960s, though the lead time between inversion and economic contraction has varied from six months to more than two years. The signal is reliable in direction but imprecise in timing.
Australia’s yield curve right now, and what the flattening is telling us
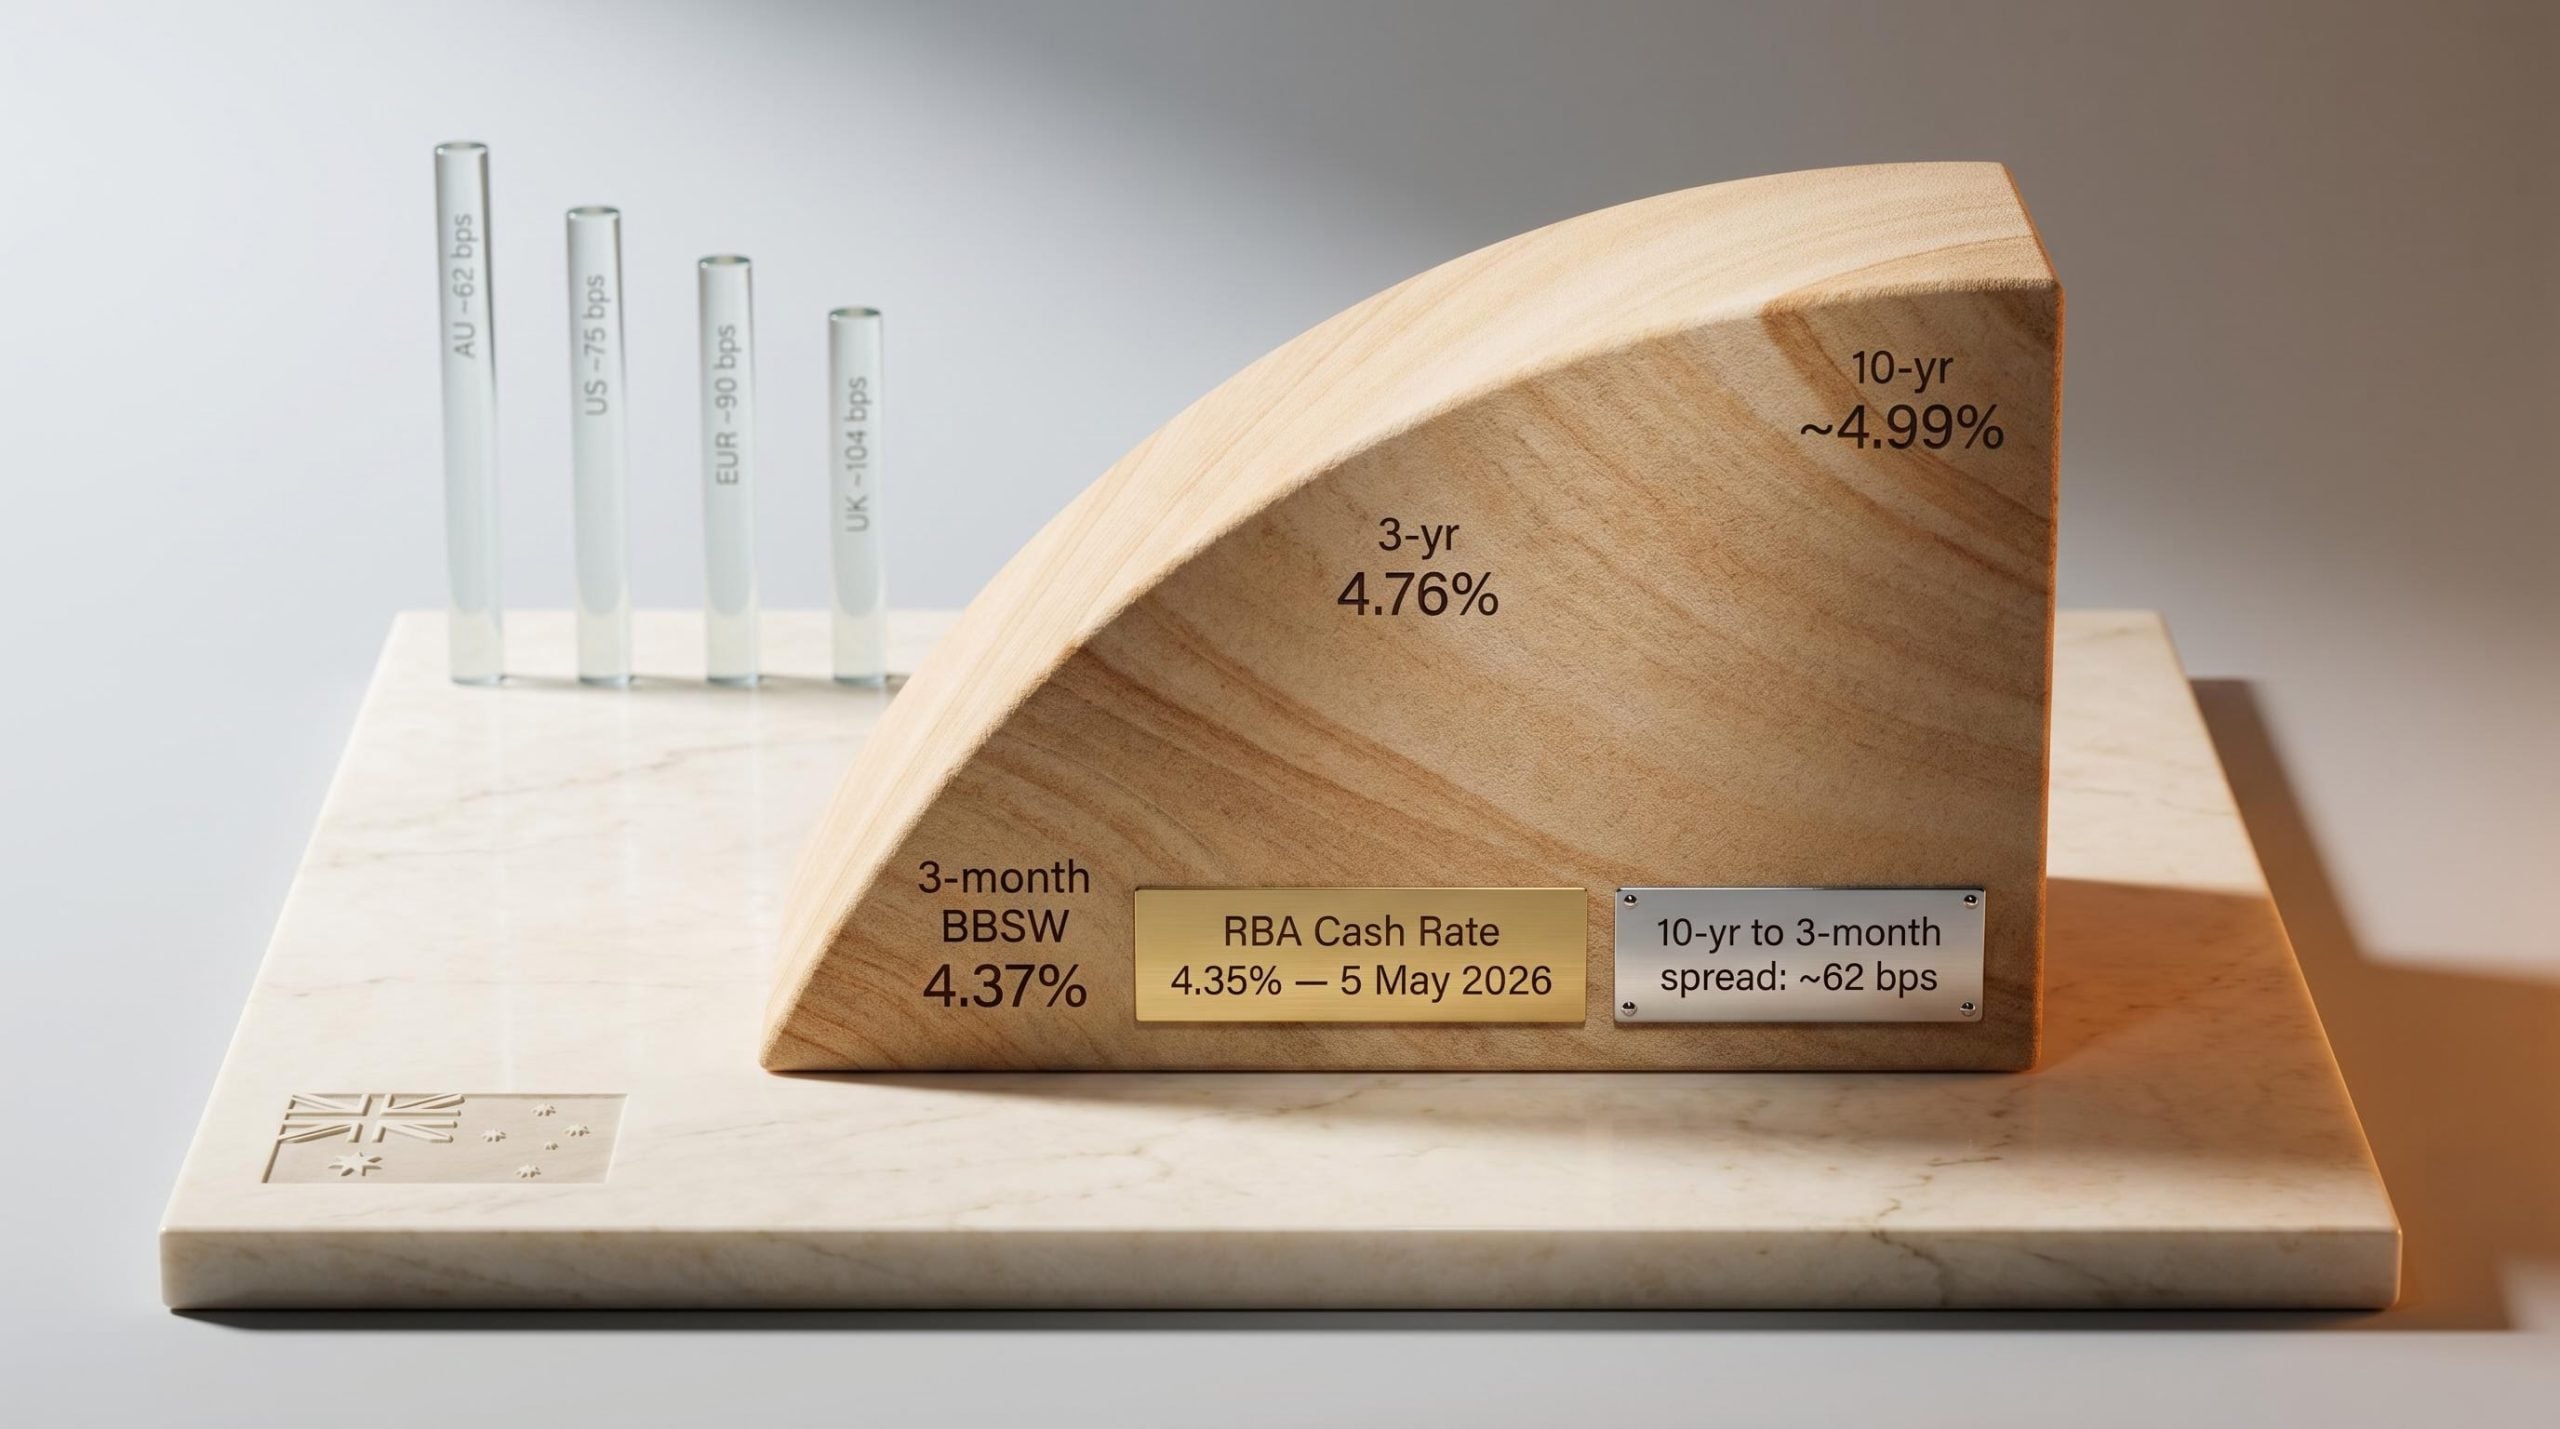
The numbers as of 6 May 2026 tell a specific story. The 3-month BBSW (the benchmark short-term rate) sits at 4.37%, according to ASX Benchmark Rates. The 10-year government bond yield is approximately 4.99%, per Trading Economics data accessed on the same date. That produces a 3-month to 10-year spread of roughly 62 basis points.
| Maturity | Yield (6 May 2026) | Change from Pre-Hike |
|---|---|---|
| 3-month BBSW | 4.37% | Stable (already reflected anticipated hike) |
| 3-year government bond | 4.76% | Marginal increase |
| 10-year government bond | ~4.99% | Slight decline from 4-week high of 5.08% on 30 April |
The spread has been compressing. But the cause matters as much as the direction. This flattening is being driven by the RBA’s hike cycle pushing short-end yields higher, not by a collapse in long-term growth expectations dragging the long end down. The 10-year yield remains near 5%, a level consistent with markets that still expect positive, if moderating, growth.
Flattening versus inverting: why the distinction matters for investors
A flattening curve compresses the gap between short and long-term yields; an inverted curve eliminates it entirely and pushes it negative. Australia has not inverted. The current flattening partly reverses a steepening that occurred in late 2025, when expectations of rate cuts (which never materialised) briefly widened the spread. What investors are observing now is a normalisation within a tightening cycle, not a recession signal. The figure to watch is whether the 62 basis point spread narrows toward zero. That would change the conversation.
Prior to the 5 May hike, RBA data from the Statement on Monetary Policy (published 2 May 2026) showed markets were pricing approximately 60 additional basis points of tightening, implying a terminal rate near 4.70% by end-2026. If that pricing holds, further flattening is the expected path, making ongoing monitoring of the spread direction more informative than any single data release.
The RBA’s May 2026 decision passed eight to one, with the single dissent narrowing the apparent consensus and forward guidance language that preserved full optionality on whether a fourth hike follows in July, making upcoming CPI and labour market prints the key inputs to watch.
Why the full impact of rate hikes has not arrived yet
The RBA raised the cash rate on 5 May 2026. The economy most Australians are experiencing today, however, is still responding to decisions made months ago.
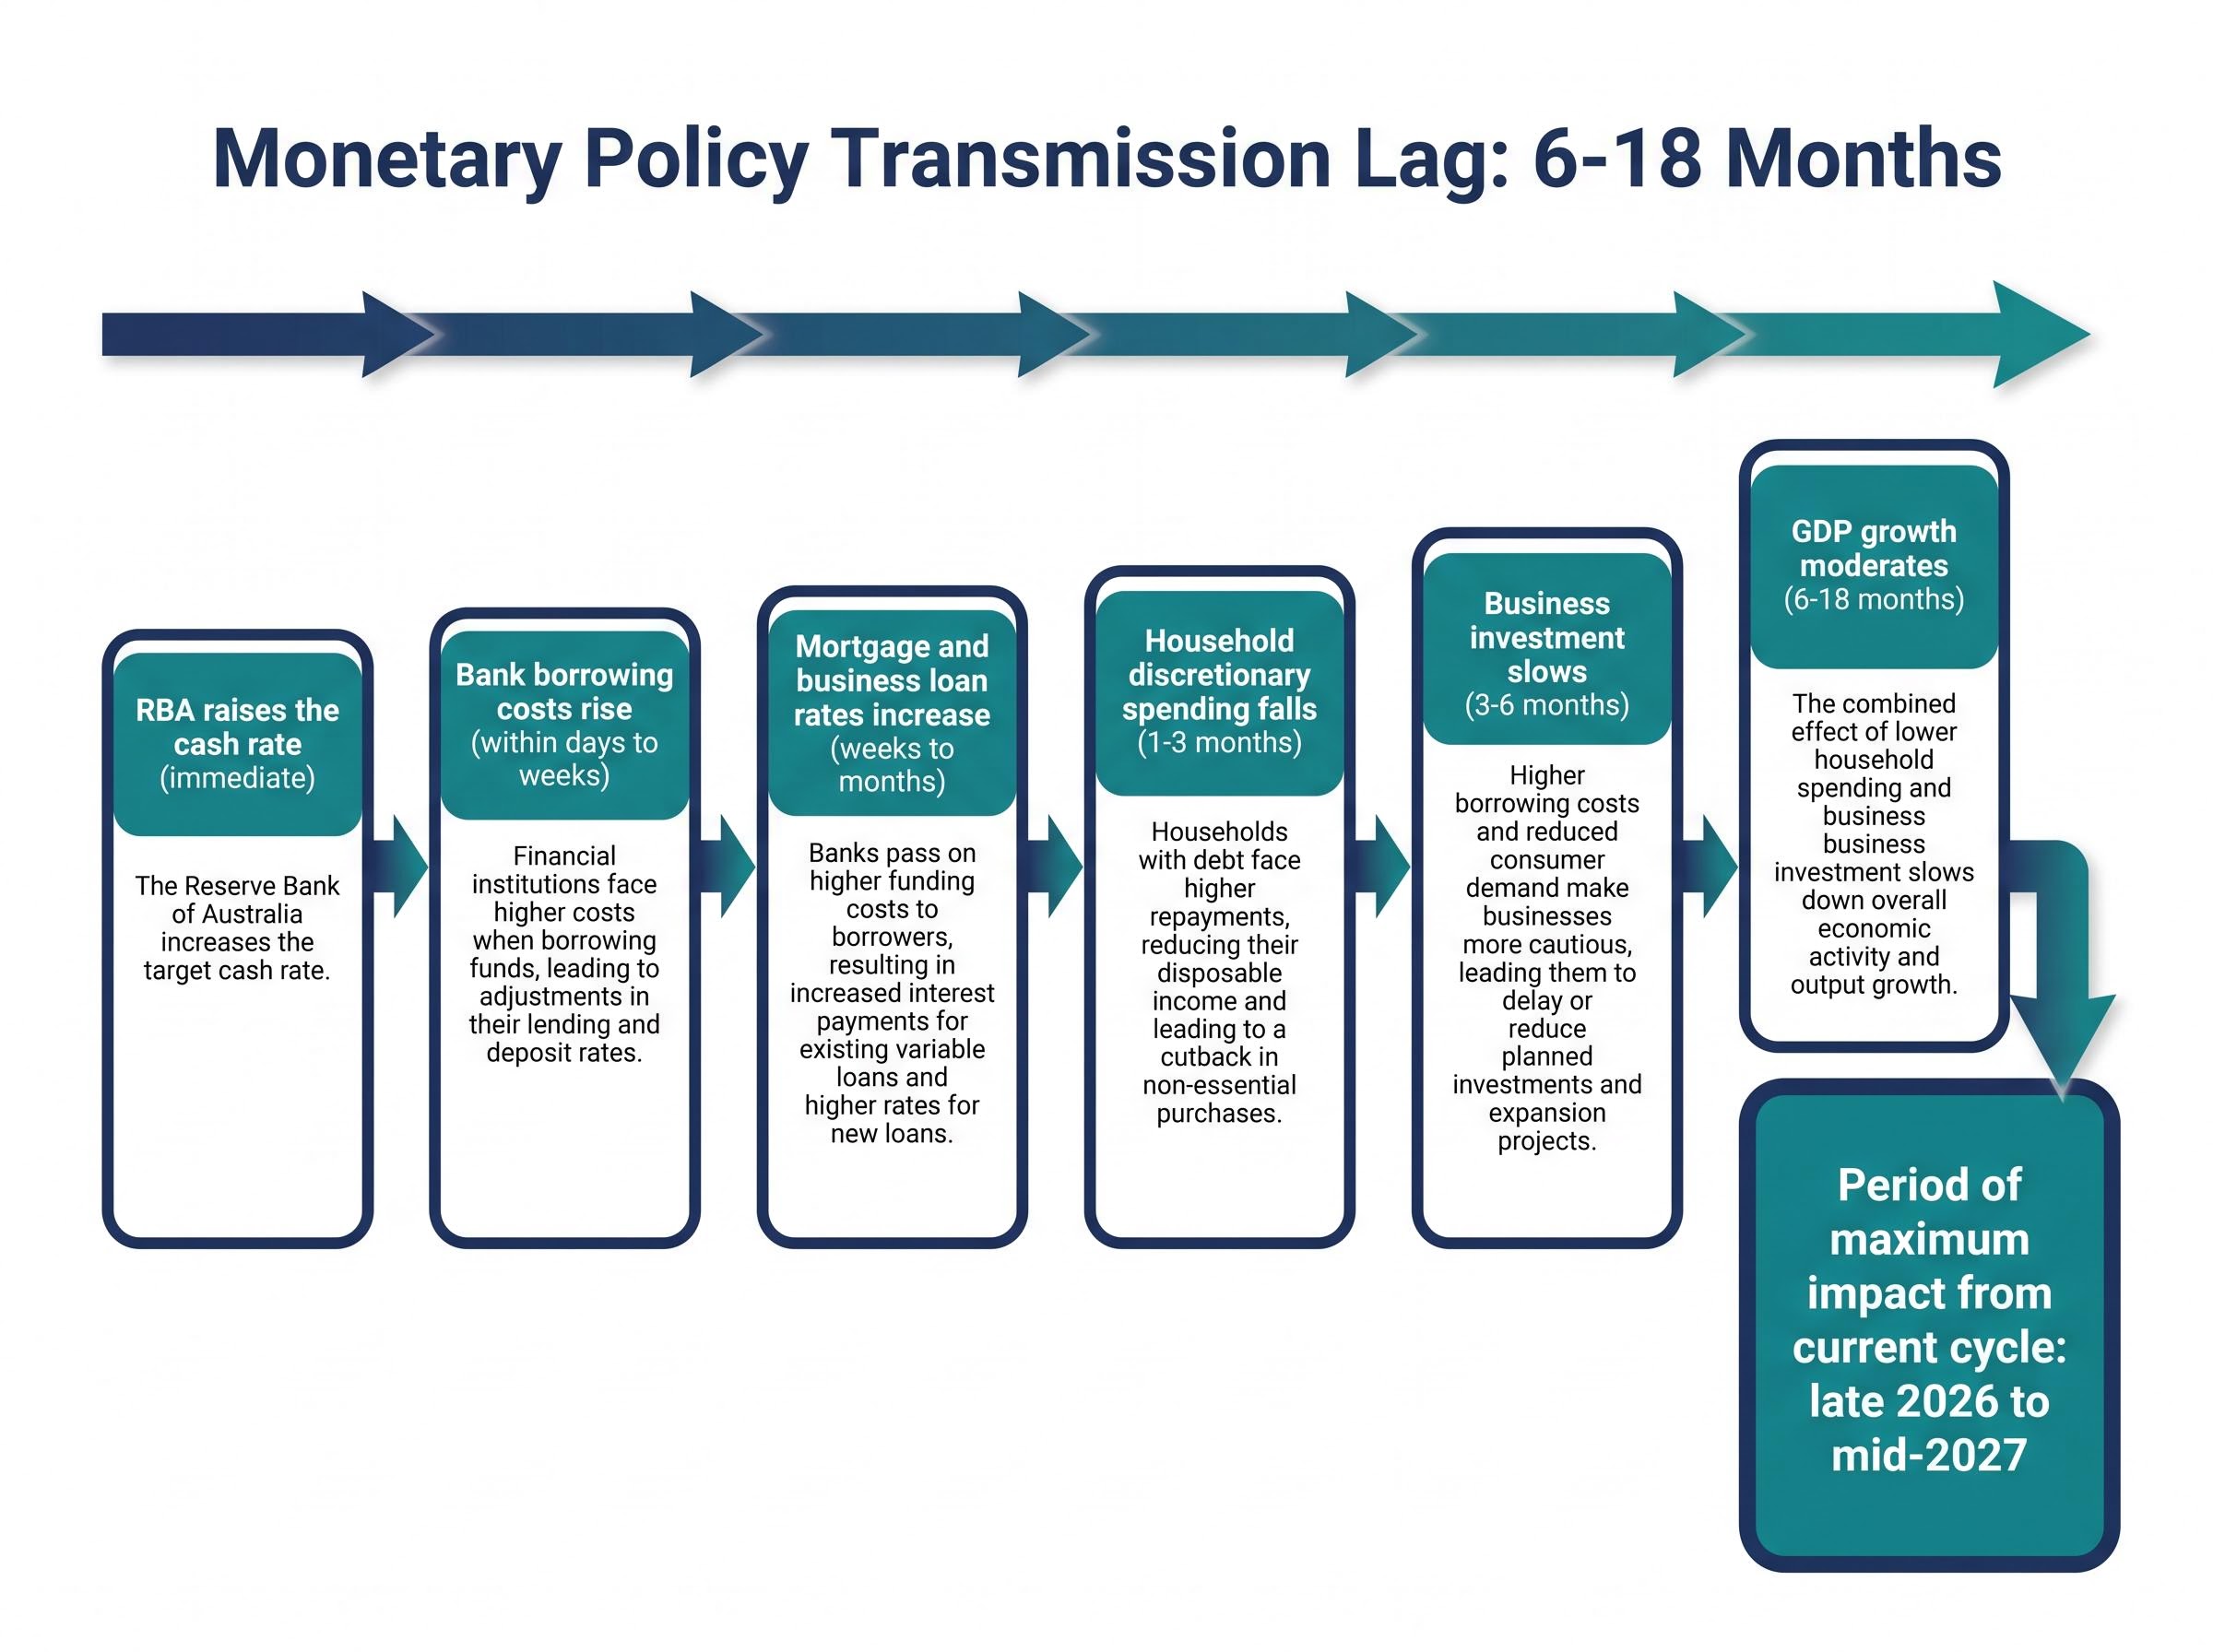
Monetary policy operates with a transmission lag of 6-18 months, a feature RBA Governor Michele Bullock has explicitly acknowledged. This is not a theoretical estimate. It is an empirical observation grounded in decades of central banking experience.
The RBA transmission of monetary policy framework documents each step in the chain from cash rate decision to economic outcome, providing the empirical basis for the 6-18 month lag estimate that central banks and market participants rely on when interpreting tightening cycles.
RBA Governor Michele Bullock has stated that the effects of rate hikes will not be visible in economic data for a minimum of six months following each decision.
The mechanism follows a sequence, and each step carries its own delay:
- RBA raises the cash rate (immediate)
- Bank borrowing costs rise (within days to weeks)
- Mortgage and business loan rates increase (weeks to months, faster for variable-rate mortgages)
- Household discretionary spending falls as higher repayments reduce disposable income (1-3 months)
- Business investment slows as borrowing becomes more expensive (3-6 months)
- GDP growth moderates as reduced spending and investment feed through aggregate demand (6-18 months)
Australia has a specific structural feature that accelerates part of this chain: the prevalence of variable-rate mortgages means households feel rate increases faster than in markets dominated by fixed-rate lending. Business lending transmission, however, still follows the standard lag.
The current economic backdrop reflects this incomplete transmission. Unemployment remains at 4.30%, indicating a tight labour market that has not yet absorbed the full impact of cumulative tightening. M3 money supply growth was 8.24% year-on-year as of March 2026, near the long-run median of 8.6% since 1960, suggesting monetary conditions are not excessively loose by historical standards.
The period of maximum impact from the current hike cycle falls in late 2026 to mid-2027. That is the window to watch.
How Australia’s curve compares to the rest of the world
Australia’s yield curve flattening does not exist in isolation. The RBA hiked on 5 May 2026 while the Fed, the Bank of England, and the ECB all held rates steady in the same week. That divergence is visible in the spread data.
| Economy | 3-month to 10-year Spread (approx. May 2026) | Curve Shape Description |
|---|---|---|
| Australia | ~62 bps | Mildly upward-sloping, flattening |
| United States | ~75 bps | Upward-sloping, moderate steepness |
| United Kingdom | ~104 bps | Upward-sloping, steeper than peers |
| Eurozone (Germany proxy) | ~90 bps | Upward-sloping, stable |
Australia’s spread is the narrowest among these four major economies. The RBA’s outlier position, as the only major central bank actively hiking, has pushed Australia’s short-end yields higher relative to peers while long-end yields have moved broadly in line with global bond markets. The result is a flatter curve than the US, UK, or Eurozone, not because of weaker growth expectations but because of more aggressive near-term policy.
The Fed’s May hold decision came with a historically unusual four-way FOMC dissent, exposing a committee divided between a 3.5% PCE reading and rising unemployment, a dual-mandate conflict that has direct bearing on how long the US curve stays steeper than Australia’s.
The over-tightening risk that investors should monitor
The primary danger is not Australia’s current flattening in isolation. It is a scenario in which multiple major central banks push short-end yields above long-end yields simultaneously, creating a coordinated inversion signal. If central banks globally focus on energy-price and wage dynamics while disregarding money supply conditions, coordinated over-tightening could compress growth unnecessarily.
Coordinated central bank over-tightening across major economies is the tail risk that makes the current Australian flattening more consequential than it would appear in isolation, with JPMorgan raising its stagflation probability to 35% and Goldman Sachs projecting H2 2026 GDP growth of just 0.8% in the US, compressing global growth expectations that anchor long-end yields everywhere.
The 2022 experience provides a precedent for how quickly central bank direction can change. The Fed, ECB, and Bank of England all reversed from characterising inflation as transitory to implementing aggressive hikes within months. A similarly abrupt pivot in the opposite direction remains possible.
Australia’s M3 growth of 8.24% against a historical median of 8.6% raises a specific question: whether the monetary tightening rationale is fully supported by money-supply evidence. For Australian investors with international exposure, a globally coordinated yield curve inversion is the tail risk to consider. It is not the base case, but understanding where each major economy sits on the curve-shape spectrum informs how to assess portfolio vulnerability.
What Australian investors should actually do with this information
The yield curve is a monitoring tool, not a trading trigger. Its value lies in calibrating risk appetite and sector positioning over quarters, not in timing market entries and exits.
The specific signals to track, along with their implications:
- Spread narrows below 30 basis points: Review exposure to rate-sensitive sectors including property, financials, and consumer discretionary.
- Spread approaches zero: Reassess growth asset allocation; consider increasing duration in fixed income.
- Spread turns negative (inversion): Historical precedent suggests a growth contraction is likely within 6-18 months; defensive positioning warrants serious evaluation.
- Spread widens back above 80 basis points: Suggests the tightening cycle may be peaking and growth expectations are stabilising.
The mortgage dimension adds urgency for Australian households specifically. With variable-rate mortgages dominating the market, past hikes have already reduced disposable income for many borrowers. Further compression of the yield curve would signal that additional pressure on household spending is likely before relief arrives.
Corporate bond spreads have risen but remain low compared with historical averages, according to the RBA’s May 2026 Statement on Monetary Policy. Credit markets have not yet signalled distress, which supports the base case of continued growth moderation without recession.
Janus Henderson’s May 2026 Australian economic assessment places no recession in the base case, with risks described as “broadly distributed.” The high case involves further hikes extending into 2027 if inflation remains elevated.
The current signal is not alarm. It is attentiveness. The 62 basis point spread is the baseline; the direction of travel from here determines whether the investment posture shifts.
The yield curve will not tell you everything, but it tells you more than most
The yield curve encodes collective market intelligence about growth and interest rates across multiple time horizons. It is more forward-looking than the unemployment rate, more comprehensive than any single inflation print, and more grounded than most forecasting models because it is priced by participants with real capital at stake.
It also has limits. Central bank decisions are made by humans whose views change. Futures markets are not reliably predictive over long horizons. A curve can stay flat or inverted longer than investors expect before the underlying economic shift materialises. The 2022 pivot, when major central banks reversed course abruptly, is a reminder that the curve captures current expectations, not certainties.
For Australian investors, the current signal is calibrated: a mildly flat curve, consistent with a tightening cycle in its later stages, that does not yet indicate recession. The 6-18 month transmission lag means the full effects of the May 2026 hike will appear in data no earlier than late 2026. The global over-tightening scenario remains the tail risk worth reviewing on a quarterly basis.
The current yield curve signal for Australian investors: cautious optimism with a defined risk window, not alarm. Monitor the 3-month to 10-year spread direction and watch for any move toward zero.
This article is for informational purposes only and should not be considered financial advice. Investors should conduct their own research and consult with financial professionals before making investment decisions.
Past performance does not guarantee future results. Financial projections are subject to market conditions and various risk factors.