VGS Leads Vanguard ETF Pack With 14% FY26 Capital Return
3 hrs ago

One stock out of 210 generated 27% of all the wealth created across the largest companies on the ASX over 15 years. Pro Medicus alone. The next nine biggest contributors added another 29%. Everyone else, the remaining 200 companies, shared 44%.
A Morningstar Australia analysis by Mark LaMonica, CFA, published in April 2026, examined 15 years of returns across 210 large-cap ASX companies using the same return-concentration framework that Professor Henrik Bessembinder applied to US equities. The Australian results are striking. Approximately 36% of large-cap ASX stocks outperformed the index over the period. The remaining 64% did not. The odds against a retail stock picker landing the right names are not merely unfavourable; they are structurally unfavourable.
What follows unpacks what the Morningstar data actually shows, why the ASX is prone to this kind of concentration, what happened to the stocks most retail investors hold, and what the findings mean for any Australian investor deciding between picking individual stocks and investing passively.
Start with a hypothetical. An investor places $1,000 into each of the 210 largest ASX companies at the beginning of the study period, a total outlay of $210,000. Over 15 years, that portfolio grows to approximately $1.8 million.
The concentration becomes visible in absolute terms. Just 10 stocks generated over $1 million of that $1.8 million ending value, accounting for 56% of all wealth created. Pro Medicus alone contributed 27%.
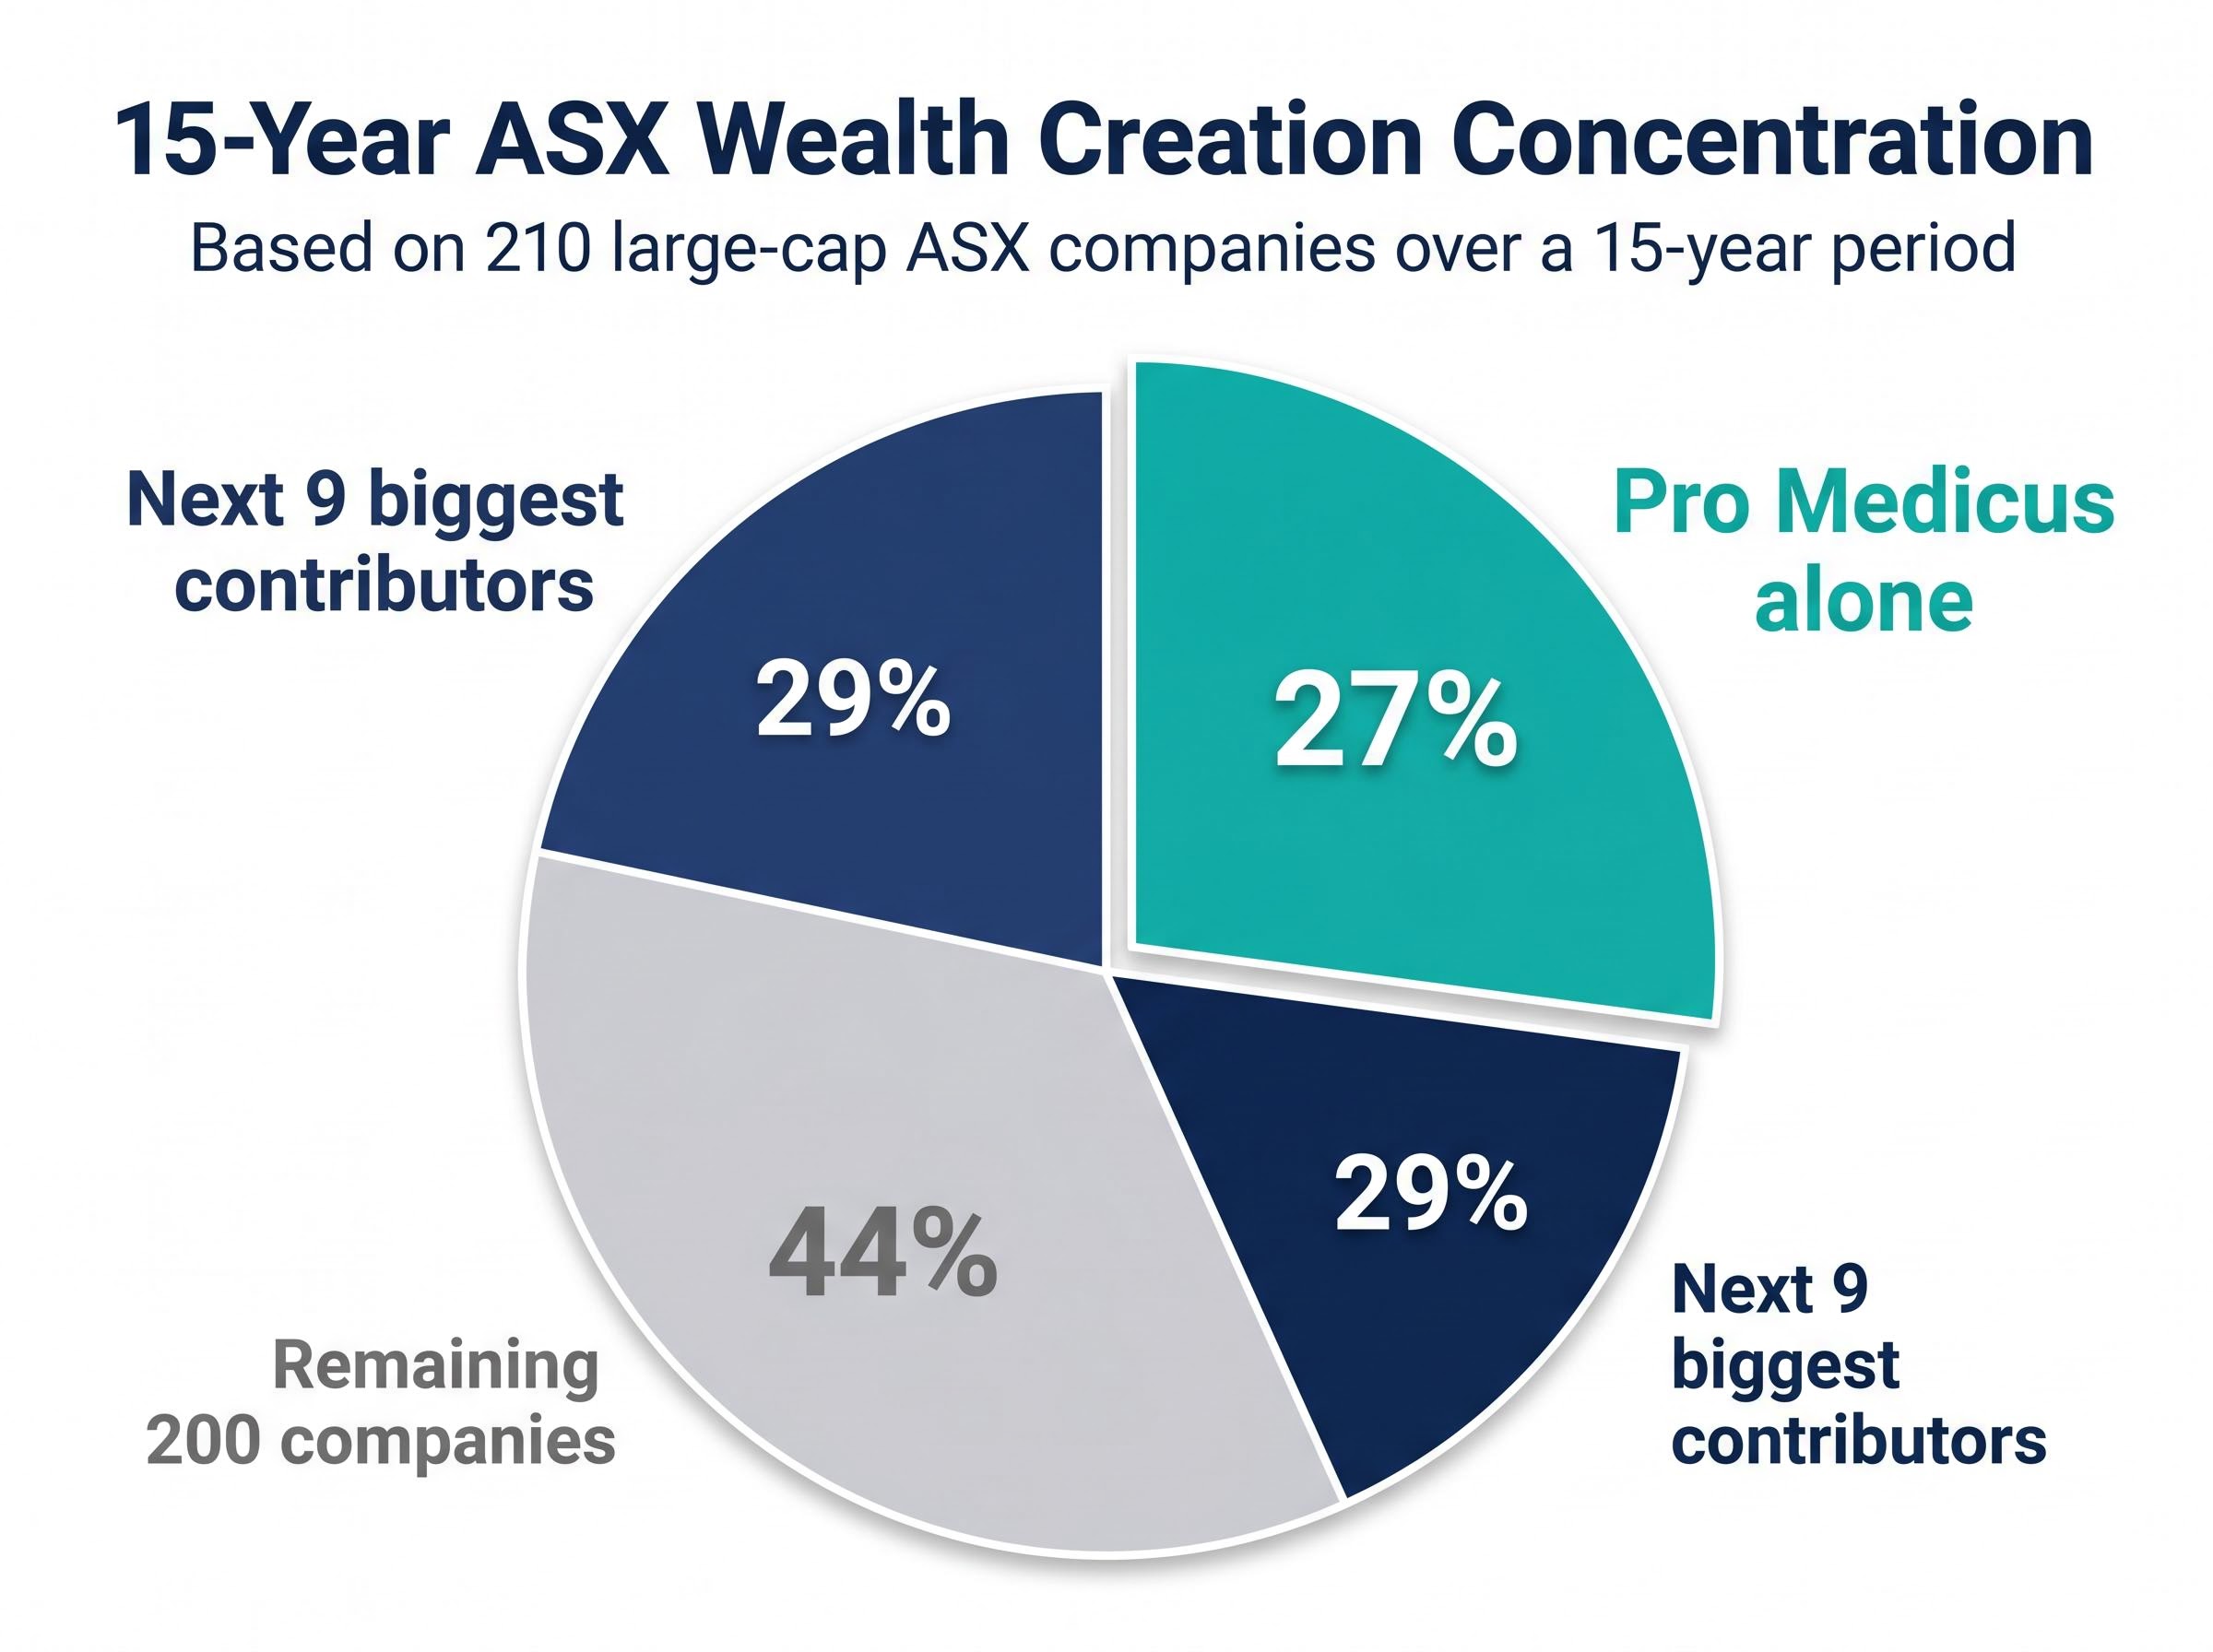
Pro Medicus generated 27% of total wealth created across all 210 large-cap ASX companies over 15 years, according to Morningstar Australia’s analysis.
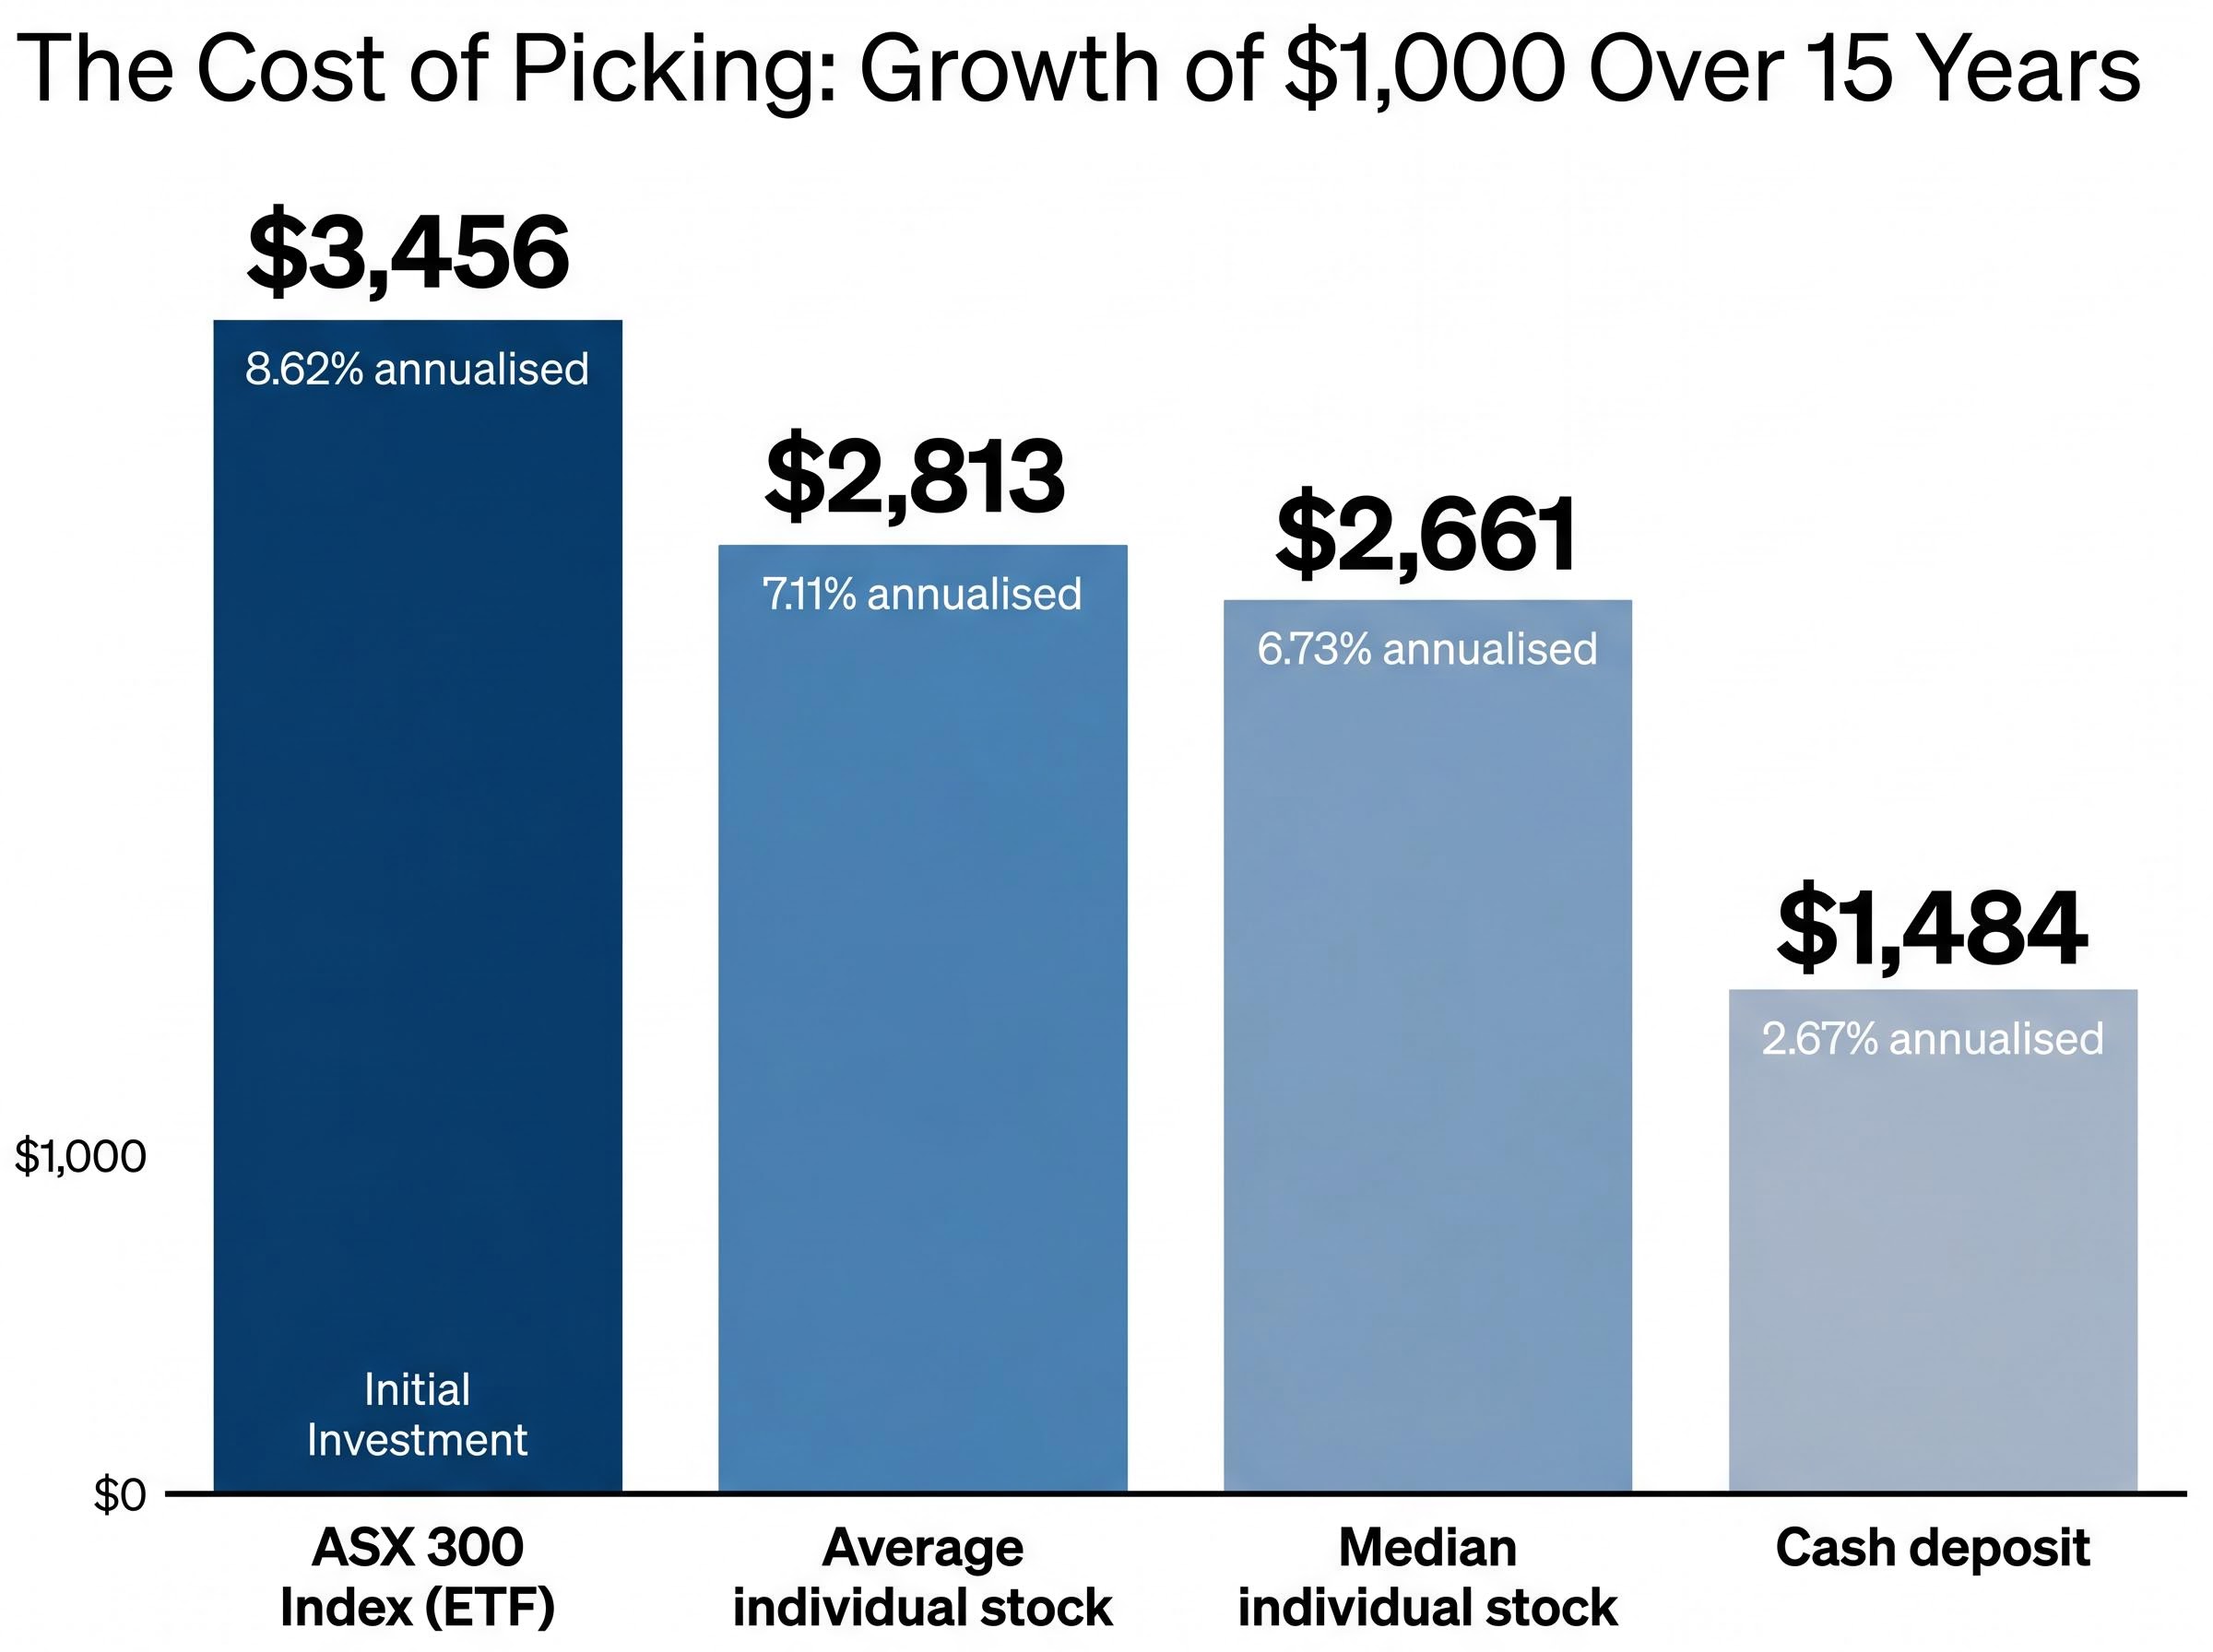
The ASX 300 delivered an annualised return of 8.62% over the period. The average individual stock returned 7.11% annualised. The median was lower still, at 6.73%. That gap between the index and the typical stock is where the concentration thesis lives: a small number of outliers lift the index above the return most individual holdings actually deliver.
| Metric | Value |
|---|---|
| Starting portfolio (210 stocks x $1,000) | $210,000 |
| Ending value (15 years) | ~$1.8 million |
| Contribution from top 10 stocks | 56% of total wealth created |
| Contribution from Pro Medicus alone | 27% of total wealth created |
| Contribution from remaining 200 stocks | 44% of total wealth created |
For any Australian investor holding or considering a portfolio of hand-picked shares, these numbers define the baseline challenge. Achieving index-beating results requires not just picking good stocks, but picking the specific handful that generate the vast majority of all gains.
The analytical framework that makes the Australian concentration result legible comes from Professor Henrik Bessembinder’s research on US equities, first published in 2018 and extended through 2024. Bessembinder examined roughly a century of US stock returns and found a deeply skewed distribution. The median US stock produced a buy-and-hold return of -6.87%. Fewer than half of all stocks, approximately 41.17%, generated a positive return exceeding Treasury bills over their lifetime.
Bessembinder’s foundational research on US stock returns, published in 2018, established that the best-performing 4% of listed US companies explained the net gain for the entire market since 1926, with the median stock producing a lifetime buy-and-hold return below Treasury bills.
Morningstar’s LaMonica applied the same framework to the ASX and found the Australian market exhibits three core properties:
These findings align with independent academic work. Prof. Bruce Grundy of the University of Melbourne published research in November 2025 on ASX return skewness, finding approximately 39% of stocks beat the index, closely consistent with Morningstar’s result.
The uncomfortable finding is that the ASX concentration problem appears more acute than the US equivalent, not less. Directional estimates suggest the ASX’s top 10 stocks account for approximately 52% of 20-year wealth creation, compared with roughly 40% for US equities.
The structural reason is sectoral. The ASX is heavily weighted toward banks and miners, which reduces the breadth of high-growth opportunities compared with the US market’s deep technology sector. Fewer diversified growth sectors means fewer potential outlier compounders, amplifying the dependence on individual stocks like Pro Medicus to generate outsized index-level wealth. The assumption that concentration is a US-specific phenomenon does not survive the data.
Concentration risk in US indices has reached comparably extreme levels, with five mega-cap stocks controlling approximately 23% of the broad market, a structural parallel that suggests the skewed-return phenomenon documented by Bessembinder is not unique to Australia but is a property of modern equity markets globally.
The concentration thesis gains a sharper edge when applied to the stocks that populate most Australian retail portfolios. Among the five largest banks, only Macquarie and Commonwealth Bank of Australia outperformed the ASX 300’s 8.62% annualised return over 15 years. ANZ, NAB, and Westpac all trailed the benchmark.
Among the three largest miners, only Fortescue outperformed. BHP and Rio Tinto both underperformed.
| Company | Sector | 15-year result vs ASX 300 |
|---|---|---|
| Macquarie | Banking | Outperformed |
| CBA | Banking | Outperformed |
| ANZ | Banking | Underperformed |
| NAB | Banking | Underperformed |
| Westpac | Banking | Underperformed |
| Fortescue | Mining | Outperformed |
| BHP | Mining | Underperformed |
| Rio Tinto | Mining | Underperformed |
These are the default holdings for many Australian retail investors, chosen for dividend income and perceived stability. The data suggests familiarity and yield have not translated into index-beating total returns for three of five major banks and two of three major miners.
The broader context reinforces the point. The S&P 500 delivered an annualised return of 16.03% in AUD terms over the same period, more than 7 percentage points above the ASX 300 annually. Morningstar’s analysis identifies the underperformance of banks and miners as a key driver of that gap.
The Australian home bias shift accelerated sharply in Q1 2026, with international ETFs overtaking domestic ETFs as the most purchased category on major retail platforms, a structural change that aligns with the underperformance of ASX banks and miners relative to global benchmarks.
The already-unfavourable concentration data likely understates the problem. Morningstar’s study used only the 210 largest ASX companies with a full 15-year return history, drawn from an initial pool of approximately 333 large-cap firms.
That means 123 companies were excluded. The reasons for exclusion introduce a systematic upward bias:
Energy Resources of Australia (ASX: ERA) did make the dataset, and its 15-year annualised return was approximately -25%, despite the stock gaining +33.33% YTD in 2026. Short-term rebounds can obscure long-term wealth destruction.
Returns in the study include dividend reinvestment but exclude franking credits. The 333 companies reviewed represent approximately 15% of all 2,261 ASX-listed shares, meaning the analysis covers only the large-cap tier of the market; the full distribution across smaller companies is likely more skewed still.
For retail investors, the survivorship limitation matters because real-world portfolios include companies that did not survive. Even the cleaned-up dataset produces deeply negative outcomes for a meaningful share of stocks. The true distribution is likely worse.
The statistical case is now established. The practical question is what it means for the individual Australian investor sitting at a screen, evaluating stocks.
To match index performance through individual stock selection, an investor needs to identify, buy, and hold the specific stocks in the top 36% of performers, while avoiding disproportionate concentration in the bottom half of the distribution. Most retail investors picking ASX stocks cannot clearly articulate their stock selection strategy, and Morningstar’s LaMonica identifies this as the primary predictor of poor outcomes.
Hamish Douglass, speaking on the Livewire Markets podcast in April 2026, warned that active stock picking produces “lottery ticket” outcomes for most retail investors.
Market-cap weighted index construction mitigates the concentration risk automatically. The index increases its weighting in winners as they grow and reduces its weighting in underperformers as they shrink. Individual stock pickers must execute that rebalancing manually, and rarely do.
The shift toward passive strategies is accelerating. Australian ETF inflows reached $5.3 billion in January 2026 and $5.6 billion in March 2026. ETFs now represent approximately 35% of retail portfolios, according to Livewire Markets survey data from April 2026.
Betashares 2025 ETF industry data recorded $53 billion in annual inflows and forecast the market to surpass $400 billion in total assets during 2026, providing the structural backdrop for the monthly inflow figures cited in this analysis.
Before picking individual ASX stocks, a retail investor should be able to answer three questions:
If those questions do not have clear answers, the data suggests the investor is operating against the base-rate odds.
The stocks vs ETFs framework that most helps investors in this position is the core-and-satellite model, which allocates roughly 75% to broad index ETFs for diversified market exposure and reserves the remaining 25% for individual positions where a specific, articulable edge exists.
The concentration finding is not an argument against the ASX. It is an argument for a specific way of accessing it.
A market-cap weighted ETF holds more of the winners as they compound and less of the losers as they decline. An investor in an ASX 300 ETF over the 15-year period would have earned 8.62% annualised, growing $1,000 to $3,456, ahead of the average individual stock (7.11%, growing $1,000 to $2,813) and far ahead of cash (2.67%, growing $1,000 to $1,484). No requirement to identify Pro Medicus in advance.
For investors ready to act on the passive case, our full explainer on ASX ETF structure and costs walks through management expense ratios as low as 0.04%, the legal separation of ETF assets under a unit trust, CGT discount eligibility, and the key execution practices that protect returns when buying on the ASX.
| Approach | Annualised return | $1,000 grown to |
|---|---|---|
| ASX 300 Index (ETF) | 8.62% | $3,456 |
| Average individual stock | 7.11% | $2,813 |
| Median individual stock | 6.73% | $2,661 |
| Cash deposit | 2.67% | $1,484 |
Some 72% of stocks in the dataset beat cash returns. But only 36% beat the index. The gap between those two figures captures the concentration effect: most stocks produce a positive return, but most still trail what the index delivers by automatically overweighting the rare compounders.
Morningstar’s LaMonica frames the distinction clearly: the ability to articulate a selection strategy is the prerequisite for stock picking, not the starting point. For investors who cannot define that strategy, the index is not a fallback. It is the rational first choice.
Return concentration on the ASX is structural, documented across 15 years of large-cap data, and likely understated by survivorship effects that removed the worst outcomes from the dataset. The data supports two legitimate paths. For investors who cannot define their stock selection strategy in advance, a passive index approach captures the market’s return, including its rare outliers, without requiring prescience. For investors who can articulate a disciplined, strategy-led approach, individual stock selection remains viable.
The data does not make the case that no one should pick stocks. It makes the case that picking stocks without a clear framework is a structurally disadvantaged activity in a market this concentrated.
This article is for informational purposes only and should not be considered financial advice. Investors should conduct their own research and consult with financial professionals before making investment decisions. Past performance does not guarantee future results.
Return concentration means a very small number of stocks generate the vast majority of total market wealth. In Morningstar Australia's 15-year study of 210 large-cap ASX companies, just 10 stocks produced 56% of all wealth created, with Pro Medicus alone accounting for 27%.
According to Morningstar Australia's April 2026 analysis, only approximately 36% of large-cap ASX stocks outperformed the ASX 300 index over 15 years, meaning roughly 64% of individual stocks trailed the benchmark.
Among the five largest banks, only Macquarie and CBA outperformed the ASX 300's annualised return of 8.62%, while ANZ, NAB, and Westpac all underperformed. Among the three largest miners, only Fortescue outperformed, with BHP and Rio Tinto both trailing the benchmark.
Survivorship bias occurs when failed or delisted companies are excluded from a study, inflating the reported average returns. Morningstar's analysis covered only 210 companies with a full 15-year history, excluding 123 firms, among them companies like Virgin Australia that went insolvent, meaning the true distribution of returns is likely worse than the published figures suggest.
An ASX 300 index ETF would have returned 8.62% annualised, growing $1,000 to $3,456, compared to the average individual stock's 7.11% annualised return growing $1,000 to $2,813, and the median stock's 6.73% return growing $1,000 to $2,661.