
Crude Drops 4% on Hormuz Hopes, but the Deal Isn’t Done
11 hrs ago


A single accounting policy change wiped $949 million from National Australia Bank’s reported earnings today, but strip it out and a different story emerges. NAB released its first-half FY2026 results on 4 May 2026, with statutory profit falling 18% and shares dipping approximately 1% to $39.36. The headline numbers risk obscuring what was, on an underlying basis, a period of genuine operational progress. What follows separates the accounting noise from the business reality: what actually drove performance, where credit risks are building, what the dividend and capital position signal, and how the result shapes the investment case from here.
Statutory net profit of $2,750 million looks alarming until the single item responsible for the decline is isolated. A $949 million after-tax charge relating to a change in software capitalisation policy accounted for nearly all of the gap between this half and the prior corresponding period. The charge was not a write-down of a failed asset. NAB described it as a deliberate response to a rapidly changing technology environment, reclassifying how it accounts for certain software spending going forward.
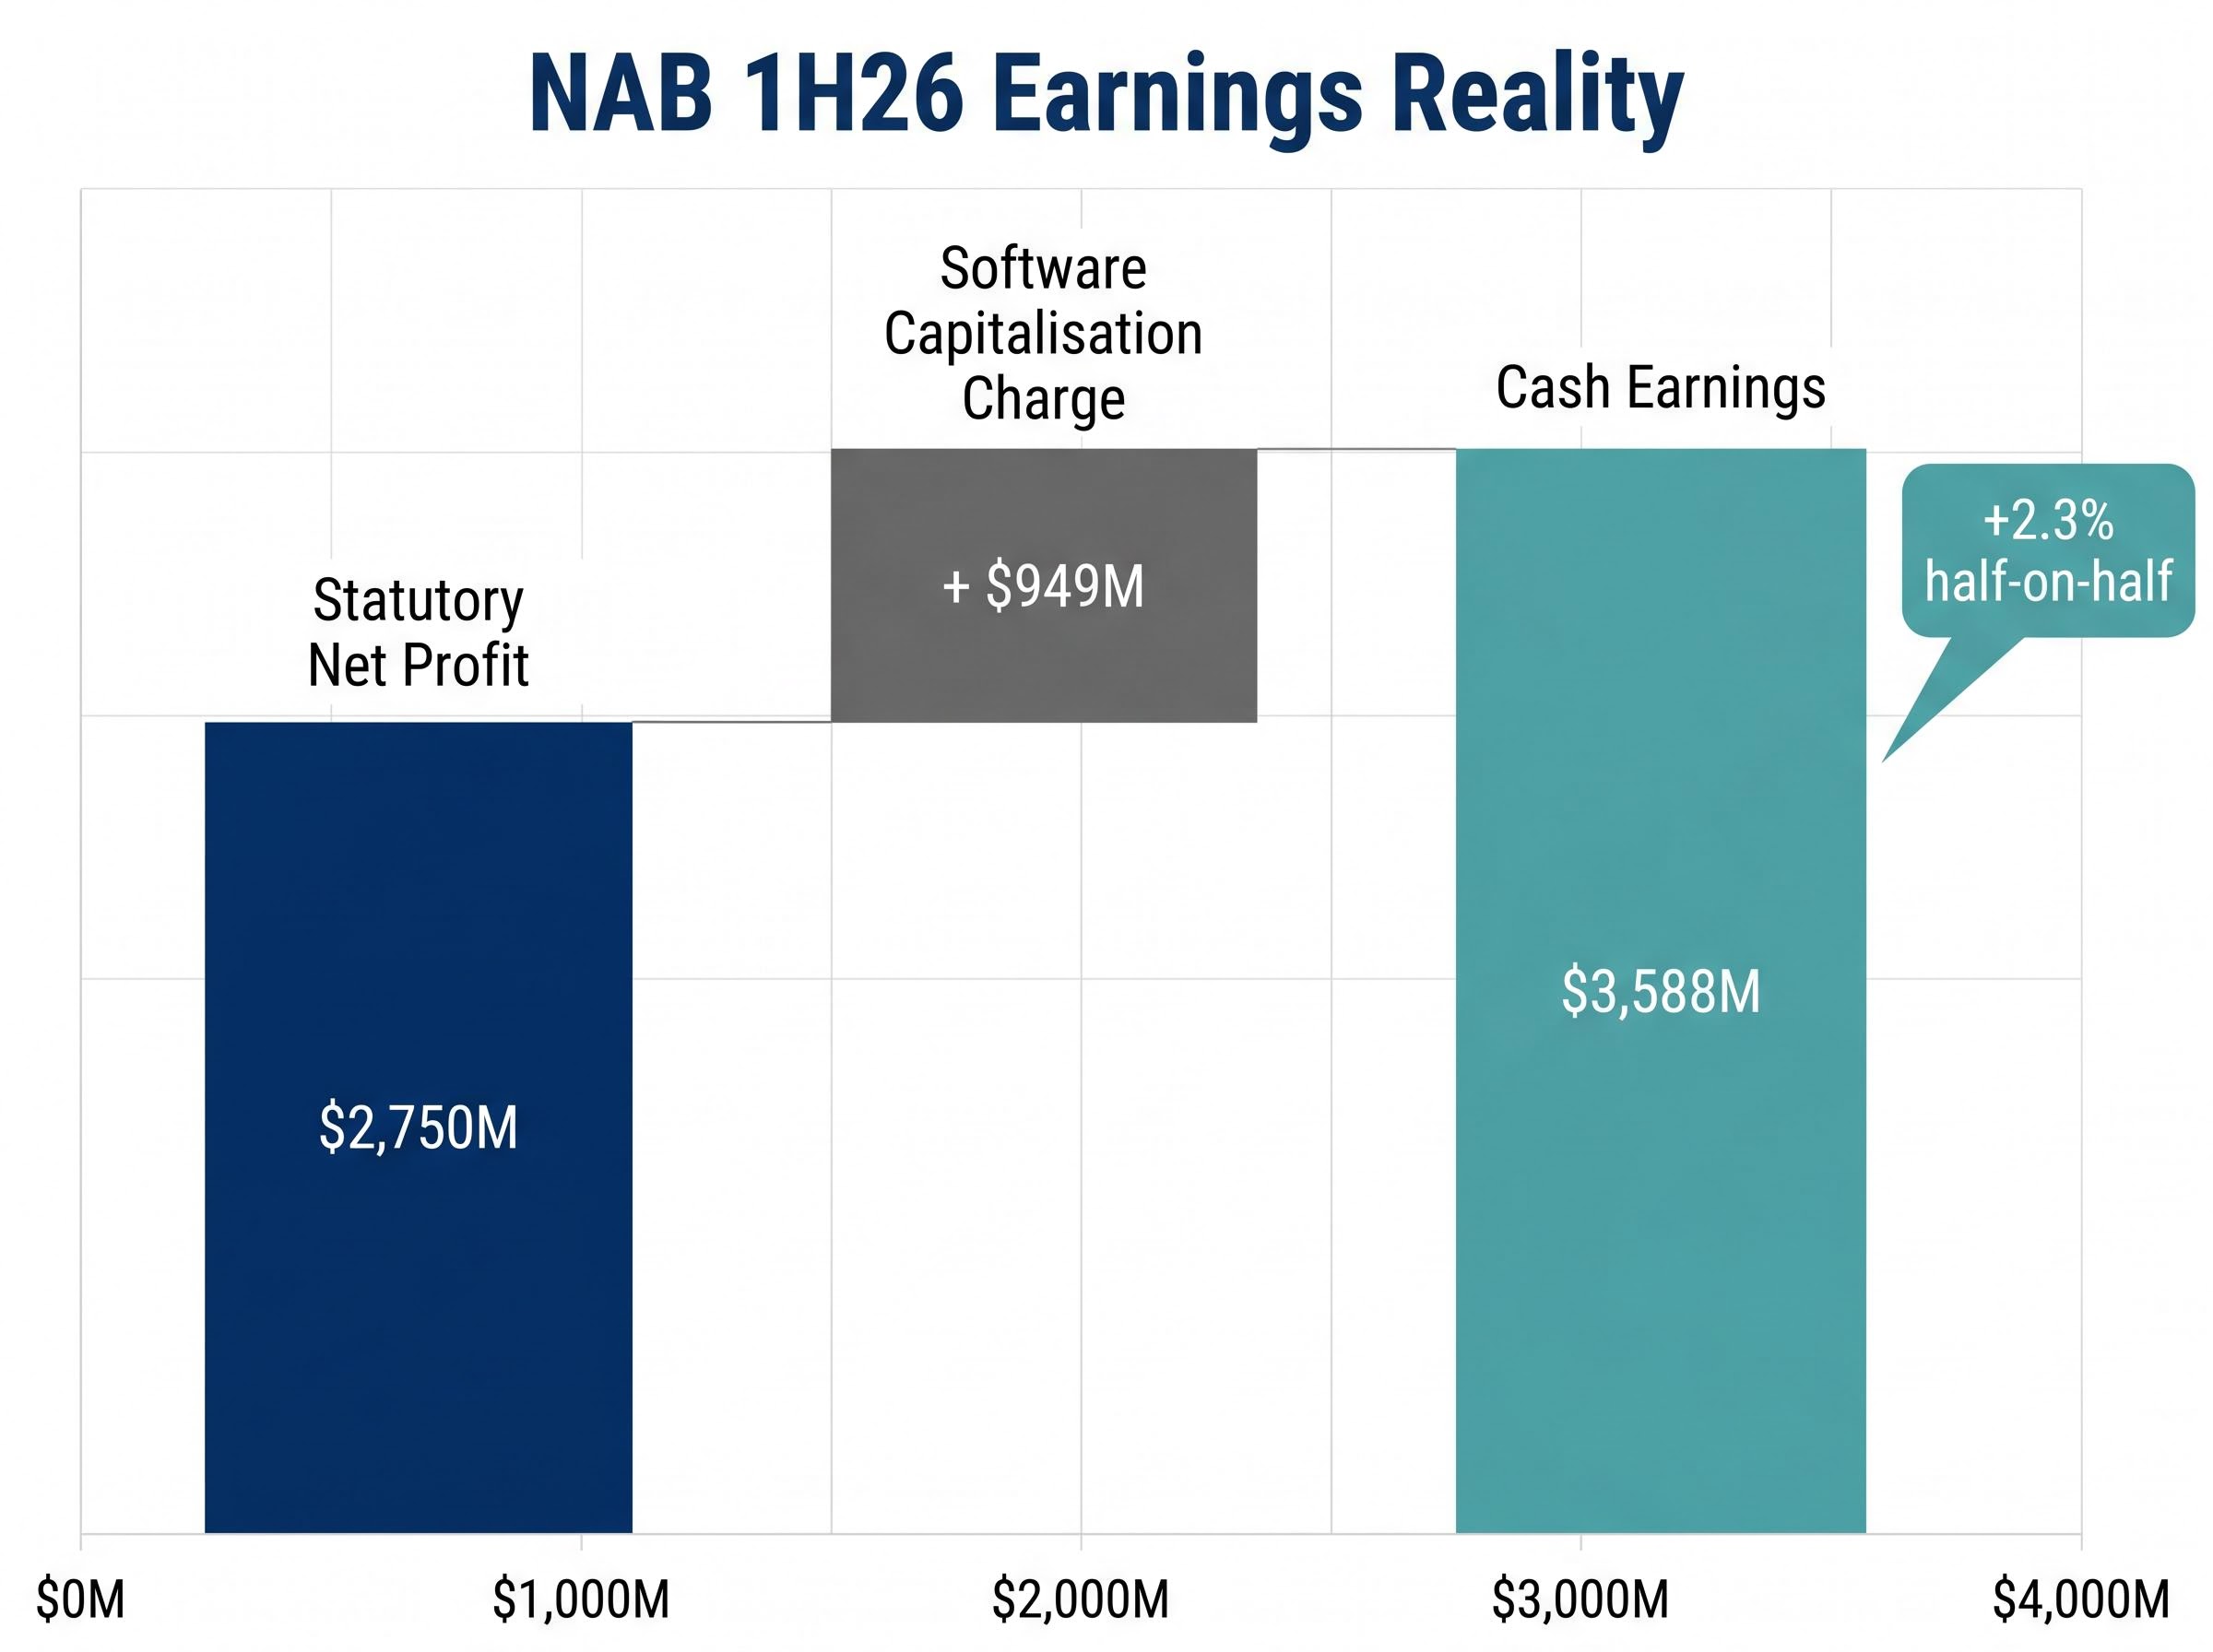
Key figure: The $949 million software capitalisation policy charge was treated as a large notable item, depressing reported cash earnings by the same amount while leaving underlying operating performance untouched.
Strip the charge out and cash earnings reached $3,588 million, up 2.3% on the prior half. Underlying profit growth excluding large notable items came in at 6.4%. The gap between the statutory number and the operating number is unusually wide this half, and the table below makes that distortion visible.
| Metric | 1H26 | 2H25 |
|---|---|---|
| Statutory net profit | $2,750M | Higher base (pre-charge) |
| Cash earnings (excl. large notable items) | $3,588M | $3,507M |
| Half-on-half change (cash earnings) | +2.3% | |
The 18% statutory decline is technically accurate. It is also analytically misleading without this context.
Business and Private Banking (B&PB) delivered the standout divisional result. Cash earnings rose 9.9% to $1.85 billion compared with the prior corresponding period, and 5.4% on a half-on-half basis. For a division of this scale, those are growth rates that matter.
The performance reinforces NAB’s deliberate strategic positioning. Where peers lean heavily on mortgage books, NAB has built its competitive identity around business and SME lending. Business lending grew 5.6% in the half, and the pipeline suggests that positioning is attracting market share rather than merely riding the cycle.
A secondary positive emerged in home lending. Proprietary drawdowns, the share of home loans originated through NAB’s own channels rather than through brokers, improved from 41.4% in 2H25 to 47.7% in 1H26. That shift matters for margin and for customer ownership over time.
Key divisional metrics at a glance:
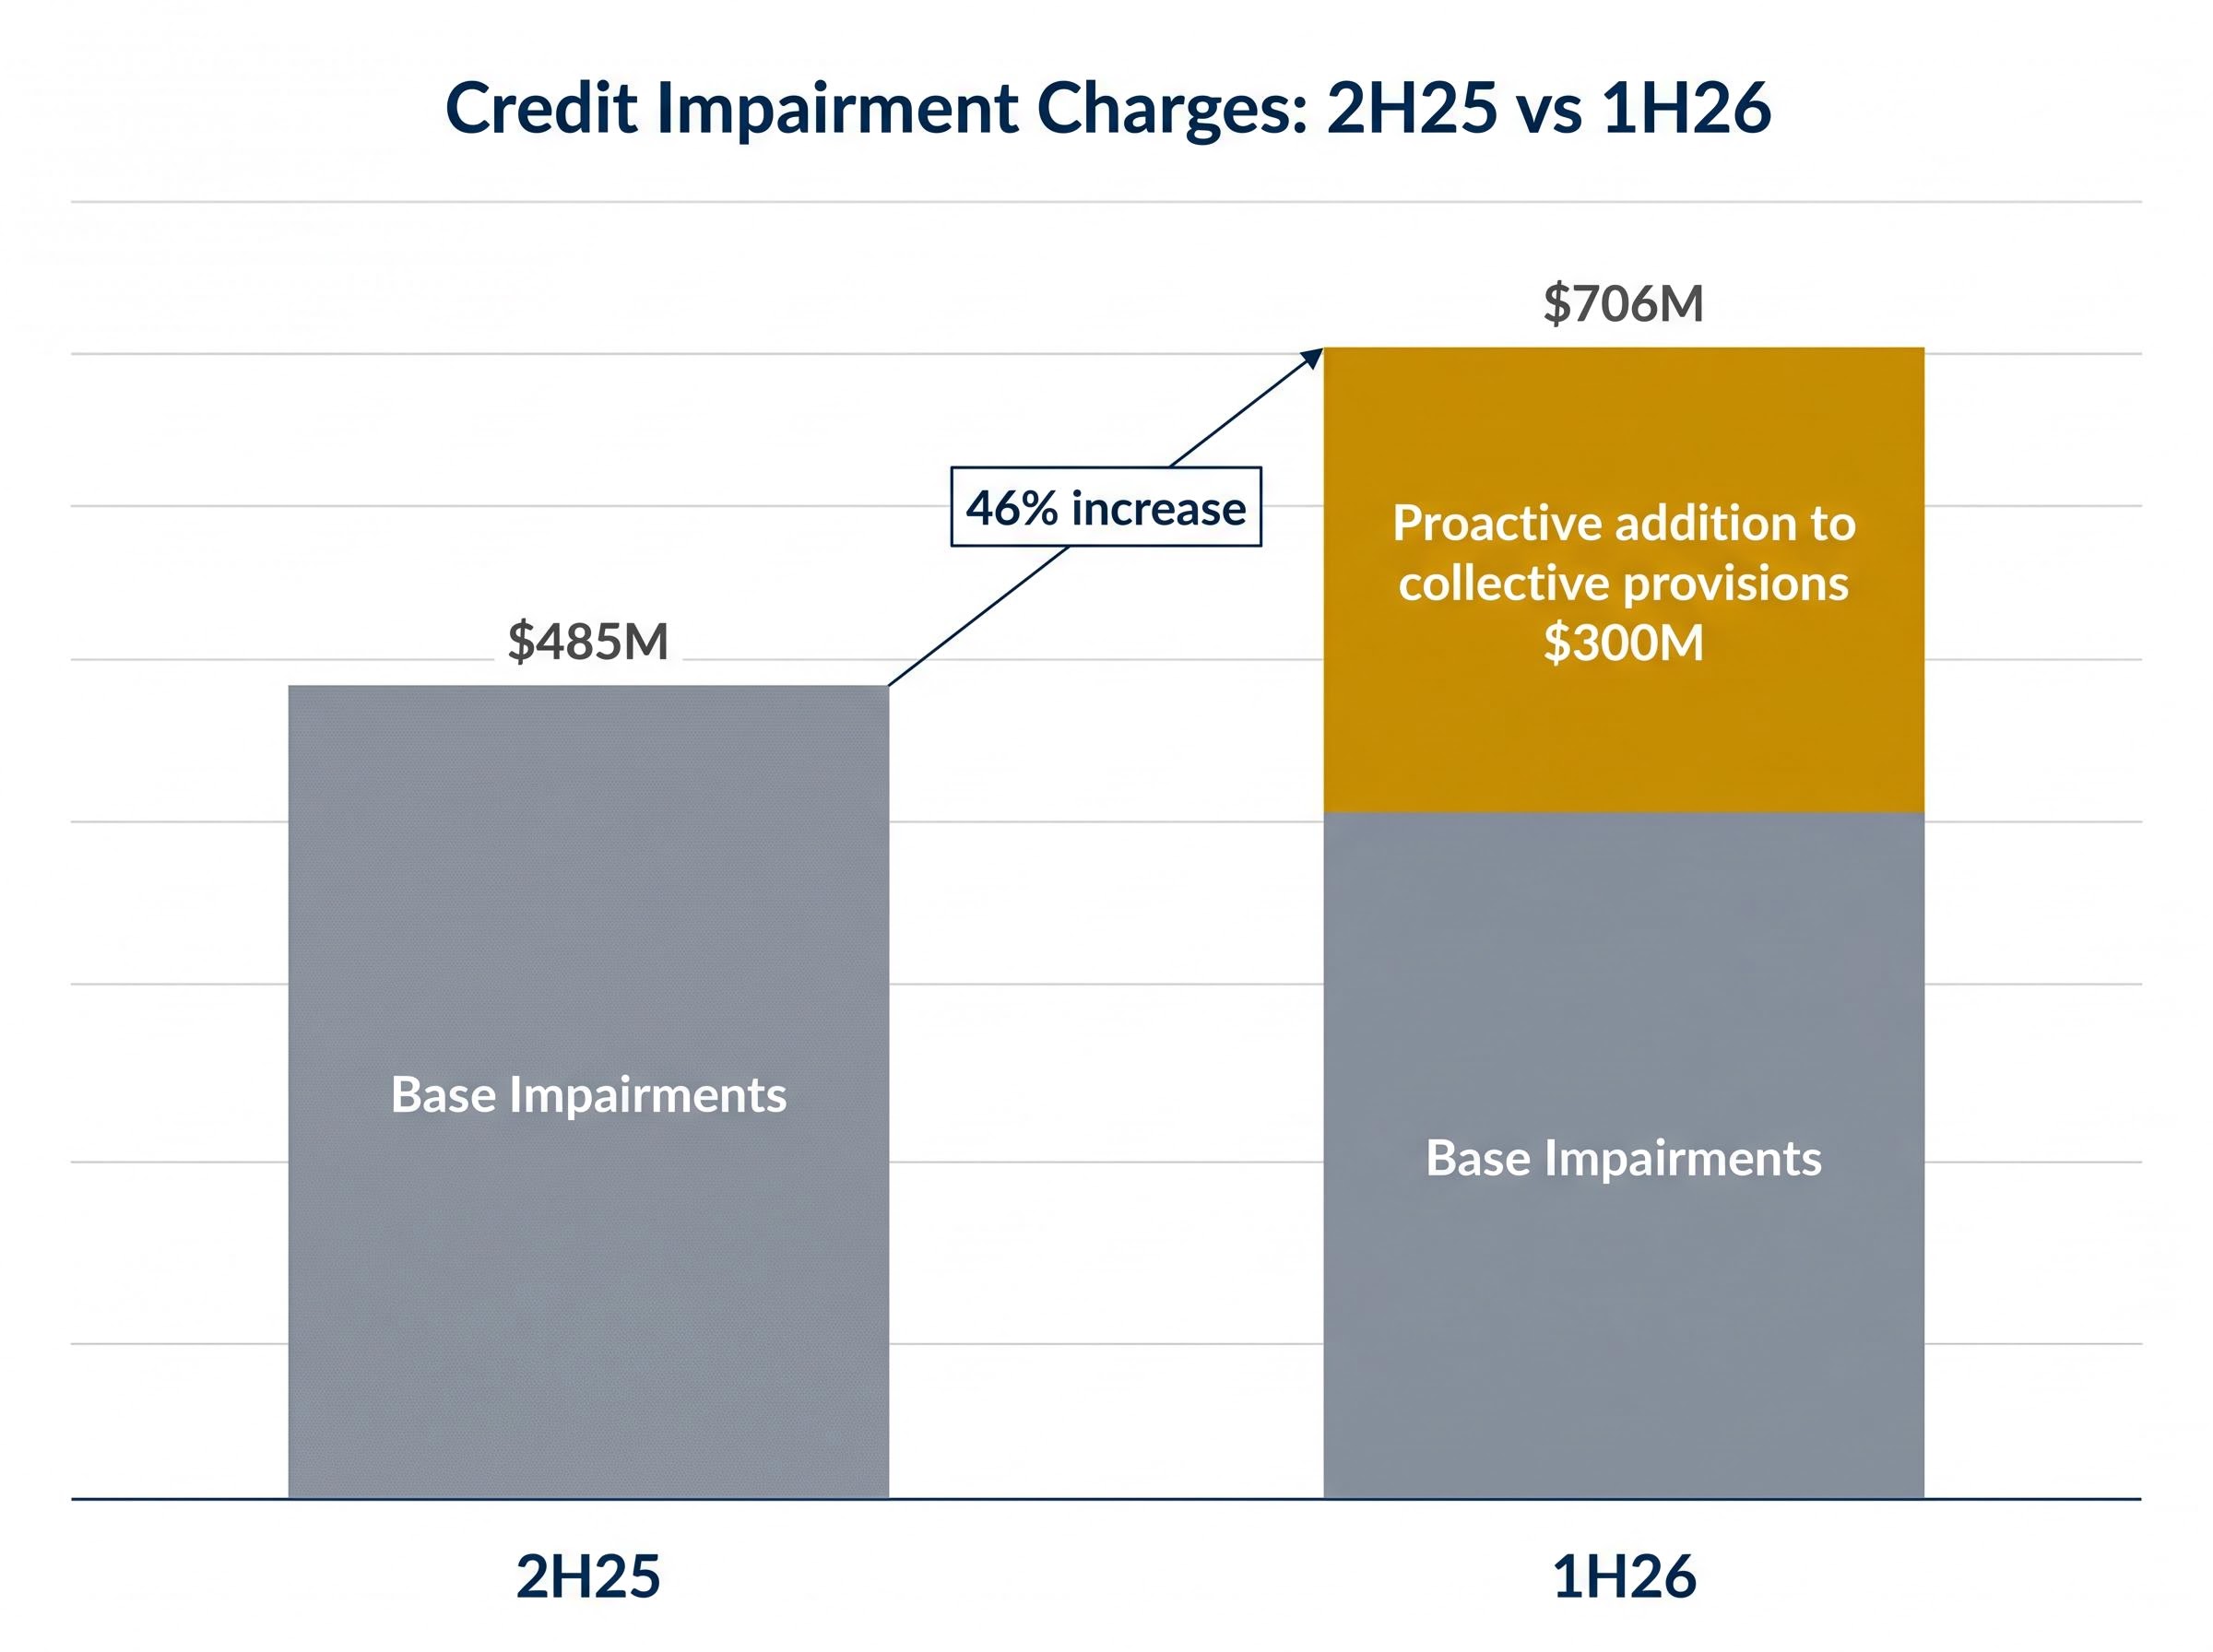
Credit impairment charges rose from $485 million in 2H25 to $706 million in 1H26. On the surface, that is a 46% increase, and it would be easy to read it as a deterioration signal.
The detail tells a more measured story. Of the total charge, $300 million reflected a proactive addition to collective provisions, a forward-looking buffer built against anticipated risks rather than a response to loans already in distress. NAB cited geopolitical uncertainty, cost pressures, and broader economic volatility as the drivers for the build. Management framed the addition as balance sheet strengthening, not a reaction to arrears climbing through internal thresholds.
The RBA Financial Stability Review for March 2026 identified geopolitical uncertainty and cost pressures on households and businesses as active risks to the domestic credit environment, providing the macro context that informed NAB’s decision to build forward-looking collective provisions rather than wait for arrears to materialise.
CEO Andrew Irvine stated: “We are well placed to navigate a period of increased volatility.”
The distinction between proactive and reactive provisioning is not academic. If credit charges continue rising in 2H26 and the composition shifts toward specific provisions on individual loans rather than collective buffers, the interpretation changes. For now, the $300 million build reads as conservatism. Whether it remains conservatism or becomes foresight depends on what the Australian economy delivers over the next six months.
Sector-wide provisioning forecasts from Morgans project total Big Four bank provisions rising from approximately $2.4 billion in FY25 to approximately $5.5 billion by FY27, which frames NAB’s $300 million collective provision build not as an isolated management decision but as part of a broader credit cycle inflection that analysts were already pricing into their target assumptions before the May results season began.
Australian banks report two headline profit figures each half, and they can tell very different stories. This half is a clear example: statutory net profit came in at $2,750 million, while cash earnings excluding large notable items reached $3,588 million. The difference, $838 million on a pre-tax-adjusted basis, almost entirely reflects the software capitalisation charge.
Statutory net profit captures everything, including one-off charges, accounting policy changes, and non-cash adjustments that may not recur. Cash earnings strip those items out to show the recurring operational performance of the bank. Large notable items are disclosed transparently and are standard practice across the Australian banking sector for investor communication.
The reconciliation follows three steps:
For investors assessing whether NAB’s operating business is growing or shrinking, the cash earnings figure is the one that answers the question. The statutory number carries legal and accounting completeness, but the cash earnings figure carries the analytical signal.
NAB held its interim dividend at 85 cents per share, fully franked, unchanged from prior periods. The dividend reinvestment plan remains in place, discounted and partially underwritten.
Capital ratios reinforced the stability signal. The Common Equity Tier 1 (CET1) ratio, the measure of a bank’s core capital relative to its risk-weighted assets, stood at 11.65% at the end of March 2026, comfortably above regulatory minimums. On a pro forma basis incorporating the expected participation in the dividend reinvestment plan, the ratio rises to 12.05%.
On expenses, NAB guided to FY26 cost growth of below 4.6%, with productivity benefits targeted at above $450 million for the full year.
| Metric | 1H26 / FY26 Guidance |
|---|---|
| Interim dividend | 85 cps, fully franked |
| CET1 ratio | 11.65% |
| CET1 pro forma (post-DRP) | 12.05% |
| FY26 cost growth guidance | Below 4.6% |
| FY26 productivity benefits target | Above $450M |
For income-focused investors unsettled by the headline profit decline, the unchanged dividend and strengthening capital position offer direct reassurance.
NAB shares closed at approximately $39.36 on results day, down roughly 1%. Over the prior 12 months to late April 2026, the stock had risen approximately 26%, comfortably ahead of the S&P/ASX 200’s gain of approximately 14% over the same period. That outperformance has compressed the margin of safety available to new buyers.
Stock selection within the sector has carried more weight than broad sector allocation in 2026, with a 10.5 percentage point spread between CBA’s monthly gain and NAB’s monthly decline illustrating that passive exposure to ASX financials has told a very different story from active positioning in individual names.
The bull and bear cases sit in genuine tension:
Reasons for existing shareholders to hold:
Reasons for caution at current prices:
For existing holders, the franchise quality and reliable income stream support patience. For prospective buyers, the entry point is less compelling than it was 12 months ago, and selectivity is warranted.
For investors wanting to understand the analyst framework behind current price targets in more depth, our full explainer on Big Four bank valuations examines the price-to-earnings compression argument in detail, including how NAB’s current trading multiple compares to its historical average and to global peers, and why Morgans models negative total shareholder returns even after accounting for fully franked dividend income.
The underlying result was solid. Cash earnings grew, business banking extended its run of outperformance, and the 18% statutory profit decline was an accounting artefact rather than an operational warning. The balance sheet is stronger than it was six months ago, and the dividend is unchanged.
The forward questions are harder. Whether the $300 million proactive provisions build proves conservative or prescient depends on how geopolitical and inflationary pressures flow through to Australian borrowers in the second half. Whether NAB’s valuation premium over peers remains justified depends on whether business banking momentum sustains at this pace.
Fuller analyst commentary, including broker updates and institutional research, was expected from 5 May 2026 onward. The 2H26 result will be the next major data point.
This article is for informational purposes only and should not be considered financial advice. Investors should conduct their own research and consult with financial professionals before making investment decisions. Past performance does not guarantee future results.
NAB reported statutory net profit of $2,750 million for 1H26, down 18% on the prior period, but cash earnings excluding large notable items reached $3,588 million, up 2.3% half on half, with the gap almost entirely explained by a $949 million software capitalisation policy charge.
The 18% decline in statutory profit was caused by a single $949 million after-tax charge related to a change in software capitalisation accounting policy, not by deterioration in the bank's operating business.
Statutory net profit includes all one-off charges and accounting policy changes, while cash earnings strip out large notable items to show recurring operational performance; in 1H26, the two figures differed by approximately $838 million due to the software capitalisation charge.
NAB held its interim dividend at 85 cents per share, fully franked, unchanged from prior periods, supported by a CET1 capital ratio of 11.65% and a pro forma ratio of 12.05% after the dividend reinvestment plan.
Credit impairment charges rose from $485 million in 2H25 to $706 million in 1H26, but $300 million of that increase reflected a proactive collective provision build against anticipated economic risks rather than loans already in distress, which management described as a balance sheet strengthening measure.