GQG Partners: the Cost of Calling an AI Bubble Too Early
1 hr ago

The Brent crude price sits near $108 per barrel in early May 2026, a figure that dominates every financial headline and energy market summary. Yet that number tells less than half the story. Buyers in Asia are paying vastly higher prices for the same commodity delivered to their shores, with regional benchmarks reflecting a supply reality that the global headline obscures.
The Strait of Hormuz closure that began on 28 February 2026 has eliminated more than 15% of global oil supply, the largest single supply disruption in oil market history according to Yardeni Research. Six distinct mitigation factors have kept headline Brent in a comparatively restrained range, creating a widening gap between what benchmark watchers see and what Asian importers actually pay. What follows is an analysis of why that gap exists, what forces are holding the global benchmark down, and what the regional pricing split means for investors, importers, and anyone using headline oil prices to evaluate energy market risk.
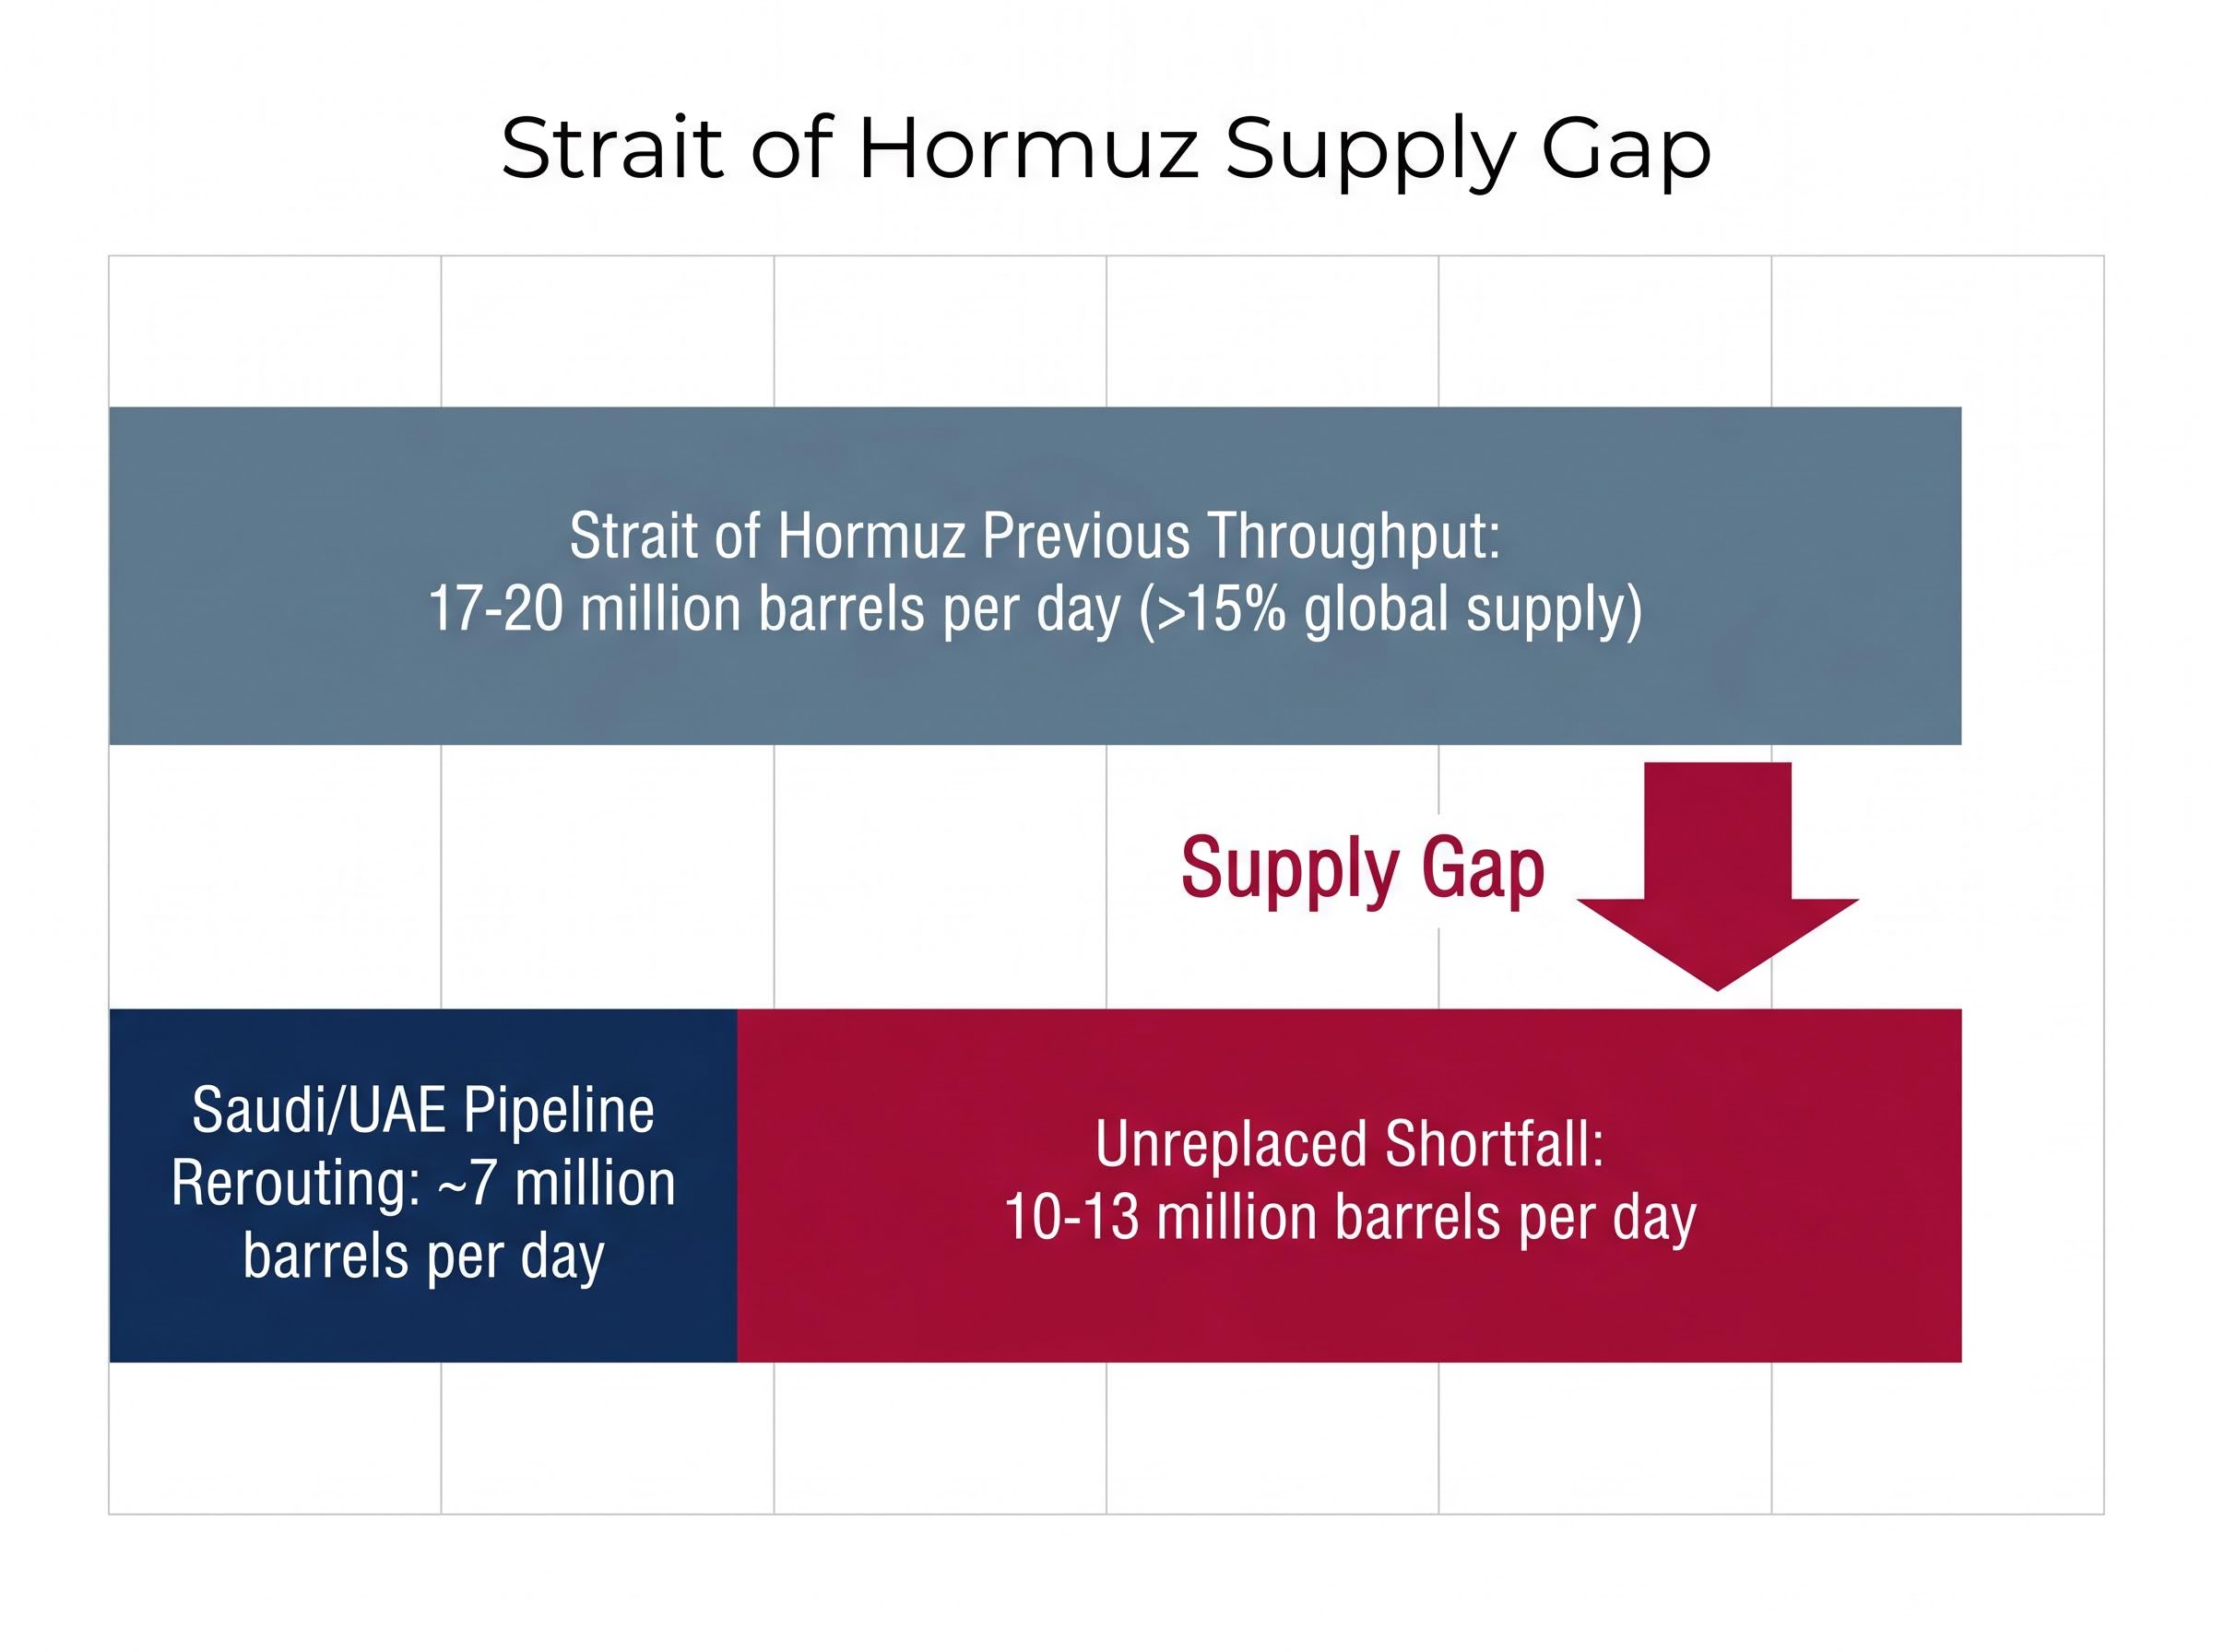
The scale of the disruption is difficult to overstate. The Strait of Hormuz previously handled 17-20 million barrels per day of crude oil transit. Its closure removed more than 15% of global supply from the market in a single event.
Yardeni Research has characterised the Strait of Hormuz closure as the largest supply disruption the oil market has ever experienced, exceeding the 1973 Arab oil embargo and the 1979 Iranian Revolution in absolute volume terms.
Before the closure, some forecasters had projected Brent would reach $150-$200 per barrel in a Hormuz shutdown scenario. The actual outcome has been starkly different:
The gap between expectation and outcome is the analytical puzzle at the centre of this crisis. Investors anchored to the 1973 or 1979 playbook, where supply shocks produced immediate, sustained price surges, would have been badly positioned for what actually happened.
The Hormuz closure price spike on 30 April 2026 saw Brent reach an intraday high above $125 before closing at $111.88, a single-session compression that reflected traders simultaneously pricing conflicting diplomatic signals and the raw scale of 13 million barrels per day removed from global circulation.
Oil futures are trading in steep backwardation, with near-term contracts priced above longer-dated ones. This structure reflects a market that reads the disruption as temporary rather than permanent. Traders are pricing in an expectation that supply routes will reopen within a foreseeable horizon.
Backwardation also functions as a self-reinforcing modulator. When near-term prices sit above forward prices, it discourages strategic hoarding and accelerates inventory drawdowns, effectively pulling supply forward into the present market rather than locking it away.
Six factors, identified by Yardeni Research, have collectively suppressed the Brent price below where a disruption of this magnitude would otherwise place it. Each operates through a distinct mechanism, and their combination explains why the outcome surprised even experienced energy market participants.
| Mitigation Factor | Mechanism | Scale / Magnitude |
|---|---|---|
| Saudi/UAE pipeline rerouting | Alternative overland pipeline capacity bypassing the Strait | Approximately 7 million barrels per day combined capacity |
| Iranian oil waivers | Sanctions relief enabling continued Iranian crude exports via non-Hormuz routes | Partial offset; exact volume varies by waiver terms |
| Russian oil waivers | Continued Russian crude flows under revised sanctions frameworks | Supplementary non-Gulf supply source |
| IEA strategic reserve releases | Coordinated drawdown of emergency stockpiles by IEA member nations | Finite buffer; pace of release is the variable to monitor |
| Chinese stockpile resales | China releasing previously accumulated crude inventories onto the market | One-time buffer; volume dependent on stockpile depth |
| Accelerating demand reduction | Economic slowdown and energy efficiency gains reducing consumption | IEA projects 80,000 barrels per day demand contraction for full-year 2026 |
The supply-side offsets are substantial but incomplete. Saudi Arabia and the UAE can reroute approximately 7 million barrels per day through alternative pipelines, but the Strait previously handled 17-20 million barrels per day. Even with full pipeline utilisation, approximately 10-13 million barrels per day of the Strait’s previous throughput remains unreplaced.
The supply offset arithmetic becomes harder to close when the maritime insurance withdrawal layer is factored in: commercial war risk insurers have near-totally withdrawn coverage from the Strait, meaning that even if physical transit corridors partially reopen, the absence of insurable routes limits the pace at which tanker operators can resume normal operations.
The apparently restrained Brent price is not a sign that the disruption is minor. It is a sign that an extraordinary number of emergency mechanisms are operating simultaneously.
The IEA Oil Market Report for April 2026 confirms the 80,000 barrels per day demand contraction projection while documenting the coordinated strategic reserve release program as the primary near-term supply buffer, underscoring that the finite nature of those reserves is the central variable determining how long the Brent price can remain insulated from the full scale of the disruption.
The global economy uses considerably less energy per unit of output than it did during the oil shocks of the 1970s. This structural decline in energy intensity provides a baseline moderator that did not exist during previous disruptions.
The IEA projects global oil consumption will shrink by 80,000 barrels per day across full-year 2026. That figure, however, reflects real economic pain rather than efficient substitution. Demand destruction at this scale means factories producing less, airlines cutting routes, and shipping operators absorbing costs that compress margins.
While Brent prices North Sea and Atlantic Basin supply, Dubai crude serves as the reference benchmark for oil delivered into Asia. The two benchmarks measure different things, and in May 2026, they are telling radically different stories.
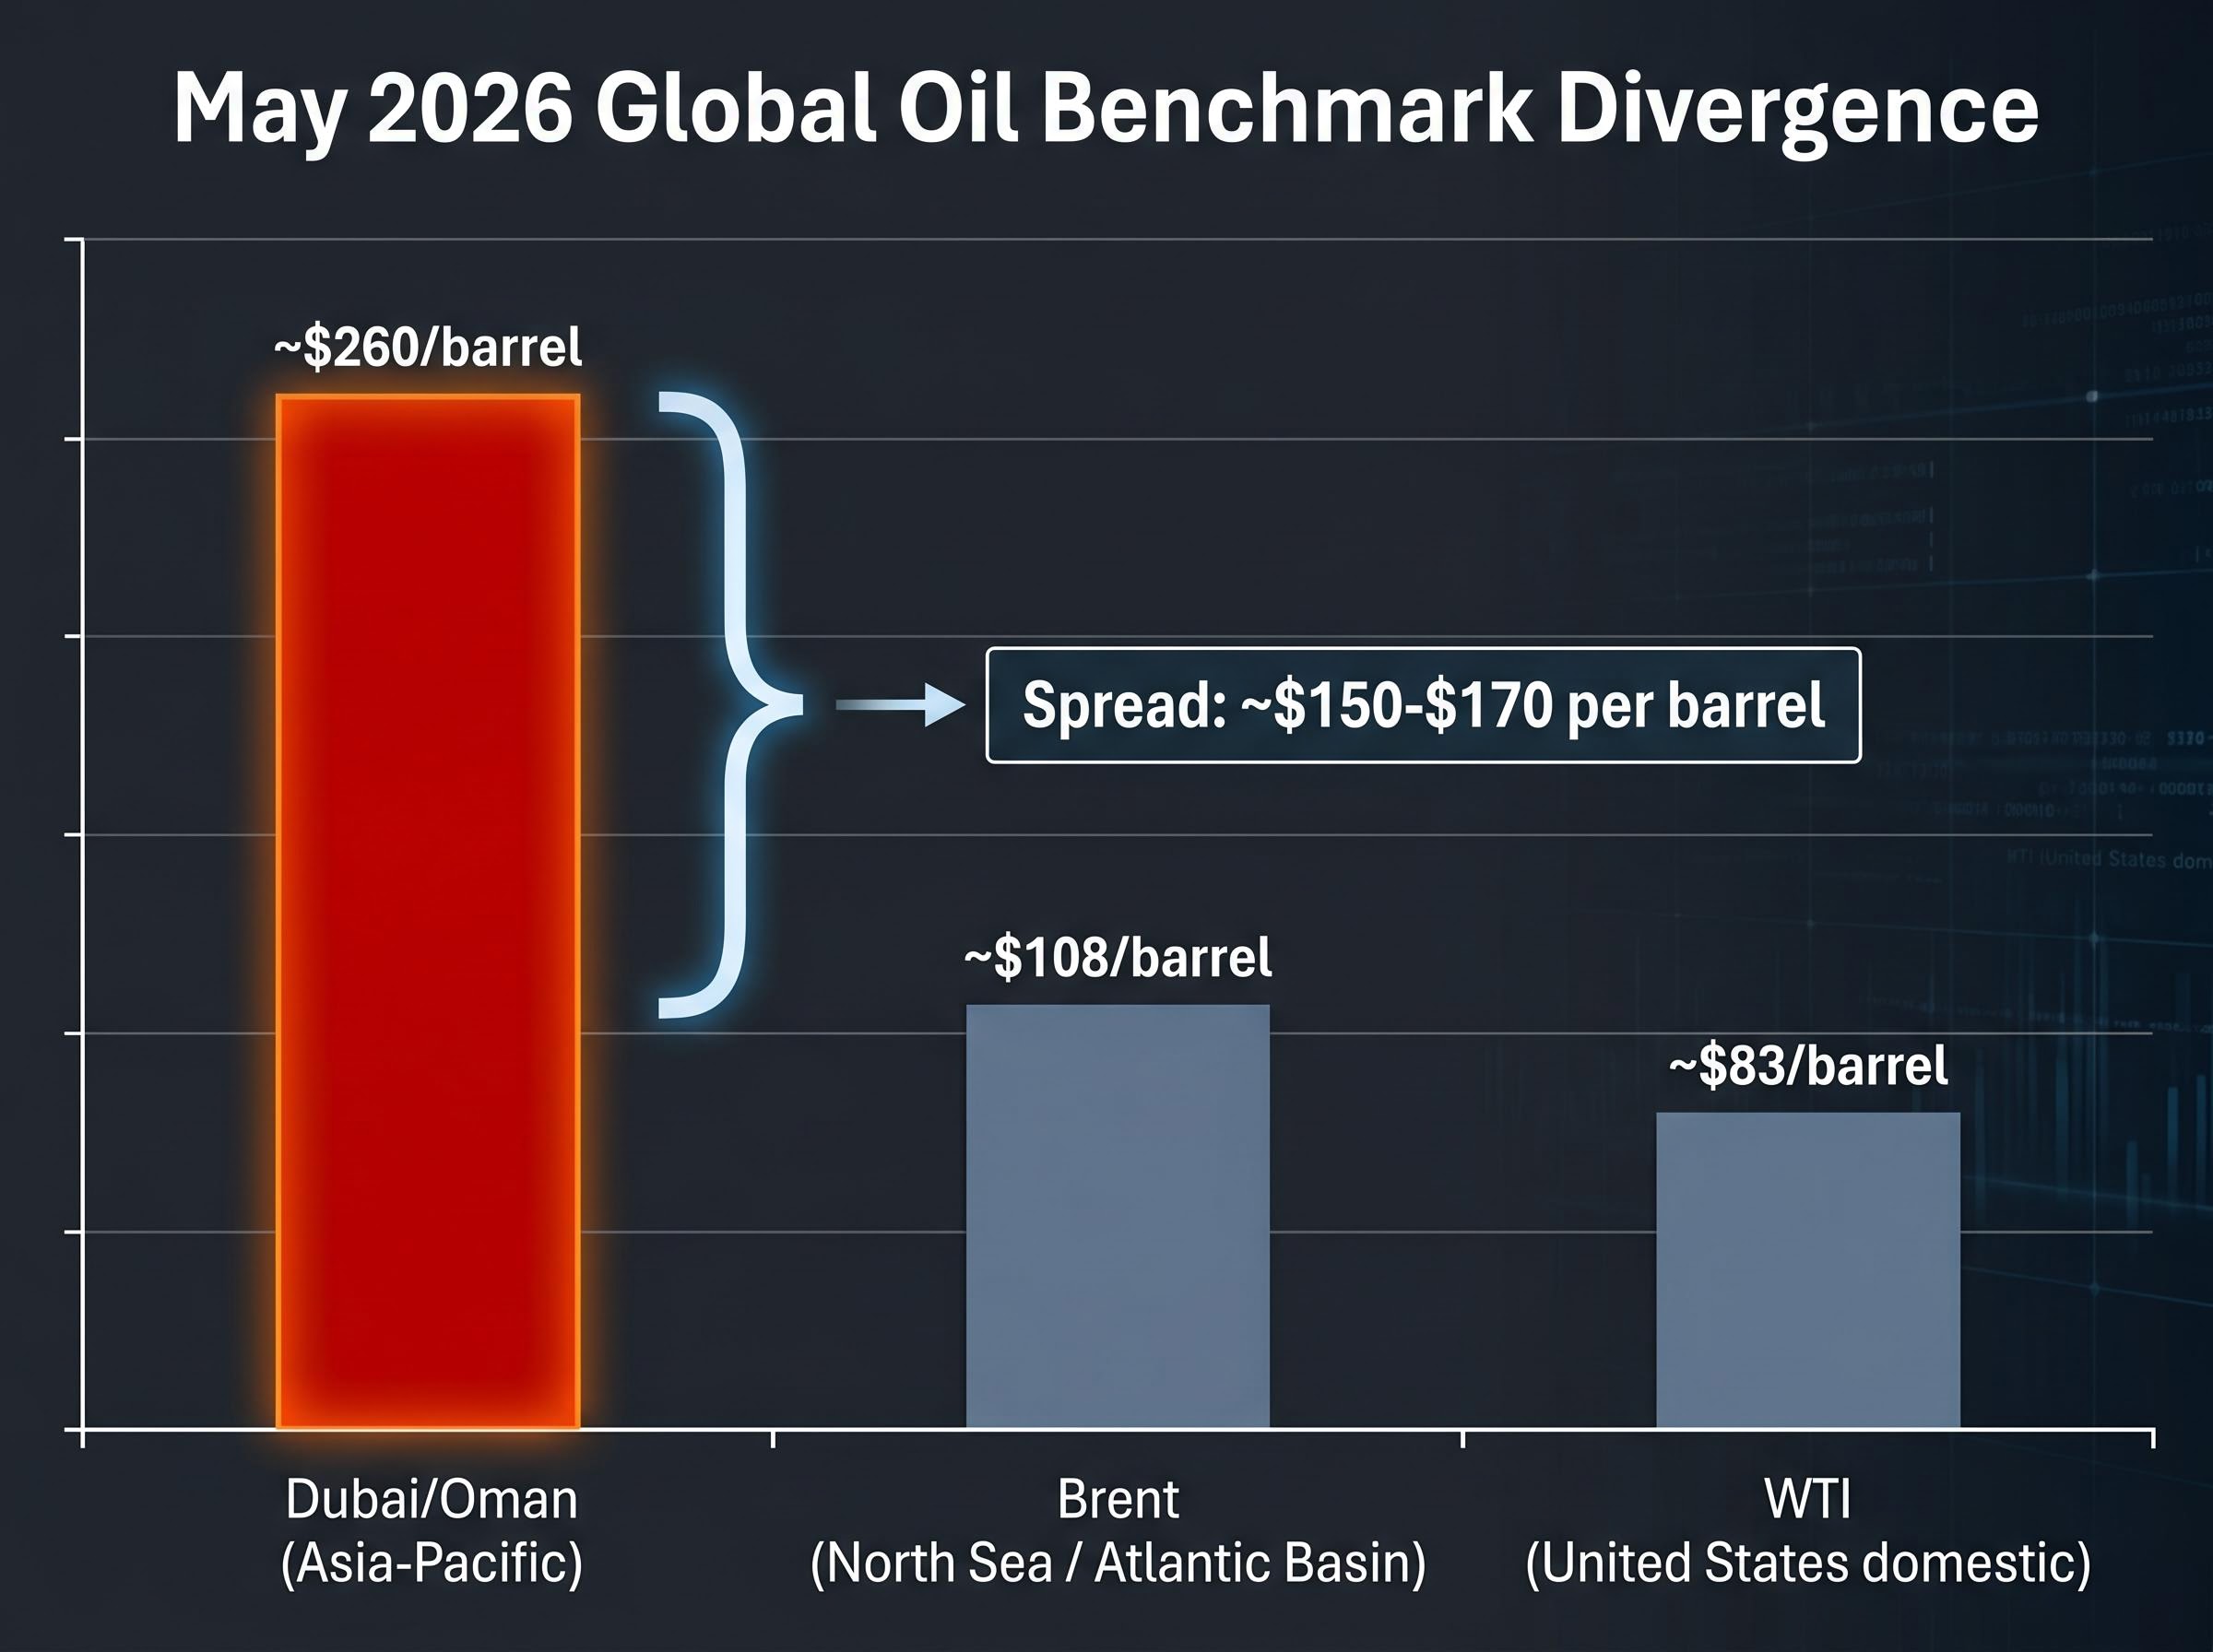
According to Yardeni Research, Dubai crude reached a peak price of approximately $260 per barrel as of early May 2026, representing the most extreme regional benchmark divergence in modern oil market history. Direct sourcing from S&P Global Platts or ICE is recommended to verify this figure.
The mechanism is specific. The Hormuz closure has severed the primary supply artery for Gulf crude reaching Asian buyers. With reduced physical supply available for Asian delivery, Japanese, South Korean, Indian, and Chinese refiners are bidding up the regional benchmark independently of the global one. These economies lack domestic production sufficient to offset their import dependency.
| Benchmark | Region Served | May 2026 Price | Role in Global Pricing |
|---|---|---|---|
| Brent | North Sea / Atlantic Basin | ~$108/barrel | Reference for approximately two-thirds of globally traded crude contracts |
| WTI | United States (domestic) | ~$83/barrel | US domestic benchmark; insulated from Hormuz disruption |
| Dubai/Oman | Asia-Pacific | ~$260/barrel (peak; see note below) | Asia-Pacific benchmark; directly exposed to Gulf supply chain disruption |
Note: The Dubai crude peak price figure requires verification against primary sources such as S&P Global Platts or ICE. Investors should consult these sources directly before relying on this figure for analysis.
The implied Brent-Dubai spread at the peak sits at approximately $150-$170 per barrel above Brent. Historically, Dubai crude has traded at a modest discount to Brent, making the current inversion structurally unprecedented. For context, the Brent-WTI spread peaked at approximately $25 per barrel on 31 March 2026 (confirmed by EIA data), itself a historically extreme reading. The Dubai divergence dwarfs it.
Downstream effects are already visible. The UAE announced a domestic fuel price increase of approximately 10% for May 2026, with Super 98 petrol rising to approximately Dh4.15 per litre.
For any investor, analyst, or corporate treasurer using Brent as a proxy for Asian energy costs, the $260 per barrel Dubai figure represents a 140-170% premium over the benchmark, a discrepancy that invalidates cost models, refiner margin estimates, and trade deficit projections built on Brent alone.
Brent, WTI, and Dubai crude are not interchangeable price signals. Each reflects a distinct regional supply-demand balance, quality differential, and logistics cost structure. Understanding this architecture is the prerequisite for interpreting any oil price headline accurately.
The current price divergence, with Dubai at $260, Brent near $108, and WTI around $83, is the most extreme three-way benchmark spread on record. Historically, Dubai traded at a slight discount to Brent. The inversion to a $150+ premium is without precedent.
A geopolitical risk premium is the additional cost embedded in an oil price above its fundamental supply-demand value, reflecting the probability of further disruption. In 2026, this premium is not distributing evenly across all crude benchmarks. It is concentrating in the benchmarks with direct physical exposure to the conflict zone.
WTI carries the smallest premium because US supply chains face no physical threat from the Hormuz closure. Brent carries a moderate premium as an internationally traded benchmark. Dubai carries the largest premium because the crude it prices must physically transit or originate near the disrupted zone. The Brent-WTI spread peak of approximately $25 per barrel on 31 March 2026 illustrates the principle at the Atlantic Basin level; the Brent-Dubai spread at $150+ illustrates it at the Asia-Pacific level.
Analyst forecasts for the balance of 2026 have converged around a range that sits well above pre-conflict levels but below the most extreme disruption scenarios.
| Institution | 2026 Brent Forecast | Date of Forecast |
|---|---|---|
| Yardeni Research | $85-$100/barrel | April-May 2026 |
| Barclays | $100/barrel | 27 April 2026 |
| Morgan Stanley | $110/barrel (Q2 2026) | April 2026 |
| Reuters poll consensus | $86.38/barrel (2026 average) | April 2026 |
Yardeni Research’s $85-$100 per barrel forecast for the balance of 2026 sits near the lower end of the institutional range. The firm’s assessment that rate hikes remain off the table rests on a specific set of conditions rather than a simple oil-price-to-rates relationship: long-term inflation expectations must remain anchored, and no wage-price spiral can emerge.
The institutional forecast divergence on year-end Brent is itself a price signal worth reading: Goldman Sachs and JPMorgan sit approximately $30 apart in their projections, a gap that reflects a genuine disagreement about whether the supply disruption is a temporary dislocation or a multi-quarter structural feature, not merely a difference in model assumptions.
Brent opened 2026 at approximately $61 per barrel. Even the most conservative forecast in the current range implies a sustained 40%+ elevation above the pre-conflict baseline. The question for fixed-income and equity investors is whether that elevation triggers second-round inflation transmission through energy into core consumer prices.
The specific conditions that would challenge the no-rate-hike view:
Yardeni’s framing gives investors a set of observable triggers to monitor rather than a binary oil-price-to-rates equation.
The $260 per barrel Dubai crude figure against Brent near $108 is not a data curiosity. It represents a systematic distortion in three specific categories of investment analysis.
Asian refiner margin models built on Brent as an input cost proxy are materially understating feedstock costs. Sovereign current account projections for Japan, South Korea, and India, all of which are major crude importers, are underestimating import bills by a factor that could reach 140-170% depending on the benchmark used. Energy sector earnings estimates for companies with Asia-Pacific refining or distribution exposure are working from the wrong input price.
The six mitigation factors holding Brent down are themselves an investment risk. Each one, whether IEA reserve releases, Chinese stockpile resales, or demand destruction, represents a one-time or finite buffer. Their exhaustion would produce a second price leg up, concentrated in Asian benchmarks rather than in Brent.
Headline Brent prices are currently a systematic undercount of the oil price shock hitting Asia. Any analysis that treats the global benchmark as a universal proxy for energy cost exposure is working from an incomplete instrument.
A three-step monitoring framework for investors:
Detailed data on Asian refiner margins and import bill impacts requires sourcing from Bloomberg, Refinitiv, or Wood Mackenzie; investors should seek these primary sources for portfolio-specific exposure assessment.
The Brent-Dubai divergence at current extremes is not a permanent new structure. It resolves through one of two mechanisms, and the macro implications of each are fundamentally different.
The forward-looking signal to watch is the futures curve structure in Dubai crude. The steep backwardation introduced in the first section of this analysis reflects market confidence in short-term resolution. If that backwardation begins to flatten or invert into contango (where longer-dated contracts price above near-term ones), the market is repricing the Hormuz disruption from temporary to structural. That shift would require reassessment of the entire $85-$100 Brent forecast range and the rate-hike-off-the-table positioning that depends on it.
For investors wanting to model the specific mechanics and sequencing of the resolution scenario, our full explainer on the supply route restoration timeline walks through Project Freedom’s naval escort structure, the insurance reinstatement requirements that must follow any ceasefire, and why analysts estimate a minimum six-month normalisation window even after physical transit resumes.
Investors using only headline Brent have been watching one instrument in a three-instrument story. The Brent-Dubai spread, and the futures curve shape beneath it, are where the next phase of this crisis will be priced first.
This article is for informational purposes only and should not be considered financial advice. Investors should conduct their own research and consult with financial professionals before making investment decisions. Financial projections referenced in this analysis are subject to market conditions and various risk factors. Past performance does not guarantee future results.
Six mitigation factors have suppressed Brent below crisis-scenario forecasts: Saudi and UAE pipeline rerouting of approximately 7 million barrels per day, Iranian and Russian oil waivers, IEA strategic reserve releases, Chinese stockpile resales, and accelerating demand destruction totalling 80,000 barrels per day for full-year 2026.
Brent prices North Sea and Atlantic Basin supply and serves as the global headline benchmark, while Dubai crude is the reference price for oil delivered into Asia; in May 2026 they diverged to an unprecedented spread of approximately $150-$170 per barrel, with Dubai reaching a peak of around $260 against Brent near $108.
The closure severed the primary supply artery for Gulf crude reaching Asia, forcing Japanese, South Korean, Indian, and Chinese refiners to bid up the Dubai benchmark independently of global Brent, resulting in import costs running approximately 140-170% above what Brent-based cost models would suggest.
Institutional forecasts for 2026 Brent range from Yardeni Research at $85-$100 per barrel and a Reuters poll consensus of $86.38, up to Morgan Stanley at $110 for Q2 2026 and Barclays at $100, all representing a sustained 40% or more elevation above the pre-conflict January 2026 level of approximately $61.
Investors should track the Brent-Dubai spread directly rather than Brent alone, monitor the pace of IEA strategic reserve releases as the most visible finite buffer, and watch whether the Dubai crude futures curve shifts from backwardation into contango, which would signal the market repricing the disruption from temporary to structural.