The same mathematical ratio found in nautilus shells and sunflower spirals appears on trading screens every day, guiding entries and exits across the S&P 500, EUR/USD, and Bitcoin. Fibonacci retracements and extensions rank among the most widely used tools in technical analysis, spanning equities, forex, commodities, and crypto. Yet beginners routinely misapply them, drawing on insignificant swings, treating levels as exact prices, and acting without confirmation, undermining a tool that rewards discipline with consistency. This guide covers the mathematical foundation behind Fibonacci trading levels, how to draw them correctly, how to use retracements for entries and extensions for profit targets, which confluence factors separate high-probability setups from noise, and where the tool genuinely falls short.
The mathematical foundation that makes Fibonacci levels work
The Fibonacci sequence begins with a simple rule: add the two previous numbers to produce the next. The opening terms run 1, 1, 2, 3, 5, 8, 13, 21, 34, 55, and the pattern extends infinitely. What makes the sequence relevant to financial markets is not the numbers themselves but the ratios between them.
Dividing any number in the sequence by the one immediately following it converges toward 0.618. Dividing any number by the number two positions ahead approaches 0.382. These relationships produce the five retracement ratios that appear on every charting platform: 23.6%, 38.2%, 50%, 61.8%, and 78.6%.
“Dividing any Fibonacci number by the one immediately following it converges toward 0.618, the golden ratio that recurs across natural and market structures alike.”
The 61.8% level carries particular weight. It derives directly from the golden ratio, a proportion observed across biological growth patterns and physical structures. Its widespread recognition among traders creates self-reinforcing price behaviour: enough participants watch the same level that their collective activity can influence price action around it.
Journal of Behavioral Economics and Finance research on Fibonacci psychology confirms that collective pattern recognition and cognitive biases among market participants are primary drivers of the tool’s observed effectiveness, reinforcing why the 61.8% level commands outsized attention relative to other retracement ratios.
| Ratio | Derived From | Significance |
|---|---|---|
| 23.6% | Number divided by value three positions ahead | Shallow retracement; weak pullback signal |
| 38.2% | Number divided by value two positions ahead | Moderate pullback; first meaningful level |
| 50% | Midpoint (not a true Fibonacci ratio) | Widely watched psychological halfway point |
| 61.8% | Number divided by value one position ahead | The golden ratio; strongest retracement level |
| 78.6% | Square root of 0.618 | Deep retracement; last defence before invalidation |
Understanding where these ratios come from gives traders the conceptual grounding to apply them with intention. It also explains why the 61.8% level deserves more attention than the 23.6% level: the golden ratio is not an arbitrary line on a chart but a mathematical relationship that traders across every asset class have learned to respect.
When big ASX news breaks, our subscribers know first
How to draw Fibonacci retracements correctly from the start
Consistent drawing methodology is the single biggest difference between traders who get repeatable results from Fibonacci and those who dismiss it as unreliable. The process involves a series of concrete decisions, each one resolving a source of ambiguity.
- Identify the trend direction. Confirm higher highs and higher lows for an uptrend, or lower highs and lower lows for a downtrend. Without a clear trend, Fibonacci levels become meaningless.
- Locate the clearest swing high and swing low. These anchor points must be immediately visible on a 4-hour or daily chart without zooming in. If the swing requires magnification to identify, it is not significant enough.
- Anchor wick-to-wick. In an uptrend, drag the tool from the swing low to the swing high. In a downtrend, drag from the swing high to the swing low. Wick-to-wick (using the extreme price points including volatility spikes) is the standard professional approach.
- Confirm levels are visible on the 4-hour or daily timeframe. Levels derived from tiny swings on a 5-minute chart will not carry the structural weight needed for reliable setups.
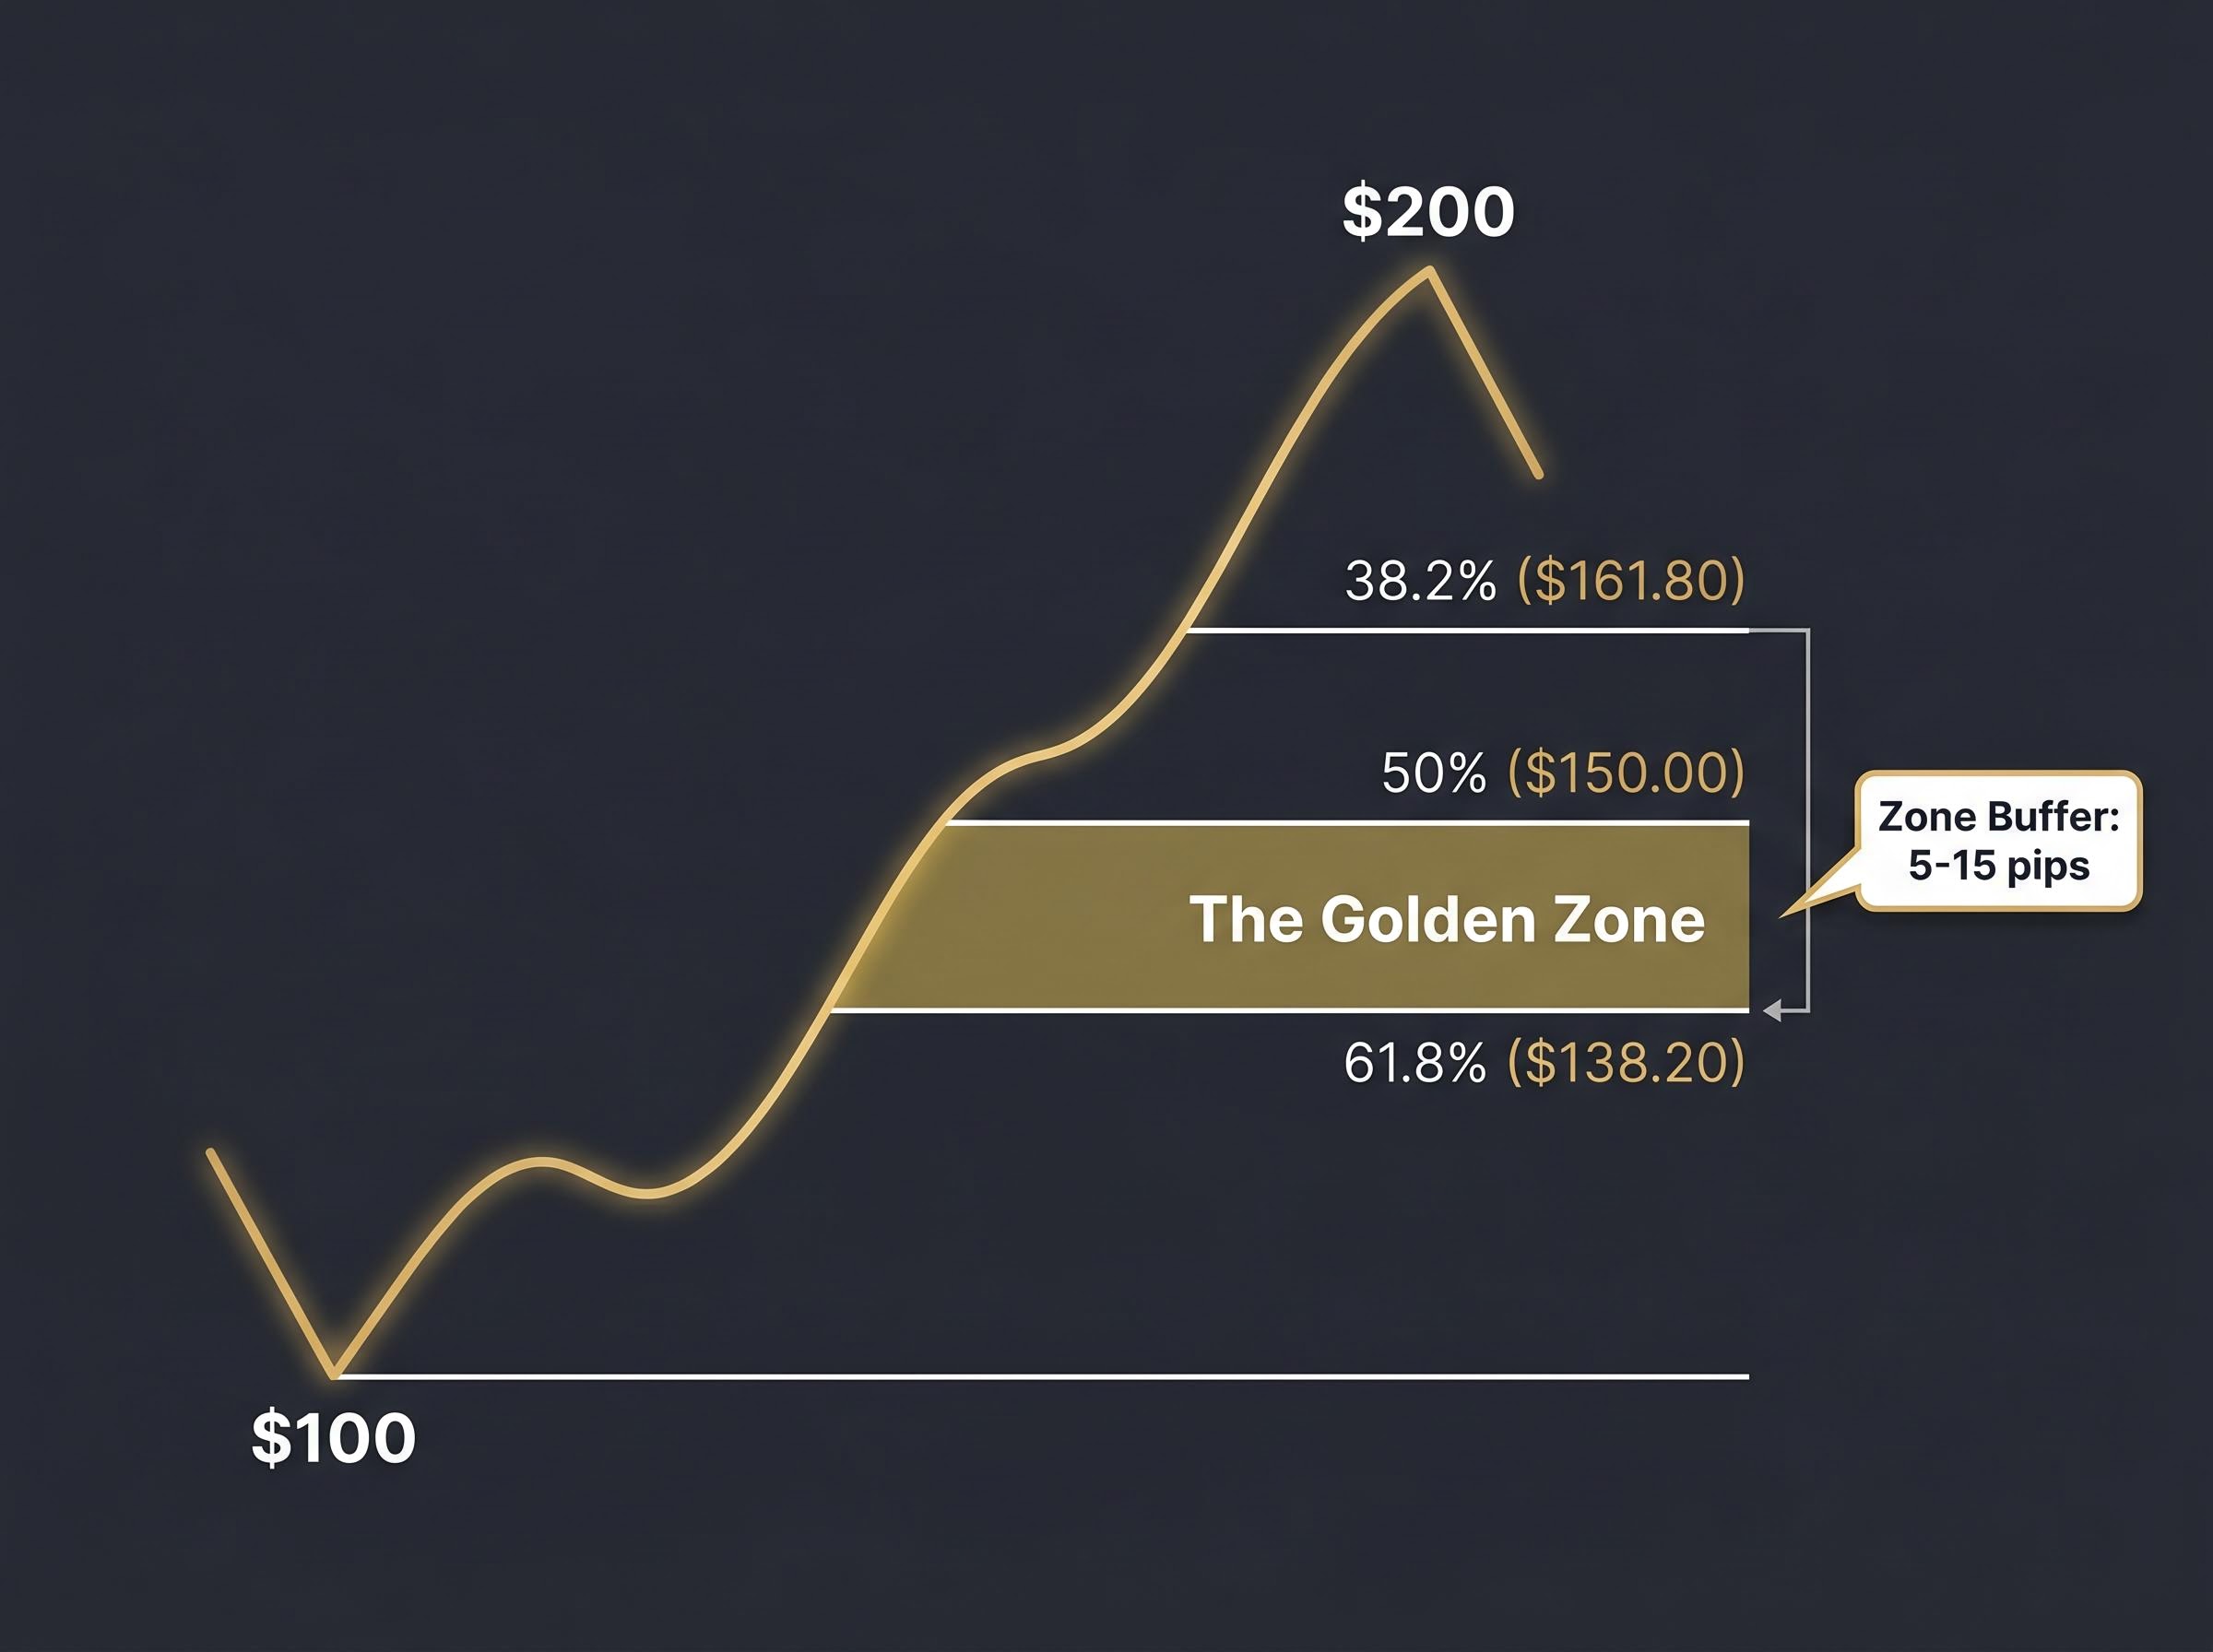
- Apply a zone buffer. Give each level a margin of 5-15 pips (or an equivalent scaled to the instrument’s normal volatility) to account for natural price variability around the level.
Consider a hypothetical price advance from $100 to $200. The charting software automatically generates horizontal levels. A pullback might find support near $161.80 (the 38.2% retracement), $150.00 (the 50% level), or $138.20 (the 61.8% level).
Treating levels as zones, not exact prices
Price can overshoot or undershoot a Fibonacci level by several pips or points before reversing. Traders who place precise limit orders at the exact level will frequently see them missed by a small margin, then watch the reversal happen without them.
A practical buffer of 5-15 pips around each level accounts for this natural variability. Scaling the buffer to the instrument’s typical volatility keeps it proportionate: a buffer appropriate for EUR/USD will differ from one applied to Bitcoin. The level remains significant; the interpretation simply acknowledges that markets do not respect mathematical precision to the tick.
Using retracement levels to time entries and set stop-losses
Knowing where to draw Fibonacci levels is setup mechanics. The next step is converting those levels into structured trade decisions with defined entry points and invalidation thresholds.
The Golden Zone, spanning the 50% to 61.8% retracement range, receives the most attention from professional traders for a reason. It represents the deepest pullback a healthy trend typically makes before continuing. Entries within this range balance retracement depth (buying or selling at a meaningful discount to the trend) with directional conviction (the trend structure remains intact).
“The 50%-61.8% range represents the deepest retracement a healthy trend typically makes before resuming. Entries here balance depth with directional conviction.”
In 2025, traders and analysts noted that pullbacks to the 38.2%-50% range frequently signalled trend continuations in cryptocurrency markets before price resumed the primary direction. This reinforced the Golden Zone’s role as a timing mechanism within established trends rather than a standalone prediction tool.
Stop-loss placement follows the same structural logic. Stops are positioned slightly below the 61.8% level, or at the 78.6% level for traders who prefer a wider structural stop. The reasoning is straightforward: if price breaches 61.8% convincingly, the original swing structure is likely invalidated, and the retracement has become something else entirely. Placing stops at an arbitrary dollar amount divorced from the chart structure introduces unnecessary risk.
| Level | Entry Relevance | Stop-Loss Logic |
|---|---|---|
| 38.2% | Shallow pullback; requires strong confluence | Stop below 50% or 61.8% |
| 50% | Golden Zone entry; high-probability with confirmation | Stop below 61.8% |
| 61.8% | Golden Zone entry; deepest high-conviction level | Stop below 61.8% or at 78.6% |
| 78.6% | Last structural defence; caution warranted | Stop below the original swing low/high |
One condition must be met before any of this applies: the market must be trending. Confirm higher highs and higher lows (uptrend) or lower highs and lower lows (downtrend) before drawing the tool. In ranging markets, there is no directional trend to retrace from, and Fibonacci levels become random lines that price is likely to ignore.
Setting profit targets with Fibonacci extensions
Fibonacci extensions are not a separate advanced technique. They are the logical exit counterpart to retracement entries, completing the trade framework.
Extensions use the same three points that defined the retracement. In an uptrend, the anchor points are the original swing low, the swing high, and the retracement low. The tool then projects levels beyond the original swing high as potential profit targets.
- Identify the original swing high and swing low that were used for the retracement.
- Mark the retracement endpoint, the low point where the pullback found support within the Golden Zone or at another confirmed level.
- Apply the extension tool to project targets beyond the original swing high.
The three primary extension levels are 1.272 (127.2%), 1.414 (141.4%), and 1.618 (161.8%). Among these, 161.8% is the most widely watched extension target in professional practice, reflecting the golden ratio projected forward.
Consider the earlier example: a move from $100 to $200 with a retracement to $150. Extension targets project near $250 (the 161.8% extension) and $300 (the 261.8% extension). These are not arbitrary round numbers; they are derived from the same mathematical relationships that define the retracement levels.
Reading extension levels as profit zones, not guarantees
Extension levels indicate where price has historically shown a tendency to pause or reverse. They do not guarantee that price will stop at any specific projection.
A tiered exit approach manages the tension between locking in gains and capturing the full move. Taking partial profit at the 127.2% level secures a portion of the position, while trailing the remainder toward the 161.8% level leaves room for the trend to extend further. This structure allows traders to calculate their risk-reward ratio before entering, a prerequisite for consistent position sizing and long-term profitability.
CFD leverage mechanics amplify the cost of a misplaced stop-loss significantly: at 10:1 leverage, a 5% adverse move against an invalidated Fibonacci level produces a 50% loss on the margin deposit, which is why structuring stops around the 61.8% or 78.6% level rather than arbitrary dollar amounts is not a stylistic preference but a capital preservation requirement.
Building confluence: why Fibonacci rarely works alone
A Fibonacci level in isolation is a point of interest, not a trade signal. The shift from treating levels as destinations to treating them as conditional zones marks the difference between mechanical application and selective, high-probability trade selection.
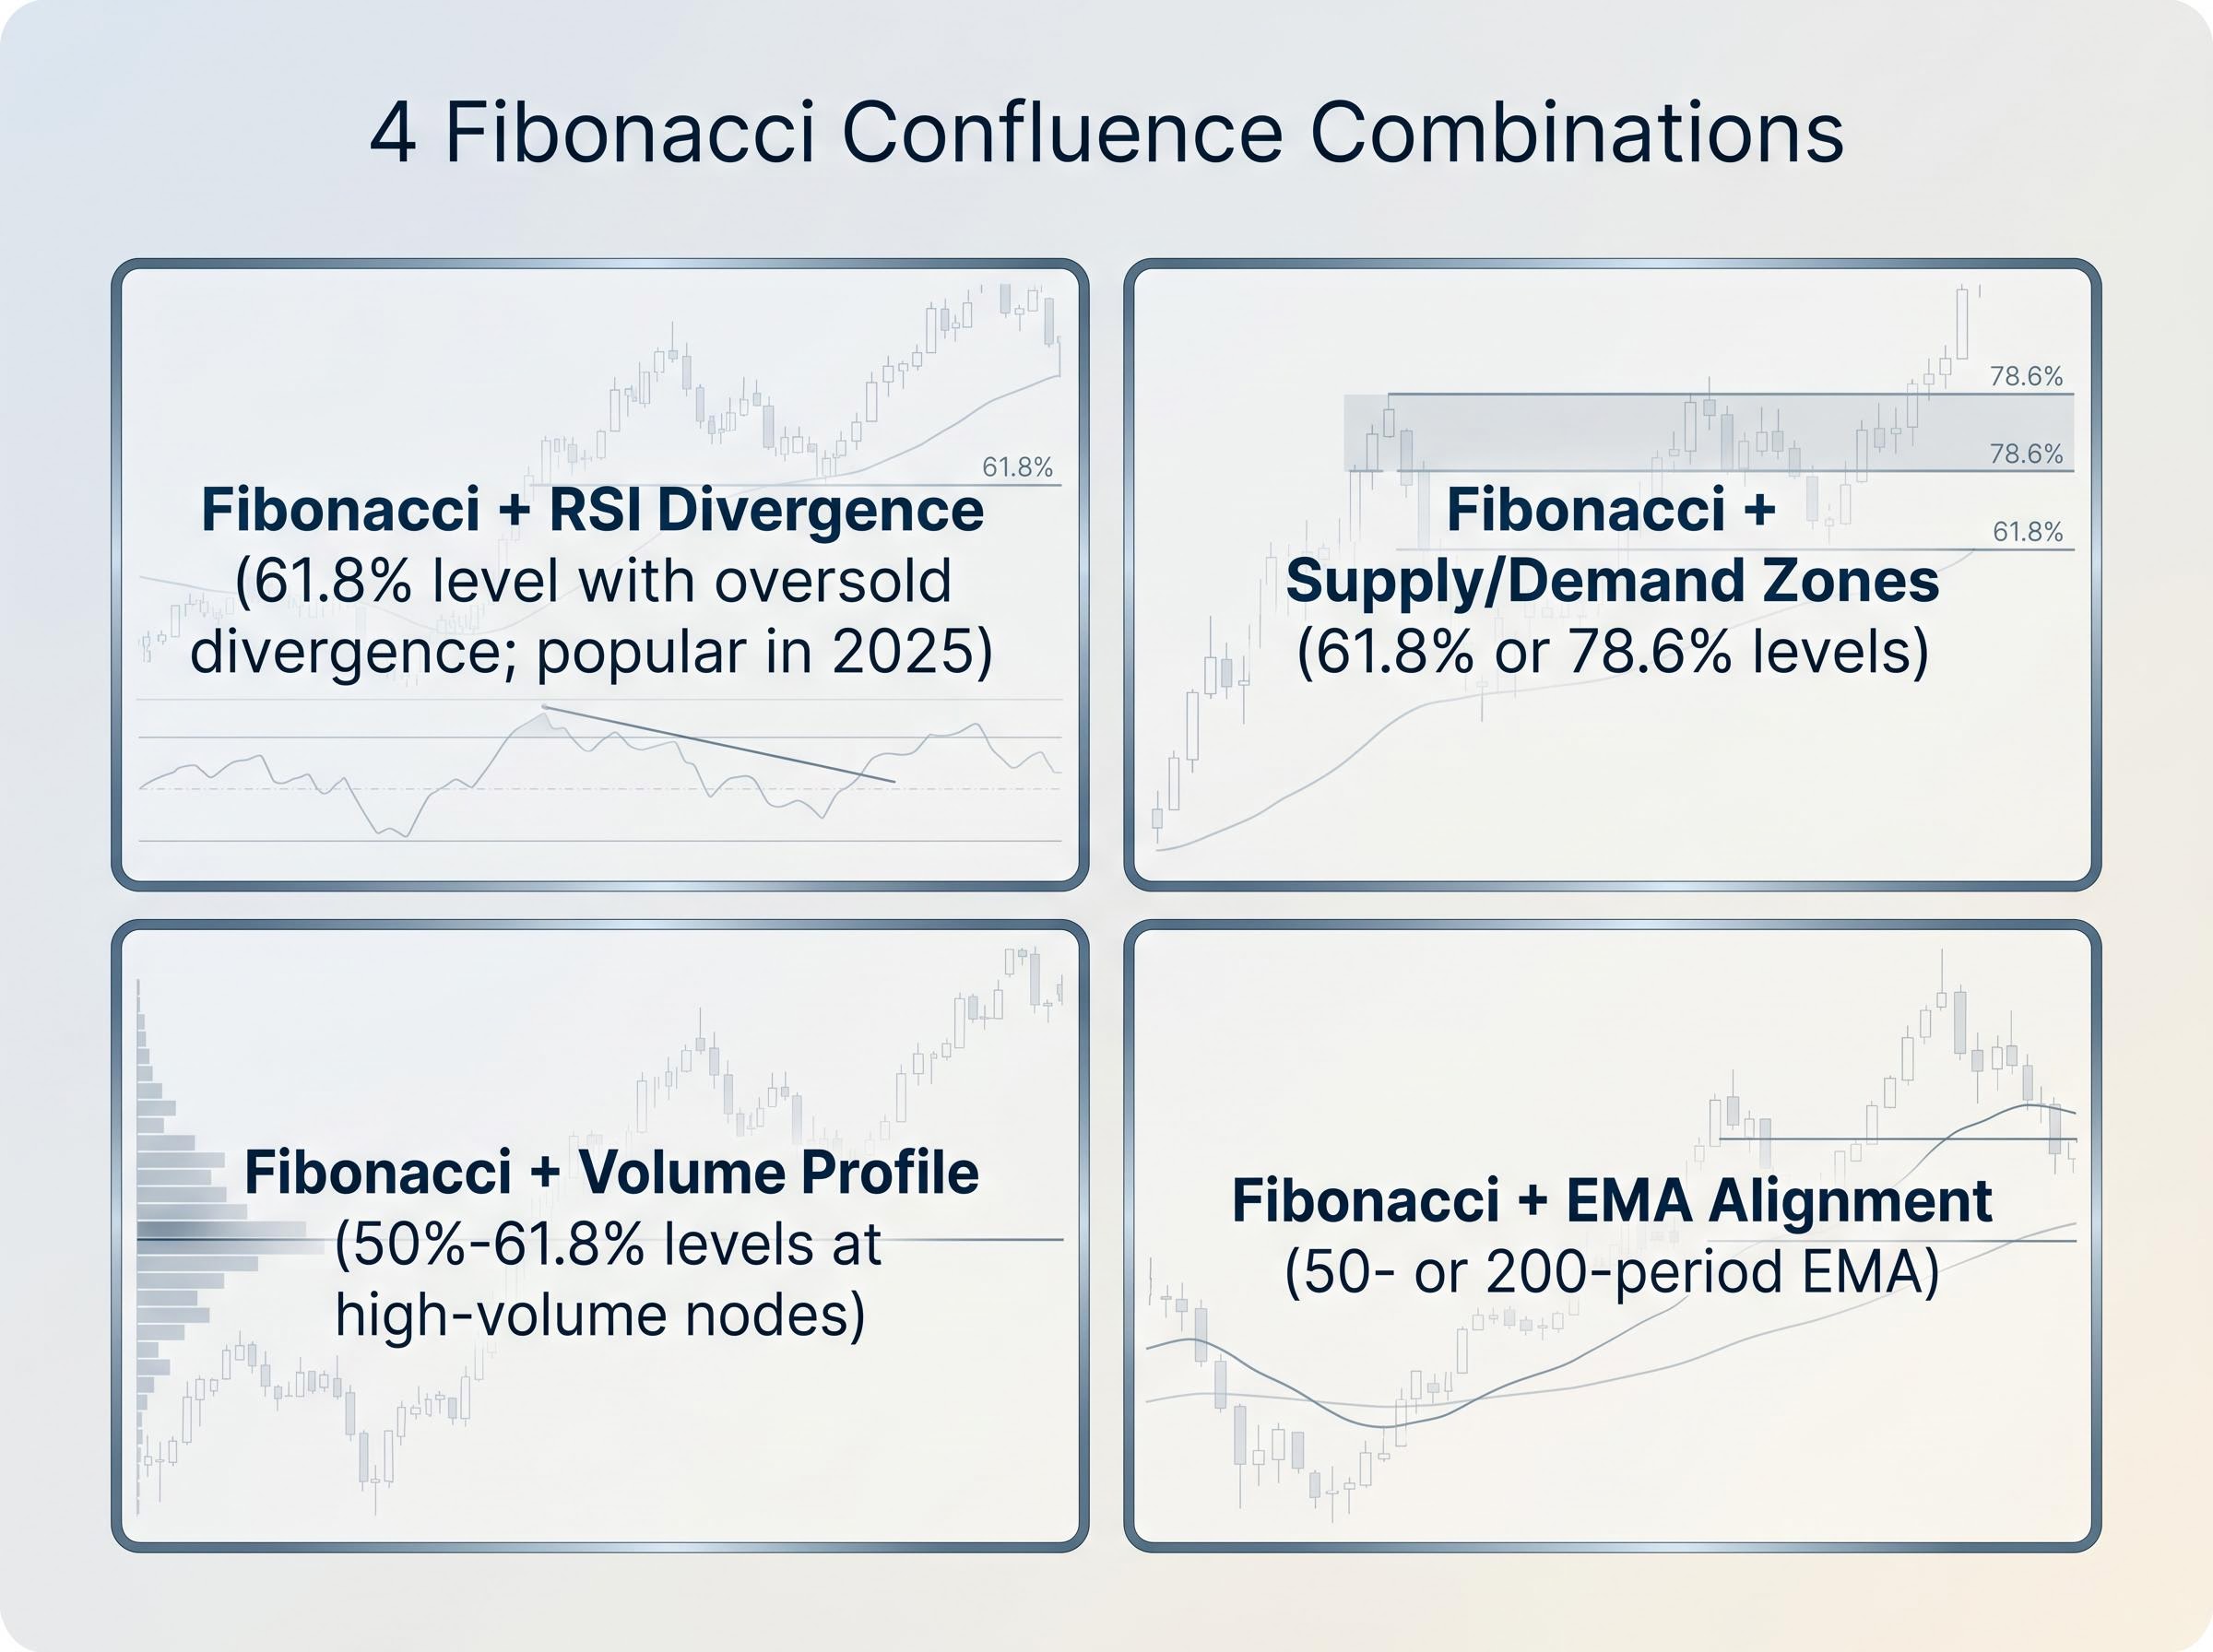
At minimum, one independent confirming factor should be present before acting on any Fibonacci level. The four most practical confluence combinations in current practice are:
- Fibonacci + RSI divergence. When price pulls back to the 61.8% level and RSI simultaneously shows oversold divergence, selling momentum is weakening at the exact zone where structural support exists. This combination was one of the most widely discussed setups in 2025 trading communities.
- Fibonacci + supply and demand zones. When a retracement level (particularly 61.8% or 78.6%) falls within a pre-identified demand zone in an uptrend (or supply zone in a downtrend), the structural logic of the zone reinforces the mathematical level.
- Fibonacci + volume profile high-volume nodes. When a 50%-61.8% Fibonacci level aligns with a high-volume node from the volume profile, traders treat it as a reinforced support or resistance zone. This approach brings an objective, data-driven layer to level validation.
- Fibonacci + EMA alignment. When a moving average (such as the 50- or 200-period EMA) sits near a Fibonacci retracement level, trend direction confirmation and structural support converge at the same price zone.
“Fibonacci identifies where price may react. Confluence factors confirm whether it is likely to react.”
Every additional confirming factor filters out false signals. A single Fibonacci line without confluence is not a trade setup.
Multi-timeframe analysis as the final filter
The standard approach involves confirming the primary trend and anchoring Fibonacci levels on the daily or 4-hour chart, then dropping to 1-hour or 15-minute charts for precise entry timing once price approaches the zone.
A technically clean lower-timeframe Fibonacci setup that conflicts with daily chart structure, such as a long entry approaching major daily resistance, should be downgraded or skipped entirely. Higher-timeframe levels carry more structural weight and can overwhelm lower-timeframe setups regardless of how clean they appear in isolation.
The next major ASX story will hit our subscribers first
The limits of Fibonacci trading and what the tool cannot do
Fibonacci levels are not predictive in any deterministic sense. Price does not know where 61.8% is. The levels work when enough participants act on them within a trending market structure, and they fail when broader forces overwhelm that behaviour.
The specific failure conditions include:
- Ranging markets. Without a clear trend (confirmed higher highs and higher lows, or lower highs and lower lows), there is no directional move to retrace from. Fibonacci levels in a range are arbitrary.
- High-impact economic releases. Macro forces, including rate decisions, employment data, and geopolitical developments, can overwhelm any technical structure. Broader market forces including economic releases and investor sentiment are not captured by any mathematical ratio.
- Very short timeframes. On 1-minute or 5-minute charts, noise drowns out meaningful levels, and Fibonacci zones lose their structural significance.
- Anchor points drawn on insignificant swings. If the swing high and low are not clearly visible on a 4-hour or daily chart, the resulting levels are unreliable regardless of how many confluence factors align.
S&P 500 breadth conditions in 2025-2026 illustrate this limit clearly: fewer than 60% of index constituents traded above their 200-day moving average even as headline index levels made new highs, a divergence that would cause any Fibonacci level anchored to the broad index swing to misrepresent the underlying structural trend for most individual components.
Fibonacci is a probabilistic tool for improving timing within an already-understood trend context. It is not a system that works independently of market structure, risk management, or trader judgement. Honest awareness of these boundaries prevents overreliance and the losses that follow from it.
Fibonacci as a framework, not a formula
The complete framework fits into six steps that function as a repeatable checklist:
- Confirm the trend. Verify higher highs and higher lows (uptrend) or lower highs and lower lows (downtrend) before placing the tool.
- Identify the significant swing. Select anchor points clearly visible on the 4-hour or daily chart.
- Draw wick-to-wick. Capture the full range of the swing including volatility spikes, and apply the method consistently across every trade.
- Watch the Golden Zone. Prioritise the 50%-61.8% retracement range for entries, requiring at least one confluence factor before acting.
- Set the stop below 61.8%. Use the 61.8% level or the 78.6% level as structural invalidation points for stop-loss placement.
- Target extensions for exits. Use the 127.2% and 161.8% extension levels as profit targets, considering a tiered exit to balance locking in gains with capturing the full move.
Consistency in application matters more than perfection. The tool’s value compounds with experience drawing levels across many charts and observing how price interacts with them in different conditions. Before committing real capital, applying this framework on historical price data through manual backtesting builds pattern recognition without financial risk.
This article is for informational purposes only and should not be considered financial advice. Investors should conduct their own research and consult with financial professionals before making investment decisions. Past performance does not guarantee future results, and technical analysis tools are subject to market conditions and various risk factors.