Gold Bounces 0.8%, but the Fed and Dollar Hold the Ceiling
2 hrs ago
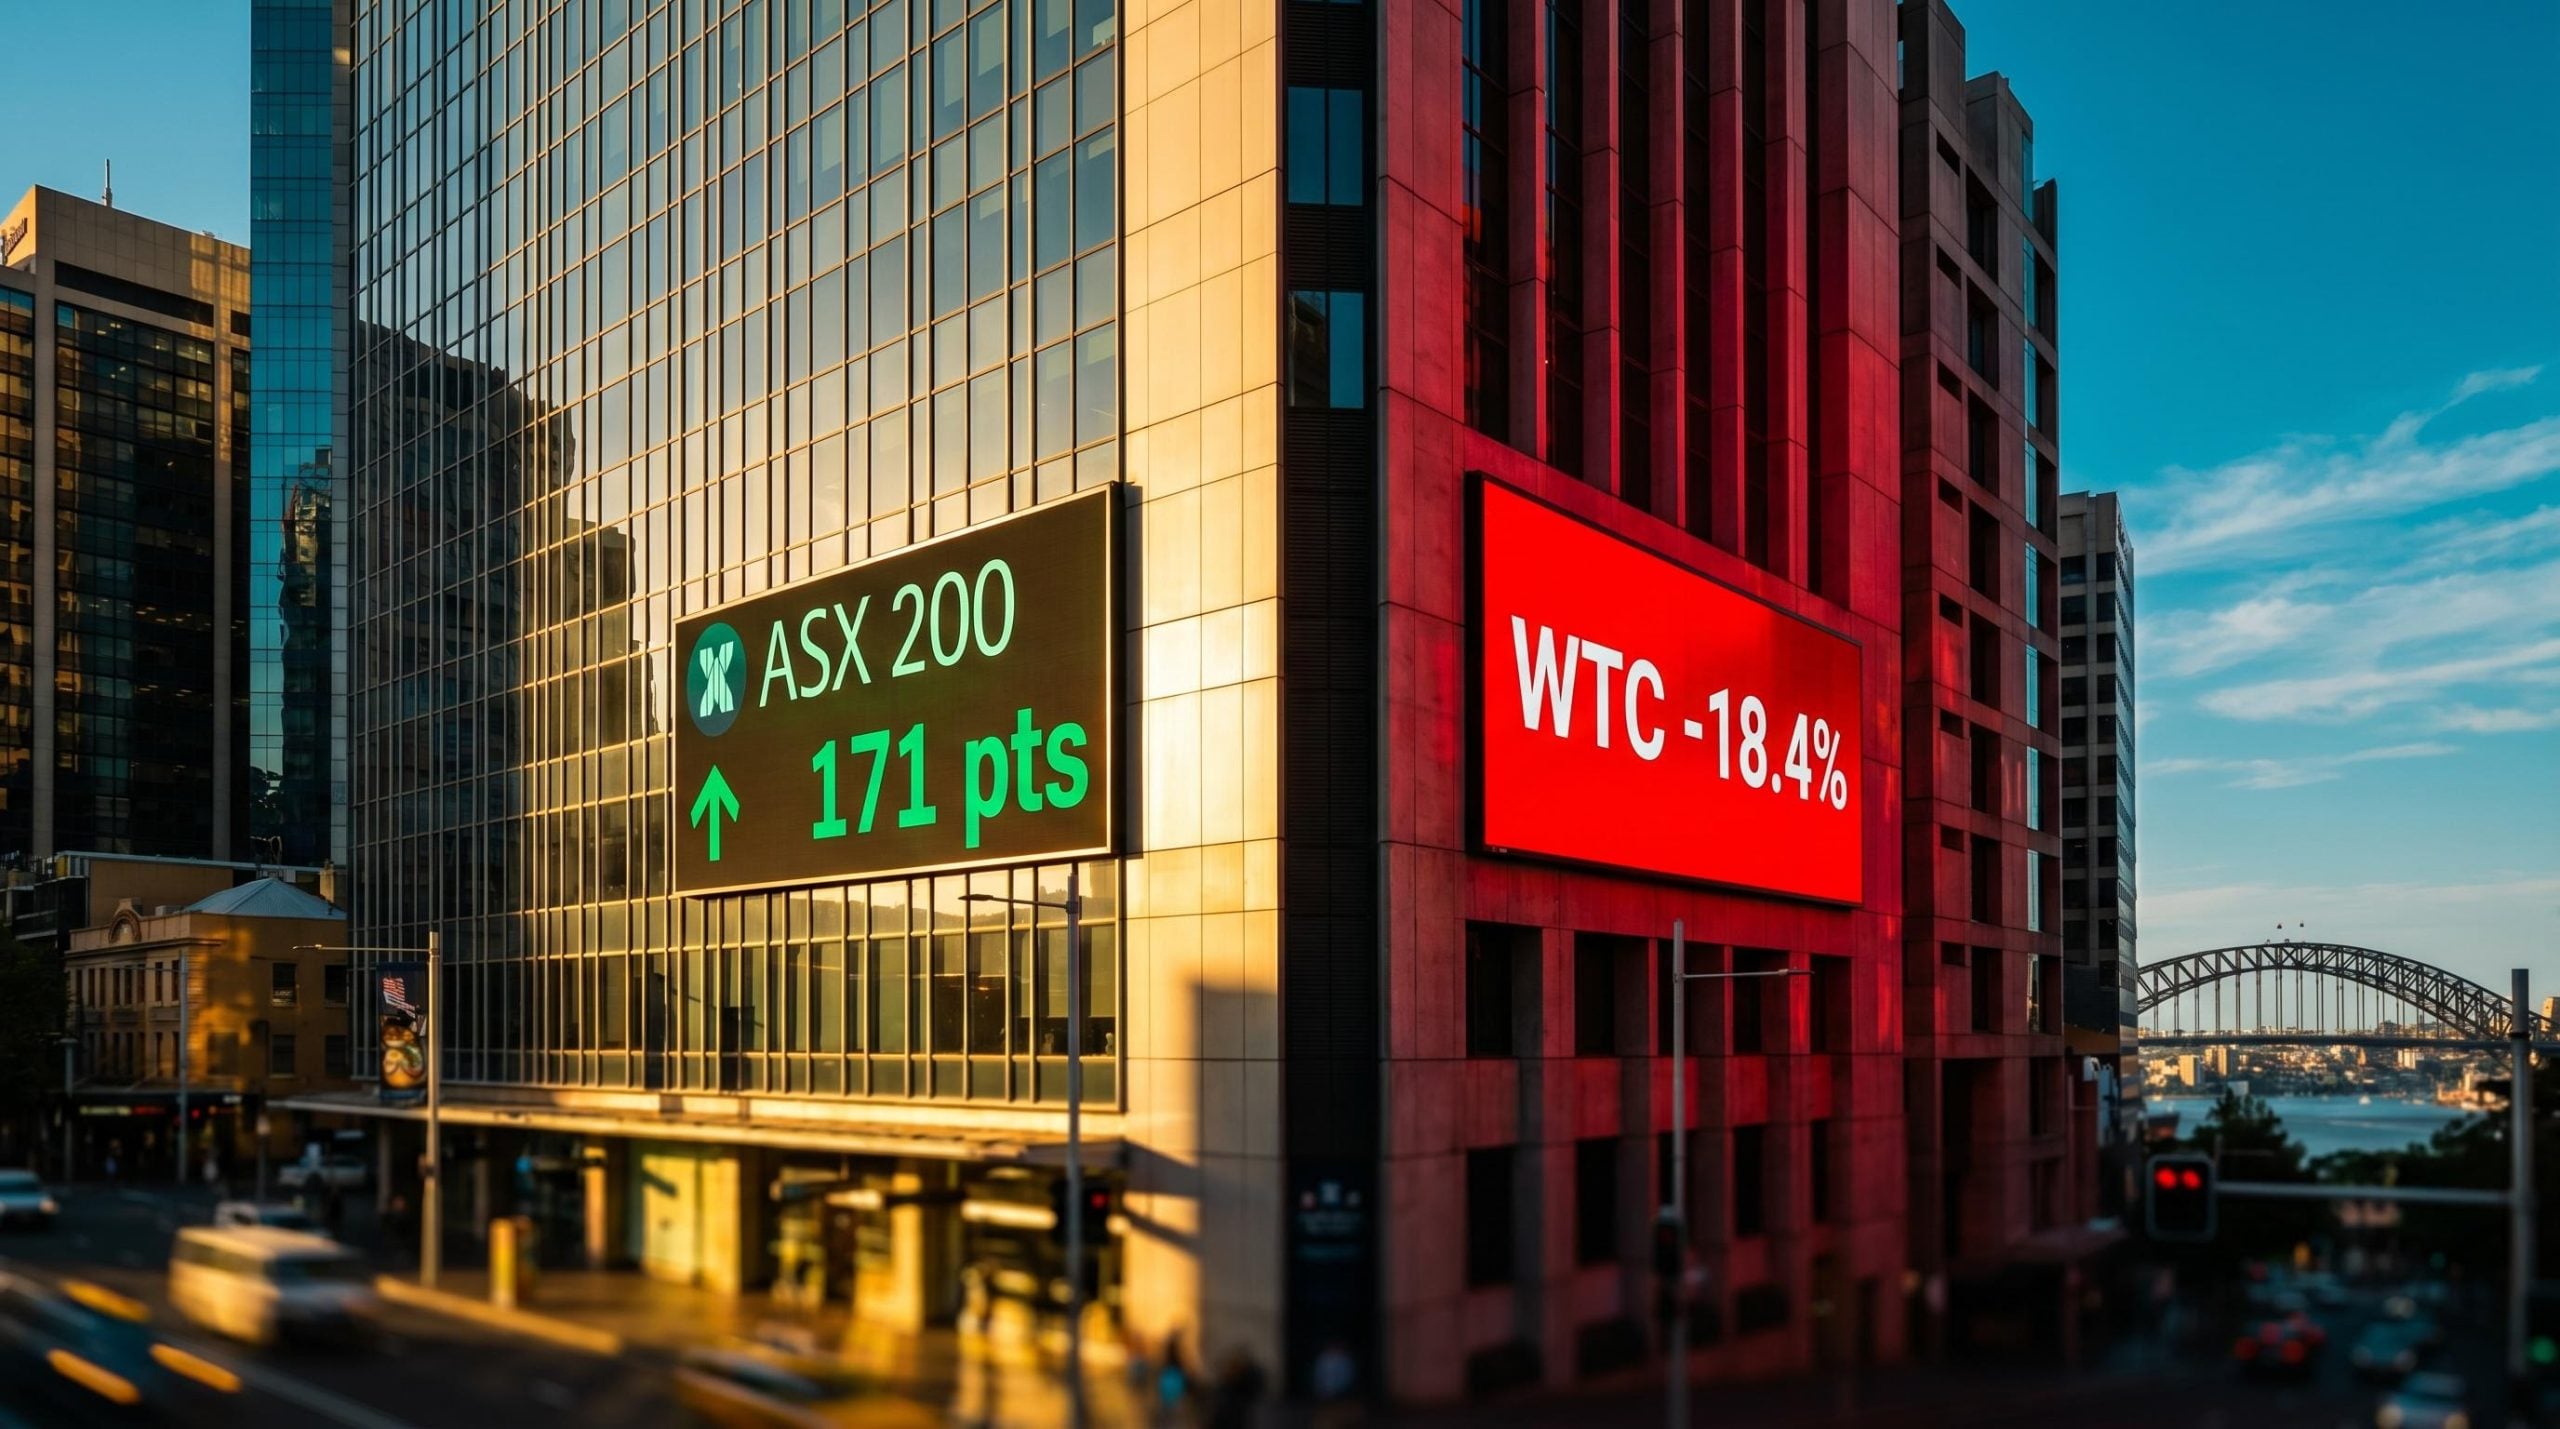
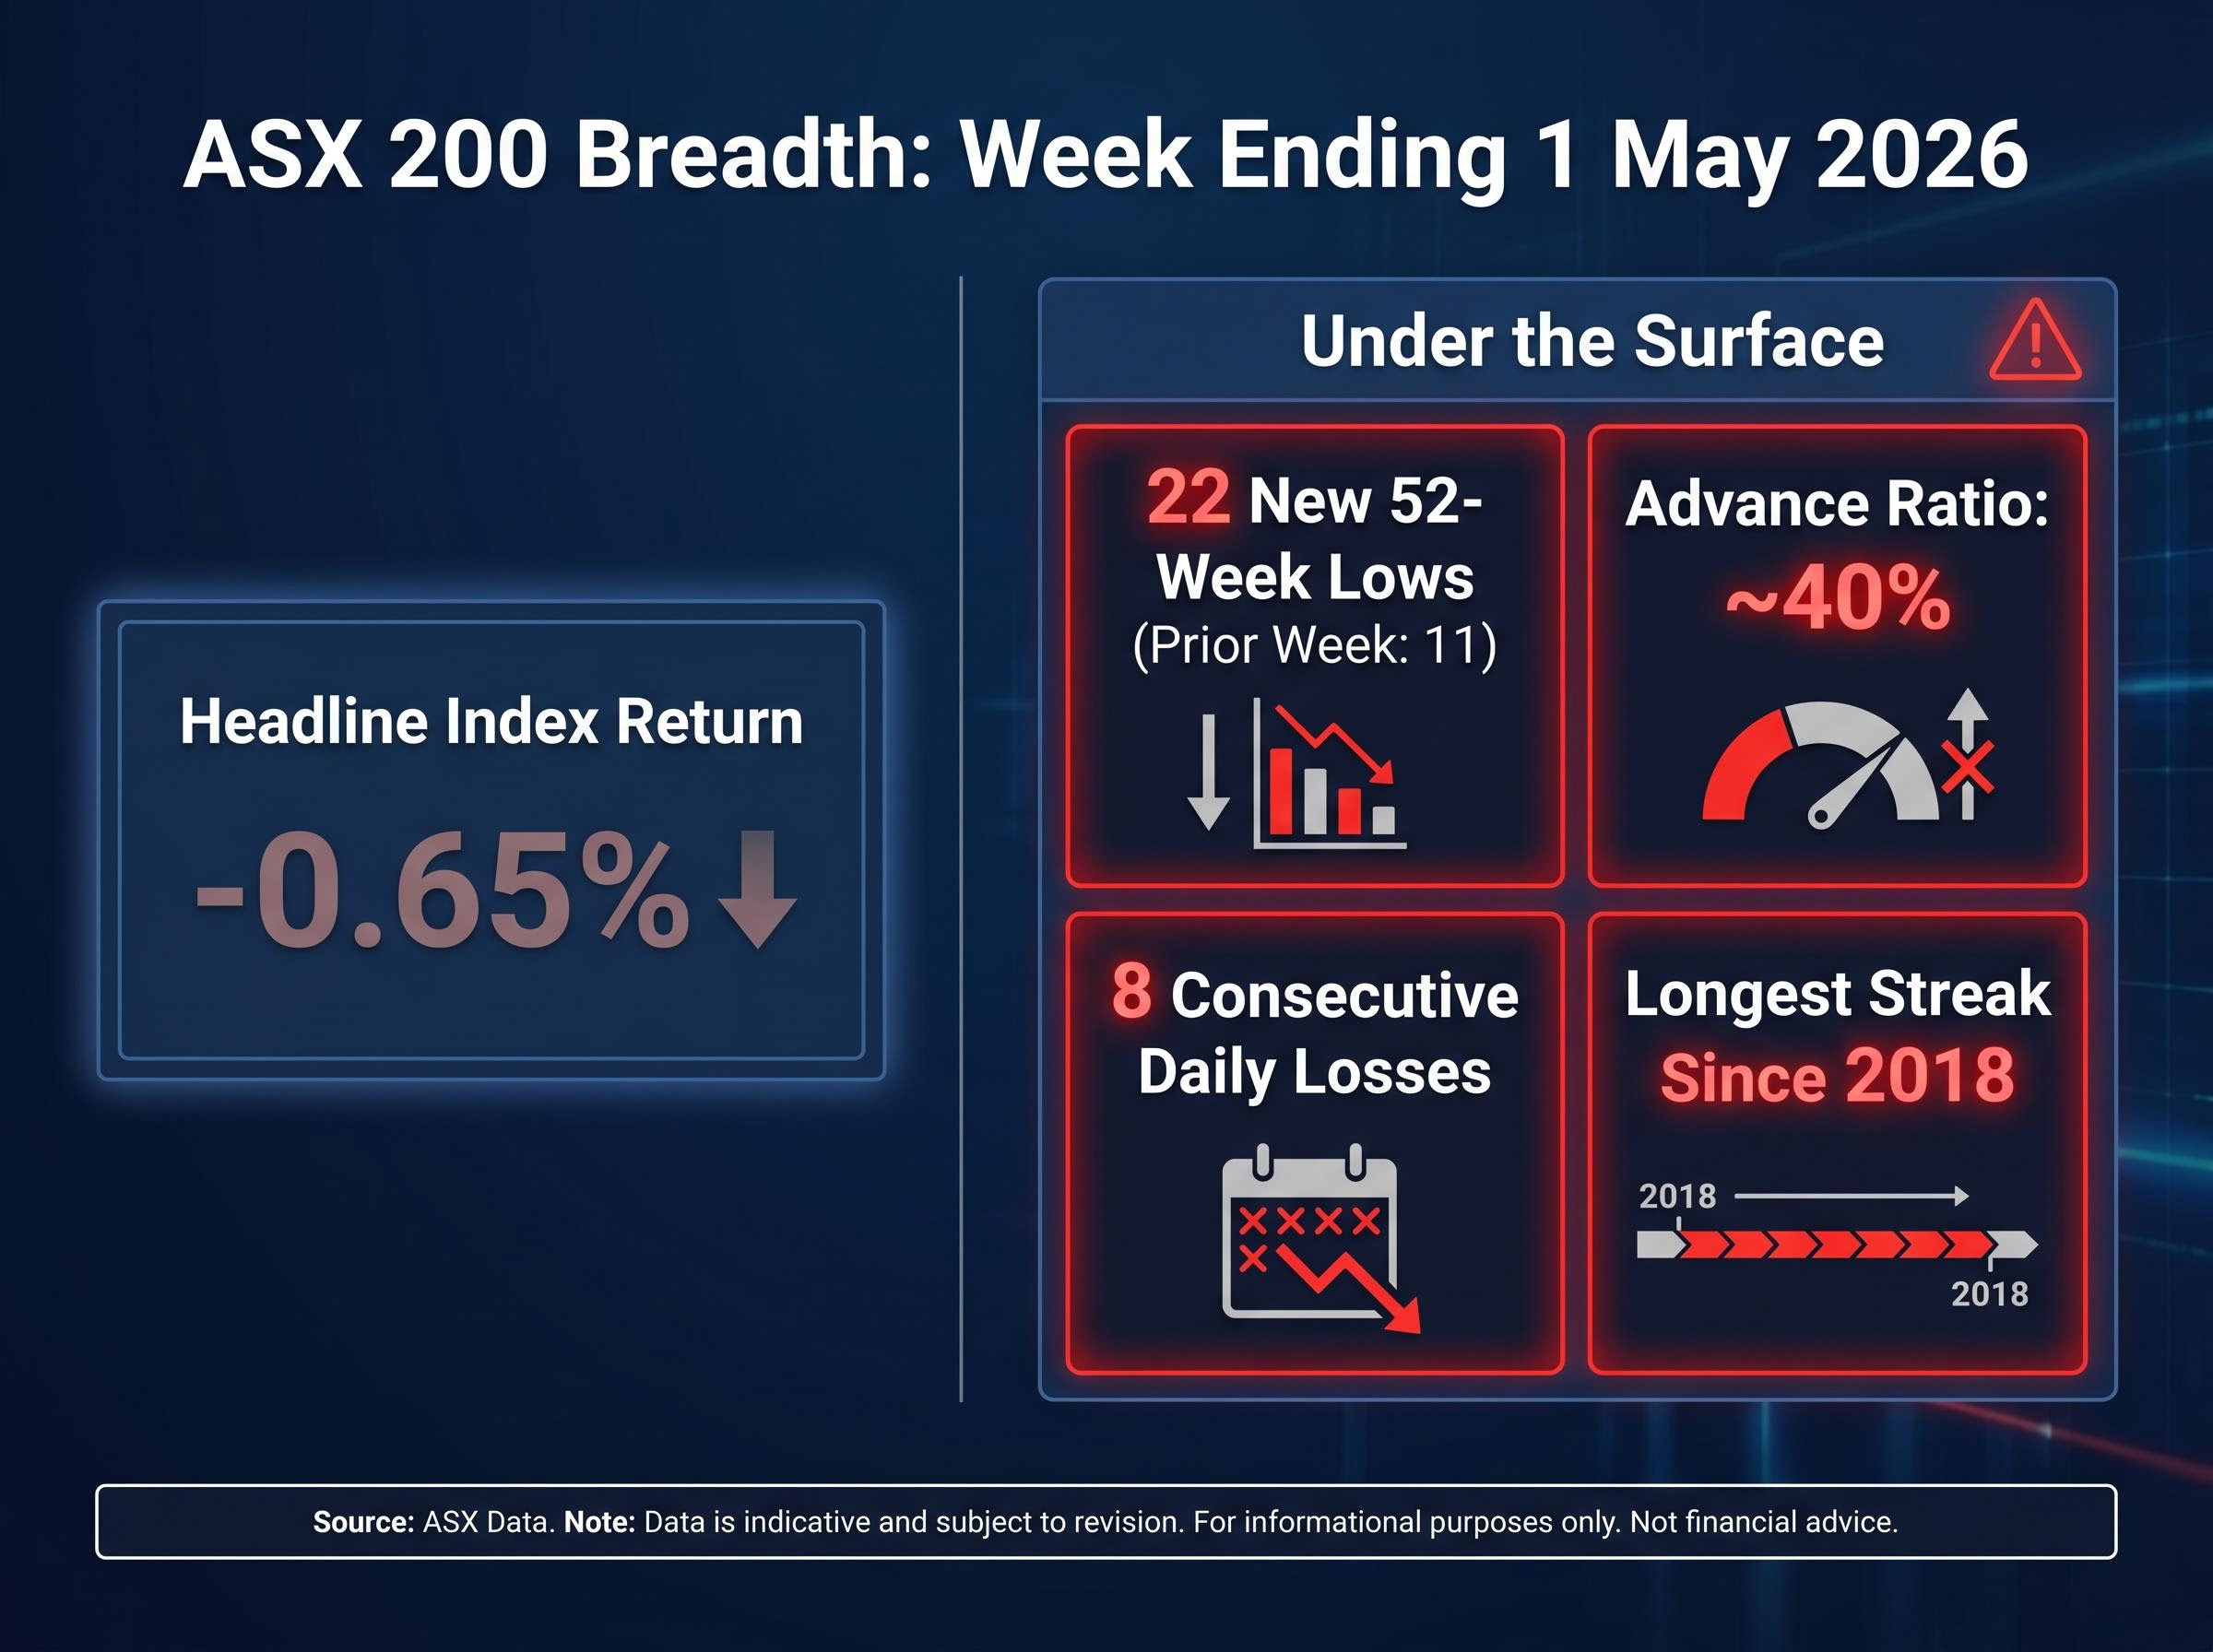
The ASX 200 fell 0.65% for the week ending 1 May 2026. On its own, that number barely registers. Beneath it, 22 index constituents, roughly 11% of the benchmark, touched fresh 52-week lows in a single week. That is double the 11 new annual lows recorded the week prior, and the sharpest breadth deterioration in recent memory. The eight consecutive daily losses that preceded the week’s final session marked the longest losing streak since 2018, yet the index still sits approximately 5.5% higher on a trailing twelve-month basis. This article breaks down the sectors driving the damage, the macro forces behind each, and what the breadth data signals about near-term ASX market conditions.
The weekly headline told one story. The underlying data told another.
A 0.65% decline for the ASX 200 would normally warrant little more than a footnote. But 22 of its 200 constituents printing fresh annual lows in the same week is not a footnote; it is a signal that the index level is masking concentrated price stress below the surface.
The contrast in one number: 22 new 52-week lows against a headline weekly loss of just 0.65%.
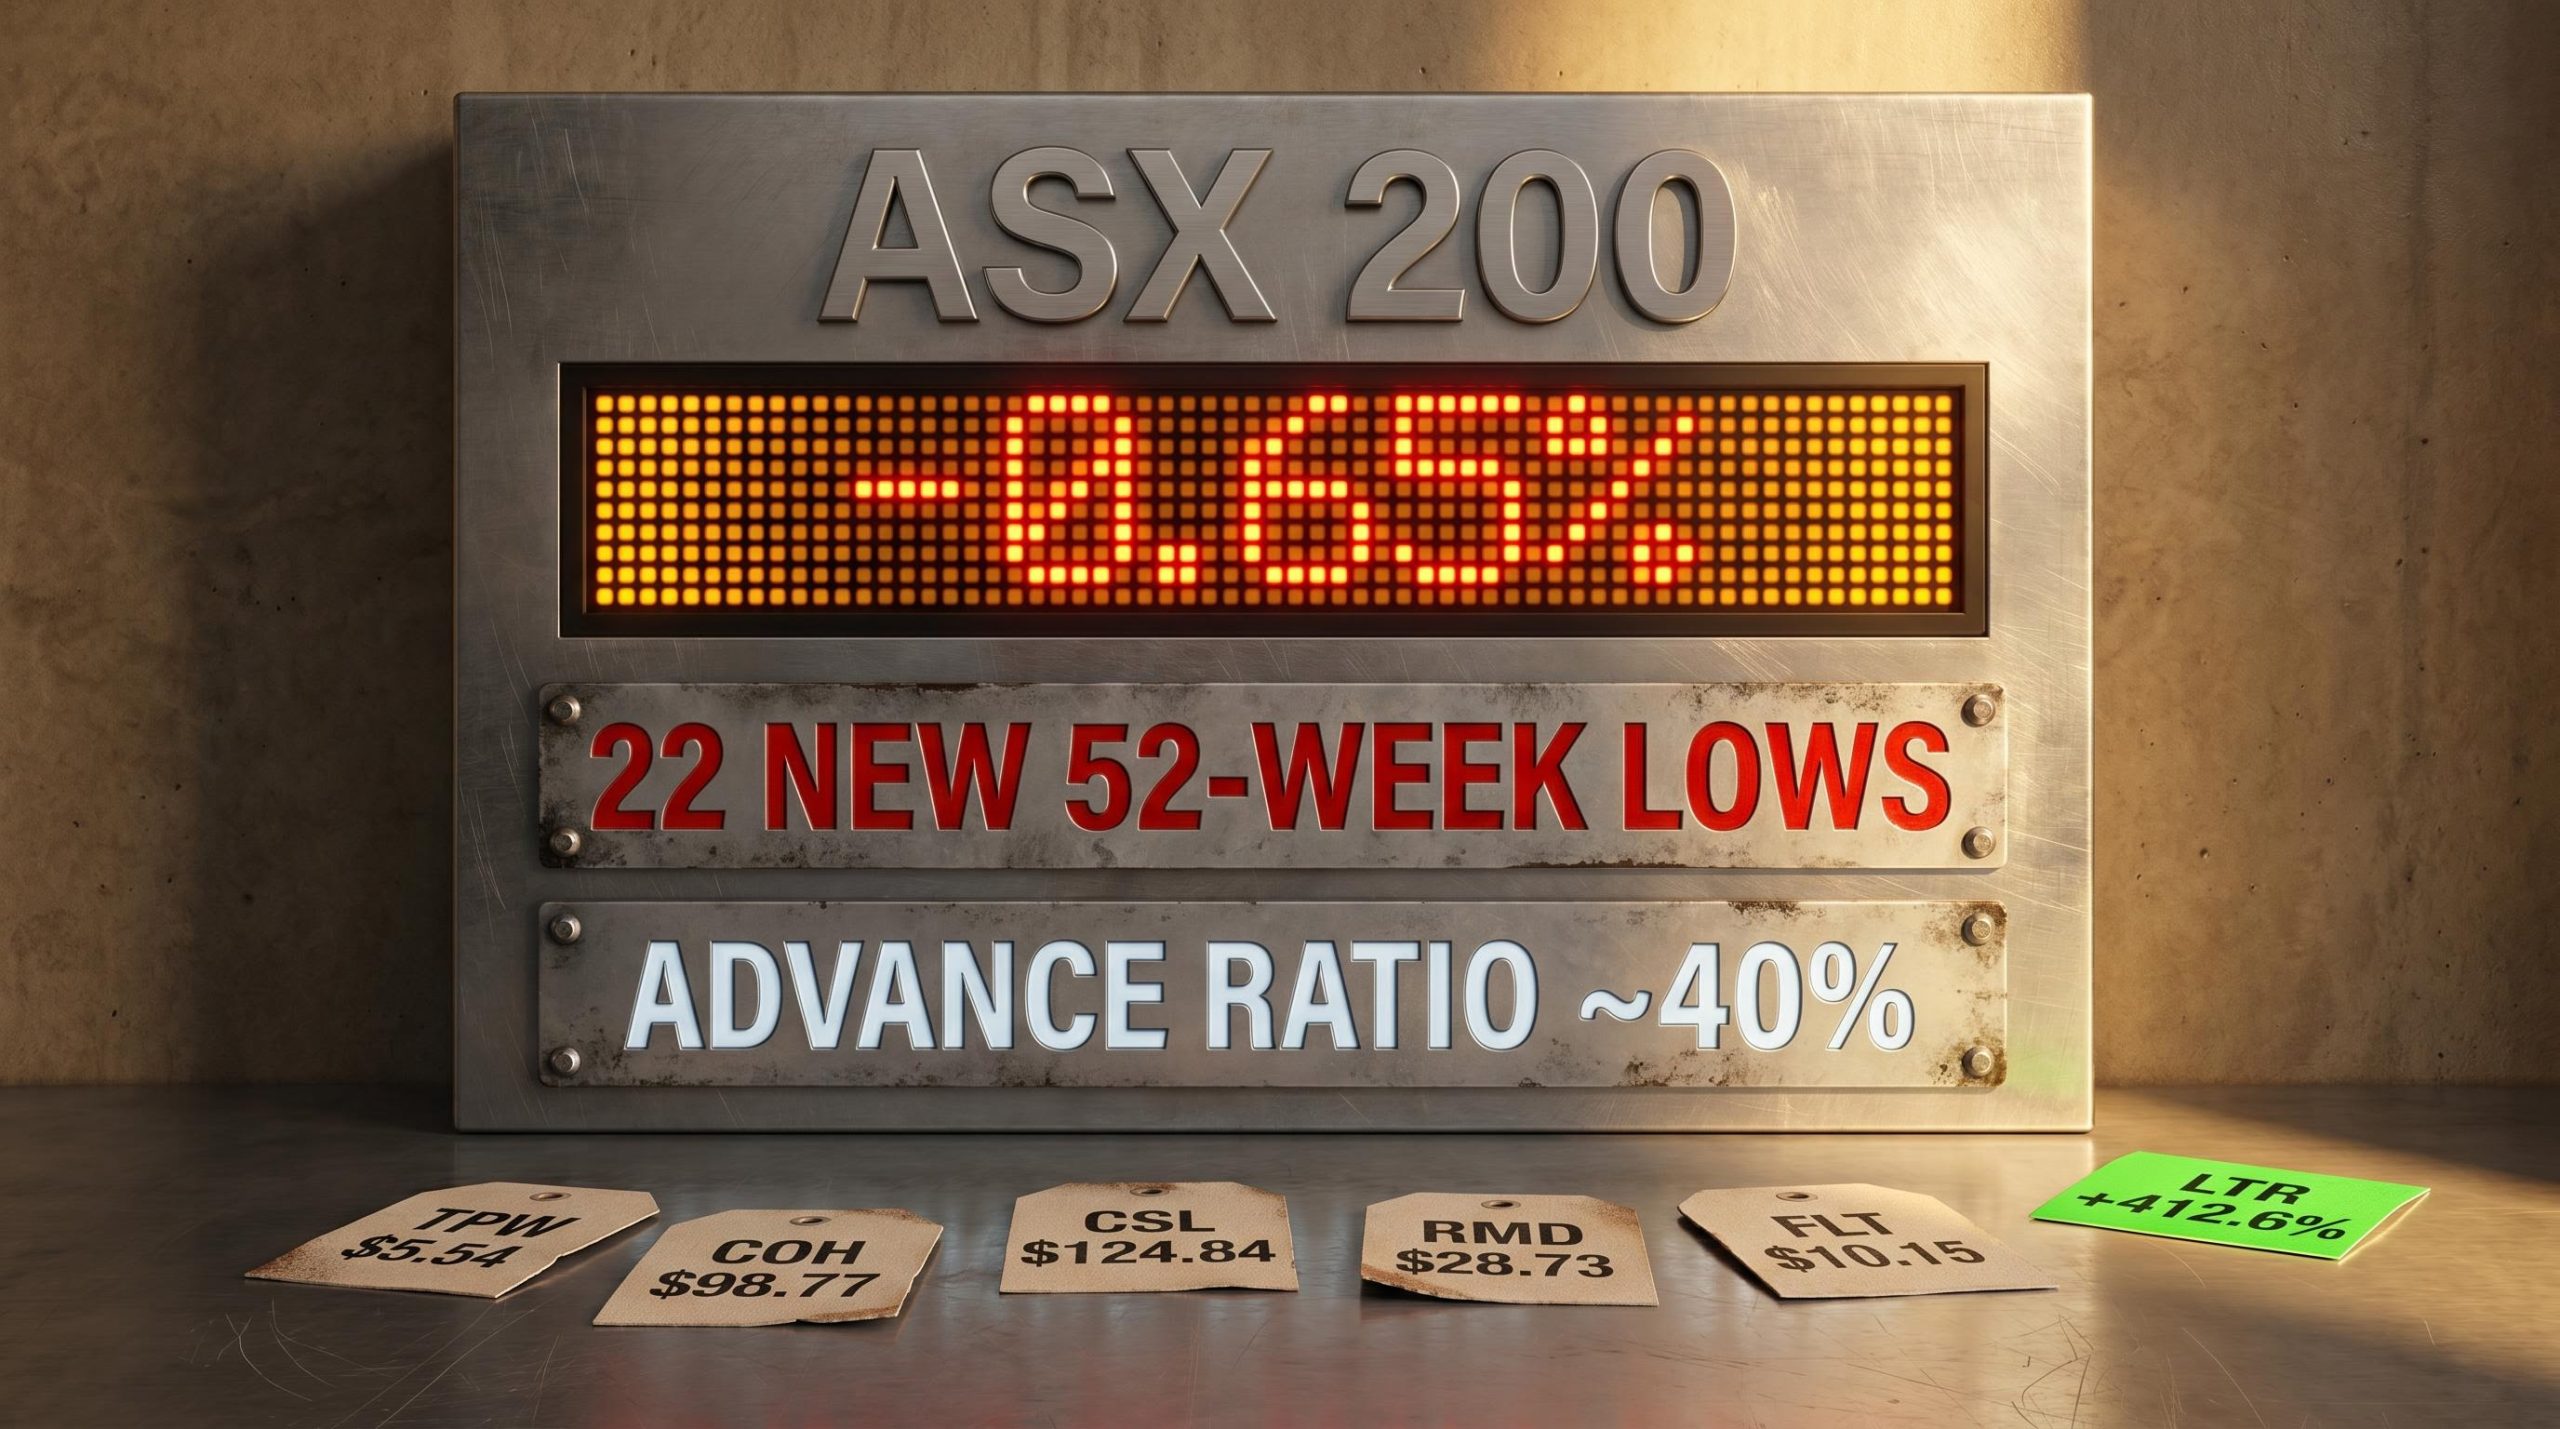
The deterioration is accelerating. The prior week produced 11 new annual lows. That figure doubled. The advance ratio across the ASX 200 sat at approximately 40% for the week, meaning fewer than half the index’s members managed to close higher.
Key breadth metrics from the week ending 1 May 2026:
An investor tracking only the index return this week would have missed a material shift in market health. The breadth data tells a different story from the one the ASX 200 printed at the close.
The passive investing market impact on ASX price formation helps explain why a headline index return of -0.65% can coexist with 22 constituents reaching annual lows simultaneously; when passive flows dominate at the index level, they compress the headline number even as individual stocks diverge sharply beneath it.
Consumer Discretionary absorbed the worst of the week’s selling, with seven constituents reaching fresh 52-week lows. The damage was not confined to a single sub-segment. It stretched from online retail to travel to furniture to auto accessories, a breadth of names that makes sector-specific explanations difficult to sustain.
Temple and Webster closed at $5.54, down 67.9% over the prior year. IDP Education settled at $3.28, off 65.2%. ARB Corporation ended at $18.70, a 39.7% decline. Flight Centre hit $10.15, down 19.5%. The furniture retailers followed: Nick Scali at $14.90 (down 17.2%) and Harvey Norman at $4.49 (down 15.1%). Super Retail Group rounded out the list at $12.06, off 9.0%.
Several of these names were already under sustained pressure after sharp falls during the February reporting season, and the selling has continued since. The sole sector counterpoint was Tabcorp, which registered the only new 52-week high in Consumer Discretionary for the week.
| Company | Code | Close | Week | 1-Year |
|---|---|---|---|---|
| Temple and Webster | TPW | $5.54 | New low | -67.9% |
| IDP Education | IEL | $3.28 | New low | -65.2% |
| ARB Corporation | ARB | $18.70 | New low | -39.7% |
| Flight Centre | FLT | $10.15 | New low | -19.5% |
| Nick Scali | NCK | $14.90 | New low | -17.2% |
| Harvey Norman | HVN | $4.49 | New low | -15.1% |
| Super Retail Group | SUL | $12.06 | New low | -9.0% |
Seven new annual lows in a single sector in one week points to sustained distribution, not a temporary pullback.
The stock-level damage across Consumer Discretionary is not random. It is the market pricing in a genuine shift in consumer behaviour, one now confirmed by hard data.
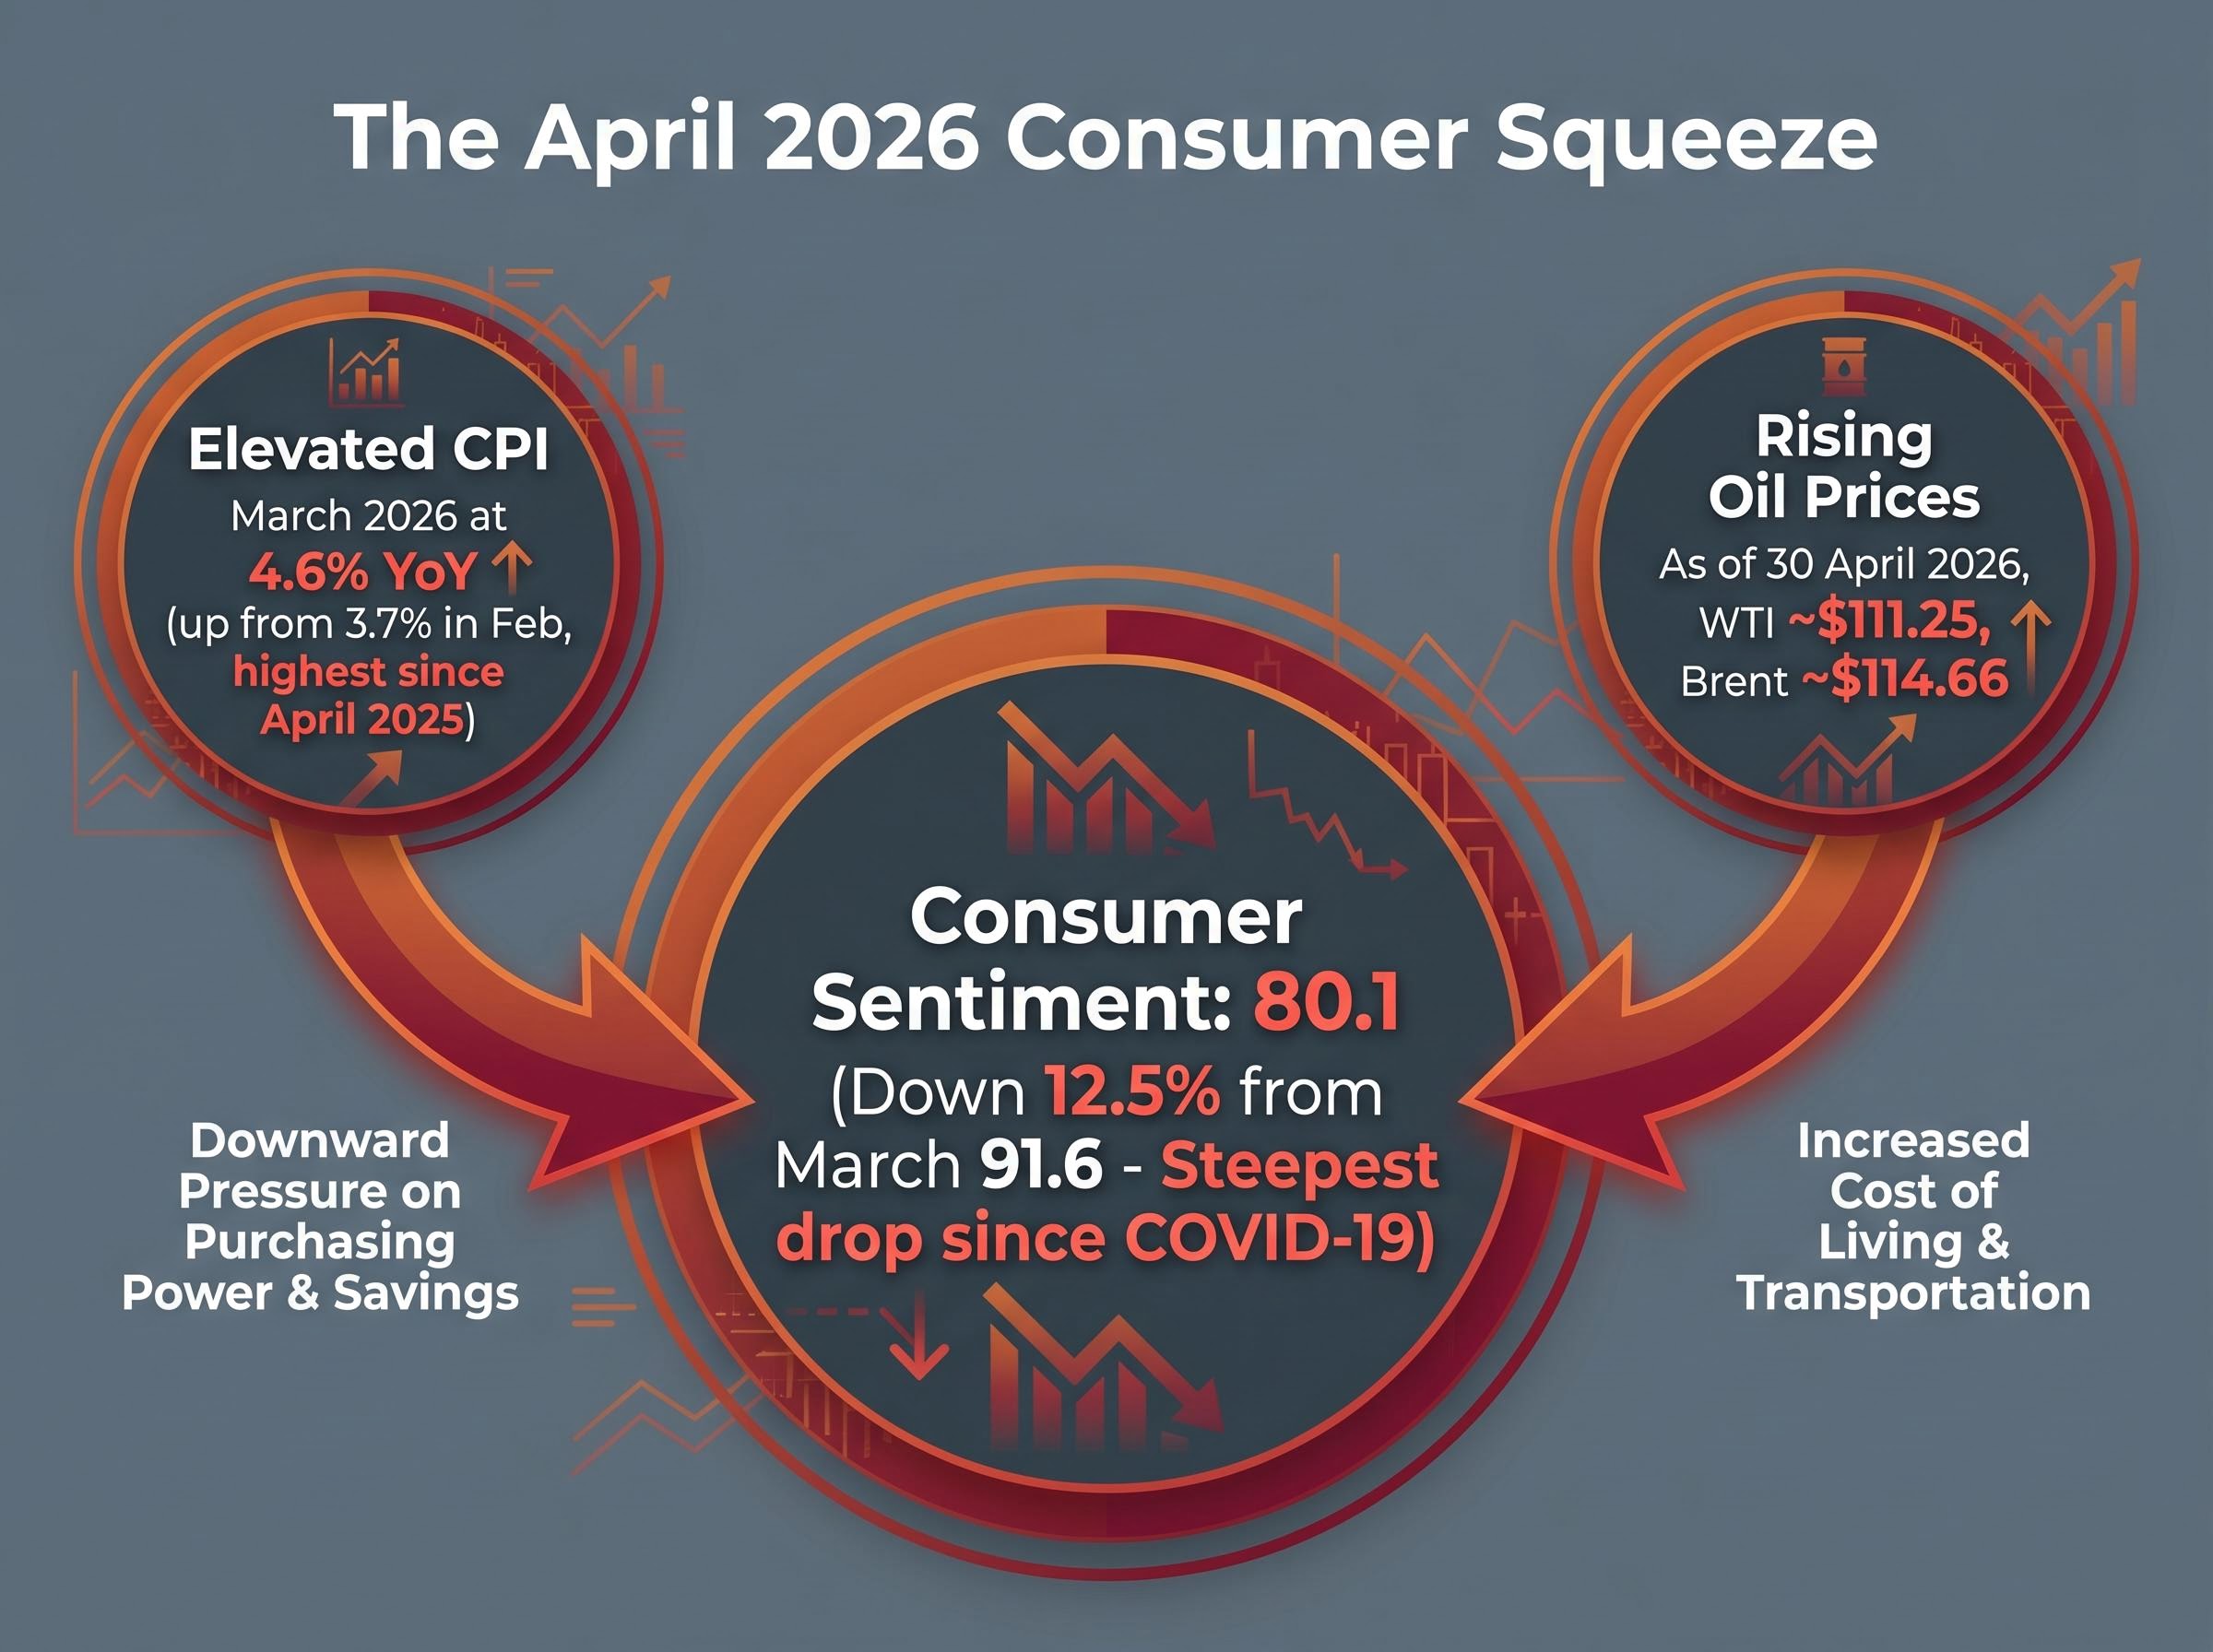
The Westpac-Melbourne Institute Consumer Sentiment Index fell to 80.1 in April 2026, down 12.5% from March’s reading of 91.6. That represents the steepest single-month decline since the COVID-19 pandemic.
Consumer sentiment collapsed: The April 2026 reading of 80.1, down 12.5% from March, marked the sharpest monthly fall since COVID-19.
Three macro pressure points are converging on the Australian consumer simultaneously:
The Australian inflation drivers behind the 4.6% March reading extend well beyond fuel costs: electricity prices rose 25.4% annually following the lapse of the Energy Bill Relief Fund, new dwelling purchase costs accelerated sharply, and roughly two-thirds of tracked CPI items are rising at an annualised pace above 3%, confirming that cost pressure is broadly spread across household spending categories.
The ABS CPI data for March 2026 confirmed the headline rate reached 4.6% year-on-year, the highest reading since April 2025 and a material upside surprise that immediately hardened market expectations for an extended RBA tightening cycle.
The cost squeeze is visible even in companies reporting solid top-line numbers. Woolworths shares fell approximately 7.5% to 9.8% in late April 2026 after margin warnings, despite the company’s third-quarter update showing sales growth above 4%. Surging fuel and input costs drove the margin compression. Revenue growth alone could not offset the cost environment.
With confidence near multi-year lows and real purchasing power under pressure, the Consumer Discretionary weakness appears structural rather than stock-specific. Individual company quality does not easily offset a demand headwind of this scale.
The second-worst sector by new annual lows was not another consumer-facing category. It was Health Care, a sector long held as a defensive pillar of ASX portfolios.
Five Health Care constituents reached fresh 52-week lows for the week, and the sector registered zero new highs. The absence of any counterbalancing strength within the sector is as telling as the lows themselves.
The severity of the drawdowns stands out. Cochlear closed at $98.77, down 63.1% over the prior year. CSL settled at $124.84, off 50.2%. Declines of that magnitude in large-cap ASX names are rare, and both stocks continue to trend lower despite intermittent bounces. Cochlear rose 1.5% on the week, but that modest gain occurred within a sustained downtrend that has halved the stock’s value.
ResMed fell 7.0% for the week to close at $28.73, down 23.0% over the year. Ansell ended at $26.31 (off 15.7%), and Fisher and Paykel Healthcare closed at $29.61 (down 9.9%).
| Company | Code | Close | Weekly Change | One-Year Return |
|---|---|---|---|---|
| Cochlear | COH | $98.77 | +1.5% | -63.1% |
| CSL | CSL | $124.84 | -4.0% | -50.2% |
| ResMed | RMD | $28.73 | -7.0% | -23.0% |
| Ansell | ANN | $26.31 | New low | -15.7% |
| Fisher and Paykel Healthcare | FPH | $29.61 | New low | -9.9% |
Drawdowns of 50% to 63% in ASX blue-chip Health Care names represent a sector re-rating of significant magnitude. Investors who have held these stocks as defensive positions face a difficult reassessment of whether the forces driving the underperformance are cyclical or longer-term in nature.
Pulling back to the full-market view, the breadth picture is weakened but has not broken down entirely.
The bearish signals are clear:
Stabilising signals remain, however:
The coexistence of 22 new lows and 11 new highs in the same week illustrates a market experiencing sharp internal rotation, not uniform decline. The presence of genuine pockets of strength, particularly in lithium and materials, prevents a blanket bearish reading.
Breadth divergence patterns are not unique to the ASX: in April 2026, the S&P 500 posted a 98th-percentile monthly return while only 23% of its constituents outperformed the benchmark, producing a five-percentage-point gap between the cap-weighted and equal-weighted index that mirrors the dynamic playing out on the ASX 200 in the same period.
The breadth data positions the ASX 200 at an inflection point rather than at a capitulation floor.
While Consumer Discretionary and Health Care accounted for 12 of the 22 new annual lows, company-specific catalysts in other sectors added a second layer of damage.
Industrials contributed three new lows, each with distinct drivers. Cleanaway Waste Management closed at $2.26 (down 13.7% over the year), having reduced guidance citing Middle East-related cost impacts. Austal ended at $4.21, off 17.9%. Fletcher Building settled at $2.39, down 19.3%.
Materials added two names to the list. Orora closed at $1.38 (down 25.7%) after issuing a material earnings downgrade for its Saverglass division, citing volume weakness and an adverse product mix shift toward lower-margin goods in FY26. Amcor ended at $53.47, off 25.8% over the prior year.
The remaining new lows spanned several sectors:
Company-specific guidance cuts layered on top of macro headwinds mean the breadth deterioration is being driven by two independent forces simultaneously. That dual-driver dynamic reduces the likelihood of a rapid breadth recovery even if macro conditions begin to stabilise.
The data from the week ending 1 May 2026 paints a market under genuine stress, but one that has not yet confirmed a trend reversal.
12 of the 22 new annual lows, 55% of the total, were concentrated in just two sectors: Consumer Discretionary and Health Care. That concentration matters. It means the breadth damage, while real, is not yet uniform across the market.
The inflection-point signal: 12 of 22 new annual lows concentrated in two sectors, while 55% of ASX All Ordinaries stocks remain above their 200-day moving average.
Three variables will determine whether the current breadth stress stabilises or deepens. The first is the RBA’s rate trajectory, now complicated by the March CPI print of 4.6% year-on-year. The second is oil prices, with WTI near $111 and Brent near $115, maintaining direct pressure on input costs. The third is whether consumer confidence finds a floor after the April reading of 80.1, or continues declining from already depressed levels.
The RBA rate trajectory is the most consequential of the three inflection-point variables, because the duration of the hold period may matter more for household finances than the size of any single hike: Westpac projects the cash rate reaching 4.85% through a further sequence of increases in June and August 2026, a scenario NAB acknowledges as a credible upside risk if Q2 CPI data confirm second-round oil price pass-through.
The RBA Monetary Policy Board decision released in March 2026 lifted the cash rate target to 4.10%, with the Board citing persistent capacity pressures and above-target inflation as the primary drivers, a stance that the subsequent March CPI print of 4.6% has done nothing to soften.
An index still approximately 5.5% higher over twelve months, with more than half its constituents above long-term moving averages, has not confirmed a broader trend break. But the early warning signals that have historically preceded one are accumulating. The next several weeks of macro data will determine which side of this inflection point the market resolves toward.
This article is for informational purposes only and should not be considered financial advice. Investors should conduct their own research and consult with financial professionals before making investment decisions. Past performance does not guarantee future results.
ASX market breadth measures how many individual stocks are participating in a market move, rather than just the headline index return. It matters because a narrow advance or broad decline in individual stocks can signal hidden weakness or strength that the index level alone does not reveal.
22 ASX 200 constituents, roughly 11% of the index, hit fresh 52-week lows in the week ending 1 May 2026, double the 11 new annual lows recorded the prior week.
Consumer Discretionary led with 7 new 52-week lows, followed by Health Care with 5, while Industrials, Materials, Technology, Consumer Staples, Telecommunications, and Financials each contributed additional names.
Three converging pressures are weighing on Australian consumers: CPI inflation reached 4.6% year-on-year in March 2026, oil prices remain elevated with WTI near $111 and Brent near $115, and consumer sentiment collapsed 12.5% in April 2026 to its lowest reading since the COVID-19 pandemic.
The breadth data positions the ASX 200 at an inflection point rather than a confirmed breakdown; more than 55% of ASX All Ordinaries stocks still trade above their 200-day moving average, and the week produced 11 new 52-week highs alongside the 22 new lows, suggesting rotation rather than uniform decline.