
How NAB’s ROE Beats Peers Despite a Below-Average Margin
18 mins ago

National Australia Bank reported a 6.4% expansion in underlying profit for the first half of FY2026, yet its share price slipped roughly 1% on results day, closing at approximately $39.36. The gap between those two numbers is the story. NAB’s half-year disclosures, released on 4 May 2026, reveal a bank actively reshaping its balance sheet: a $300 million forward-looking provision tied to Middle East conflict disruption, a discounted and partially underwritten dividend reinvestment plan projected to generate approximately $1.8 billion in capital, and a software capitalisation policy change that carved $949 million out of reported earnings. This NAB stock analysis unpacks the mechanics behind those moves, compares NAB’s capital position to its major bank peers, and identifies the specific indicators retail investors should monitor through the second half of FY2026.
The share price reaction on 4 May 2026 was not a rejection of NAB’s operational progress. It was a signal that investors were reading past the headline figure to the adjusted numbers underneath.
Reported cash earnings came in at $2.64 billion, but that figure includes a $949 million after-tax charge from a revision to NAB’s software capitalisation policy, a large notable item that distorts the underlying picture. Adjusted cash earnings, stripping out that charge, reached $3.59 billion, up 2.3% versus the second half of FY2025.
The operative number for investor analysis: Adjusted cash earnings of $3.59 billion, up 2.3% on the prior half, represent NAB’s underlying earnings trajectory once the software capitalisation policy revision is excluded.
Revenue grew 3.1% versus H2 FY2025, and underlying profit expanded 6.4%. The key metrics in summary:

The market’s negative reaction reflected forward-looking concerns, not a dismissal of operational execution. Investors who anchor on the $2.64 billion reported figure without adjusting for the software capitalisation item will misread the trajectory of NAB’s earnings power.
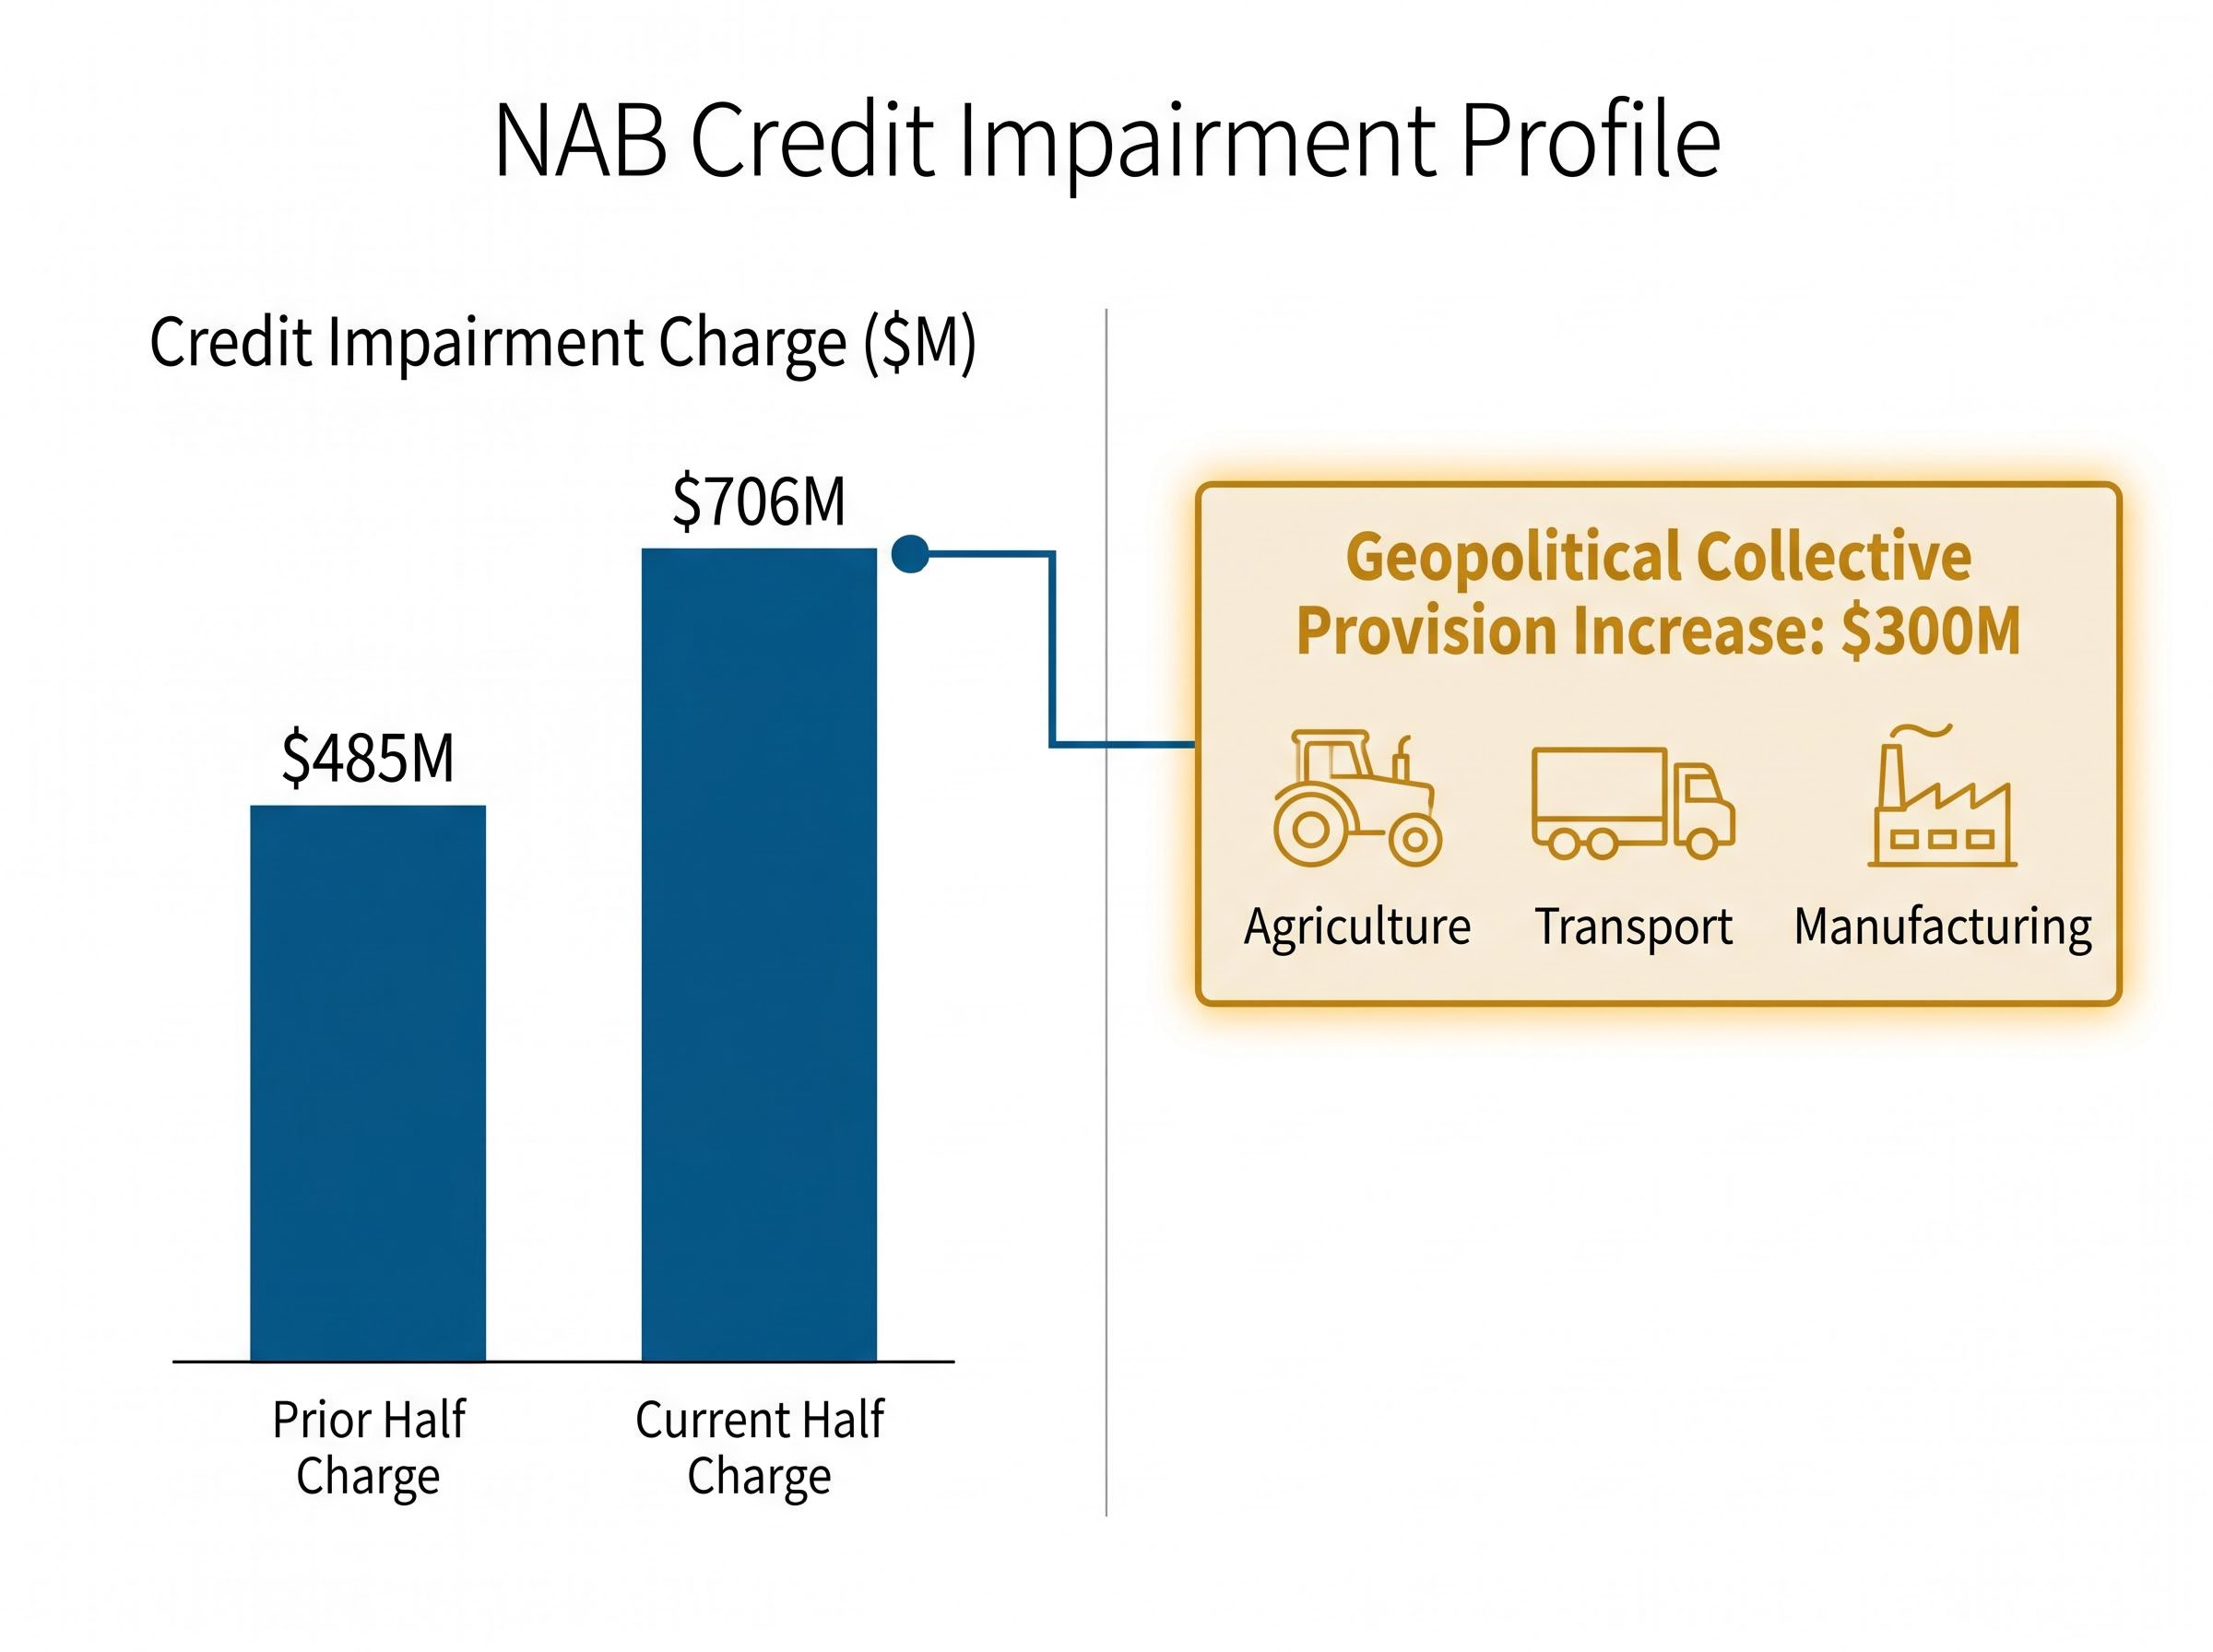
NAB’s total credit impairment charge for the half reached $706 million, up from $485 million in the preceding half. The headline increase looks alarming in isolation. The composition tells a different story.
| Component | Amount | Versus Prior Half | Driver |
|---|---|---|---|
| Total credit impairment charge | $706M | Up from $485M | All components inclusive |
| Geopolitical collective provision increase | $300M | Net increase | Middle East conflict, forward-looking |
| Underlying impairments | Balance of total charge | Improved trends | Standard credit loss experience |
The $300 million net increase in forward-looking collective provisions is the geopolitically driven component. NAB’s credit team identified three sectors in its lending book most exposed to disruption from the Middle East conflict: agriculture, transport, and manufacturing. The collective provisions ratio moved from 1.31% to 1.35%.
The RBA’s March 2026 Financial Stability Review identified geopolitical disruption as a material source of credit risk for Australian banks, providing external validation for the forward-looking provisioning approach NAB adopted in response to Middle East conflict exposure across its agriculture, transport, and manufacturing lending portfolios.
The distinction matters. NAB’s management drew a clear line between underlying asset quality, which actually improved during the half, and the forward-looking buffers it chose to raise. The $300 million does not represent loans that have already deteriorated. It represents management’s assessment of where stress is likely to emerge if the geopolitical disruption persists.
That is a deliberate choice, not a passive accounting entry. Investors who can read provisioning decisions as forward-looking indicators gain an earlier view of credit risk than those who wait for arrears data to confirm it.
Sector-wide provision forecasts from Morgans project total Big Four impairment charges rising from approximately $2.4 billion in FY25 to approximately $5.5 billion by FY27, a trajectory that frames NAB’s $706 million first-half charge not as an isolated decision but as the opening move in what analysts expect to be a multi-year provisioning cycle across the major banks.
Three mechanisms sit at the centre of NAB’s balance sheet strategy this half. Each serves a distinct function in managing capital against uncertainty:
A DRP underwrite is a form of capital raising, not simply a shareholder convenience. The partial underwrite guarantees NAB a minimum capital injection, making the DRP a balance sheet management tool with predictable outcomes.
Understanding these three tools reframes how an investor should interpret NAB’s half-year announcements. The DRP is not a perk. The provisions are not a confession of bad loans. The CET1 target is not an abstract number. Together, they form a coordinated capital management response to an uncertain environment.
NAB reported a CET1 ratio of 11.65% at 31 March 2026. On a pro forma basis, accounting for the discounted DRP proceeds and software capitalisation amortisation impacts, that figure rises to 12.05%.
The distinction between those two numbers is material. The 11.65% is the reported position. The 12.05% is what NAB expects the ratio to reach once the DRP capital flows through. NAB’s stated target is above 12% on a pro forma basis.
APRA’s capital adequacy standards establish the minimum CET1 requirements and buffer thresholds that Australian authorised deposit-taking institutions must maintain, setting the regulatory floor against which NAB’s 11.65% reported ratio and 12.05% pro forma target should be interpreted.
| Bank | CET1 Ratio | Basis | Period |
|---|---|---|---|
| NAB (reported) | 11.65% | Actual | 31 March 2026 |
| NAB (pro forma) | 12.05% | Pro forma (post-DRP) | 31 March 2026 |
| ANZ | 12.39% | Actual | 31 March 2026 |
| Westpac | ~12.57% | Consensus estimate | Early May 2026 |
| CBA | ~12.2% | Estimate | Recent reporting period |
NAB’s pro forma 12.05% sits at the lower end of the major bank peer group. However, a direct comparison requires caution: NAB’s figure is pro forma and projected, while ANZ’s 12.39% is an actual reported figure. Westpac and CBA figures are consensus estimates carrying their own uncertainty. Investors should monitor NAB’s final reported CET1 when the complete ASX announcement data is confirmed.
Big Four sector dynamics in the first half of 2026 reveal a market where stock selection within the banking sector carried more weight than broad sector allocation, with a 10.5 percentage point spread between CBA’s monthly gain and NAB’s monthly decline illustrating that the ASX financials rally was far from uniformly distributed.
For investors assessing NAB’s buffer against a deteriorating credit environment, the gap between a reported 11.65% and a pro forma 12.05% defines whether the bank has meaningful capital flexibility or is managing close to its own floor.
The provisioning and capital management headlines risk crowding out a genuinely strong operational performance in NAB’s core franchise.
Business and Private Banking (BPB) delivered cash earnings of $1.85 billion (excluding the large notable item), up 9.9% on the prior half. This was NAB’s strongest performing segment and the division that most clearly differentiates it from its major bank peers.
Margin-quality signal: NAB’s proprietary channel share of home loan drawdowns rose from 41.4% to 47.7% in a single half, reducing reliance on broker-originated loans and improving the margin profile of new home lending.
The interim dividend was declared at 85 cents per share, fully franked, with an adjusted payout ratio of 72.5%. For income-focused investors, the dividend remains unchanged from the prior period.
NAB’s income thesis entering the May 2026 results centred on a grossed-up yield of approximately 5.81% and a net interest margin of 1.80%, both of which were predicated on credit impairment charges remaining contained, a condition the $706 million actual charge now tests in real terms.
Not all divisions contributed equally. NZ dollar depreciation generated an $81 million decline in net operating income from New Zealand operations, partially offsetting the domestic gains. The currency headwind is a factor investors with exposure to NAB’s trans-Tasman earnings should monitor.
Three balance sheet decisions define NAB’s first half of FY2026: the $300 million geopolitical provision, the DRP-driven CET1 management strategy, and the underlying profit growth of 6.4%. Read together, they form a coherent signal. NAB’s management is positioning the bank for a macro environment where credit stress from geopolitical disruption is a base case, not a tail risk.
Franking credit compounding through a DRP can produce total returns that diverge significantly from price chart performance, a dynamic that pension-phase superannuation investors should model explicitly when assessing whether NAB’s 85 cent fully franked dividend represents a meaningful yield advantage over what headline comparisons suggest.
The analyst consensus prior to the results release reflected a measured view of this positioning. Fourteen analysts covering NAB carried a consensus “Underperform” rating with a 12-month price target of approximately $39.89, against a share price of approximately $39.67 at the time of reporting. The price target range spanned from $30.00 to $50.50.
Analyst consensus (pre-release): “Underperform” from 14 analysts, with a 12-month price target of approximately $39.89. Post-release analyst revisions are not yet available; investors should monitor updated broker research for revised targets.
Three specific indicators will determine whether NAB’s risk management thesis proves well calibrated or insufficient through the second half:
Investors who read these balance sheet moves as deliberate risk positioning signals, rather than routine accounting entries, are better placed to assess whether NAB’s capital management is ahead of the credit cycle or catching up to it.
This article is for informational purposes only and should not be considered financial advice. Investors should conduct their own research and consult with financial professionals before making investment decisions. Past performance does not guarantee future results, and financial projections are subject to market conditions and various risk factors. Pre-release figures referenced in this analysis are subject to confirmation via NAB’s official ASX announcement.
A forward-looking collective provision is capital set aside by a bank against anticipated credit stress that has not yet appeared in arrears data. NAB raised a $300 million provision in H1 FY2026 in response to Middle East conflict exposure across its agriculture, transport, and manufacturing lending portfolios.
The market reaction reflected forward-looking concerns rather than a rejection of NAB's operational results, with investors looking past the headline figure to factors including the $706 million credit impairment charge and the bank's capital position relative to peers.
NAB reported a CET1 ratio of 11.65% at 31 March 2026, rising to a pro forma 12.05% after DRP proceeds, which sits at the lower end of the major bank peer group compared to ANZ's reported 12.39% and Westpac's estimated 12.57%.
NAB's DRP allows shareholders to reinvest dividends at a 1.5% discount to market price, reducing cash outflows for the bank, while the partial underwrite guarantees NAB a minimum capital injection of approximately $1.8 billion regardless of shareholder participation rates.
Investors should track three key indicators: whether the $300 million geopolitical provision proves sufficient for credit stress in agriculture, transport, and manufacturing; whether the pro forma 12.05% CET1 ratio is sustained; and whether the 9.9% earnings growth in Business and Private Banking can be maintained.


