KOSPI Drops 10% as Crowded AI Trade Unwinds Across Global Markets
5 hrs ago

Spirit Airlines ceased all operations at 3:00 am ET on 2 May 2026. That same day, Brent crude sat at $107.13 per barrel, and the OPEC+ alliance that had governed global oil supply coordination for nearly a decade was fragmenting in real time, with the UAE having formally departed just 48 hours earlier. The Iran conflict is not a distant energy market event. It is a force actively restructuring US corporate life, from refinery balance sheets to airline gate assignments to the Federal Reserve’s ability to ease monetary policy.
Iran’s Strait of Hormuz blockade, initiated on 4 March 2026, has now persisted for two months with no diplomatic resolution in sight. Iran’s 14-point proposal was met with scepticism by the Trump administration as of 3 May 2026. The conflict has moved through three distinct transmission channels: physical supply disruption, corporate earnings distortion, and central bank policy paralysis. What follows is a structured framework for understanding how a single geopolitical choke point is simultaneously reshaping oil company financials, destroying airline economics, fracturing OPEC+, and removing the Federal Reserve’s room to cut rates.
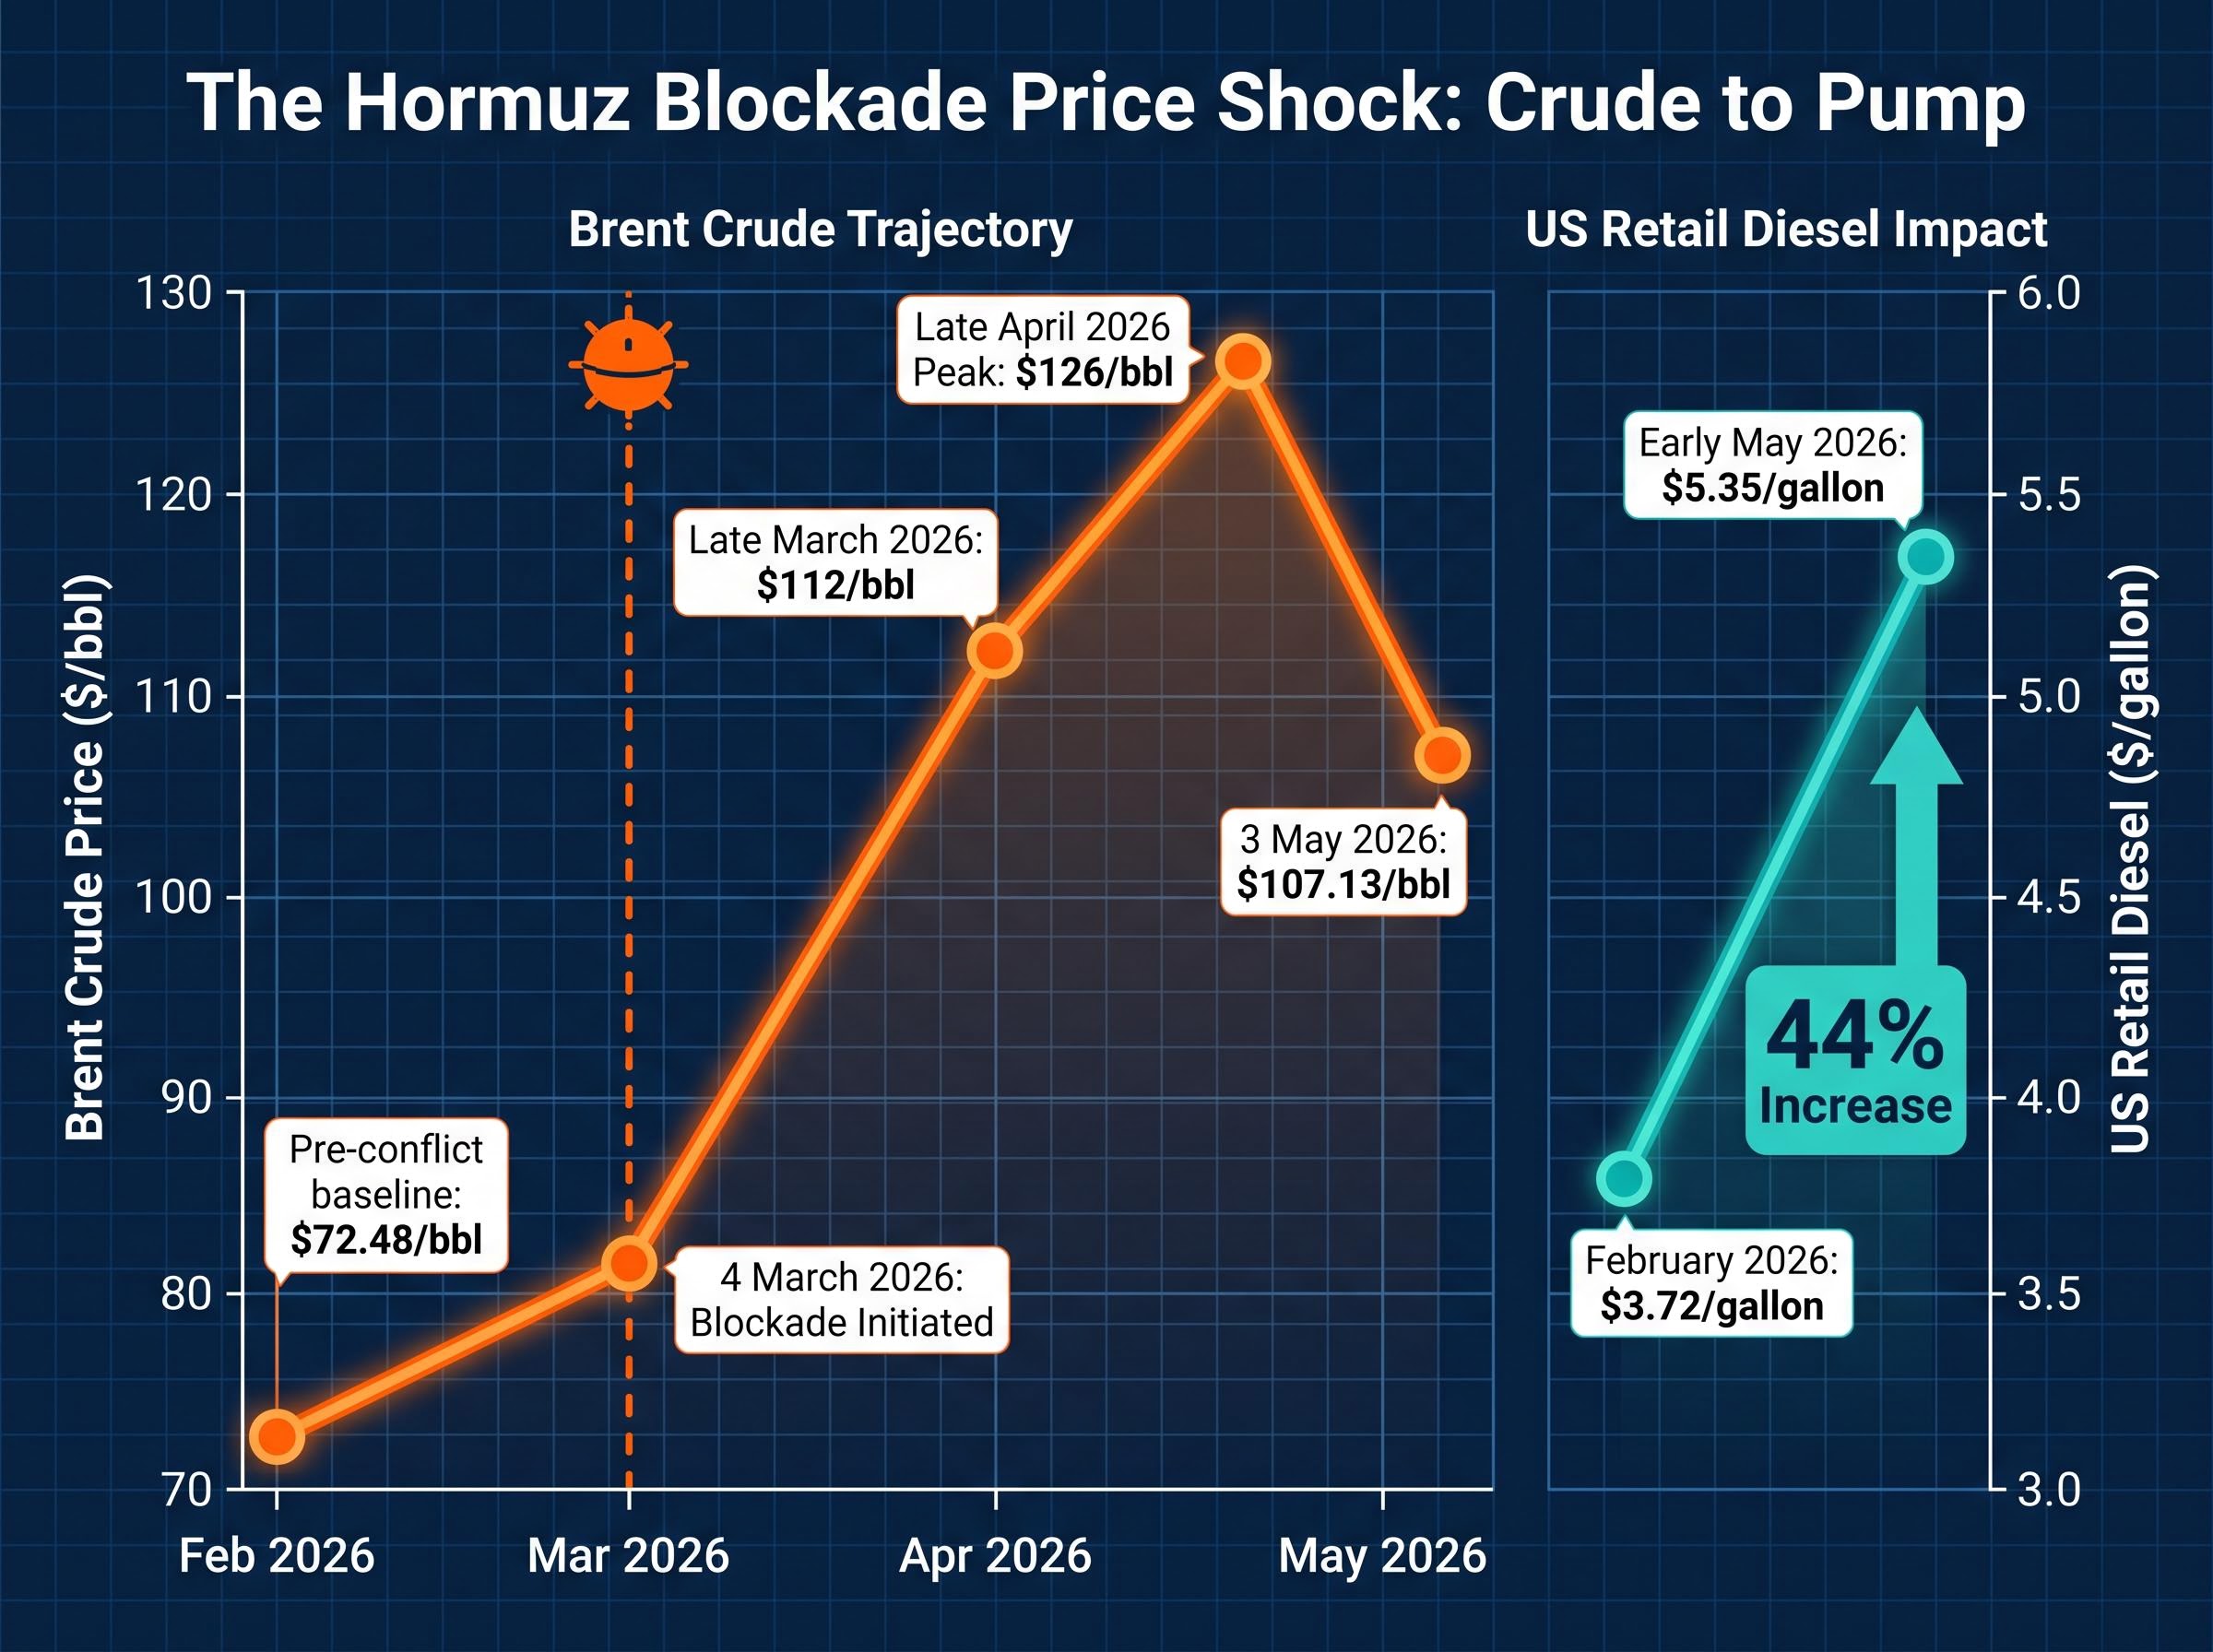
The International Energy Agency (IEA) has characterised the Strait of Hormuz blockade as the largest supply shock on record. The numbers bear that out. Approximately 10.1 million barrels per day have been removed from global production, representing 10-12% of worldwide output and roughly 25% of all seaborne oil trade. The scale of that removal produced a price trajectory that moved in two distinct stages, not one:
The supply removal is not simply a consequence of Iranian action; it reflects a Hormuz triple lock combining US naval blockade operations, Iranian toll enforcement on non-US and non-Israeli vessels, and the near-total withdrawal of commercial war risk insurance coverage, each layer independently capable of suppressing transit even if the others eased.
The decline from $126 to $107 does not represent recovery. It represents a market still processing uncertainty around the blockade’s duration, with prices stabilising at a level that is still 48% above the pre-conflict baseline. A 55% peak increase from $72.48 constitutes a structural repricing of global energy costs, not a volatility event.
Vitol CEO Russell Hardy noted on 21 April 2026 that 600-700 million barrels had already been absorbed by the disruption, projecting losses of 1 billion barrels under a prolonged blockade scenario.
The supply loss transmitted directly into US fuel costs. Retail diesel prices rose from approximately $3.72 per gallon in February 2026 to approximately $5.35 per gallon by early May 2026, a 44% increase. That diesel figure is not just a consumer cost. It is the direct input price driver for both aviation fuel and freight, which means every earnings revision and corporate collapse covered in the sections that follow traces back to this single transmission mechanism.
The UAE’s departure from OPEC+, effective 1 May 2026, arrived with the appearance of a crisis-driven defection. The analytical reality is more measured. The UAE, OPEC’s third-largest producer as of February 2026 (behind Saudi Arabia and Iraq), had been operating above its quota ceiling and had strategic incentives to position outside the alliance’s constraints before the conflict accelerated the timeline.
The remaining seven members tell a different story about the alliance’s durability. Russia formally stated it has no plans to leave OPEC+ and expects no price war. Saudi Arabia, despite sustaining attacks on its Ras Tanura refinery (550,000 barrels per day capacity) since late February 2026, has aligned with continued alliance coordination.
The June production decision signals careful optics management. The table below shows how the remaining members are calibrating output:
| Month | Participating Members | Output Increase (bpd) | Key Context |
|---|---|---|---|
| May 2026 | Seven members (excluding UAE’s share) | 206,000 | Final month with UAE technically in alliance |
| June 2026 | Seven members post-UAE exit | 188,000 | Smaller increase despite rising prices; managing supply carefully amid infrastructure damage |
The remaining seven member nations are:
The OPEC+ fracture matters beyond headline politics because it signals that sustained high oil prices may not be accompanied by coordinated supply management, creating unpredictable pricing dynamics for companies and consumers planning around energy costs.
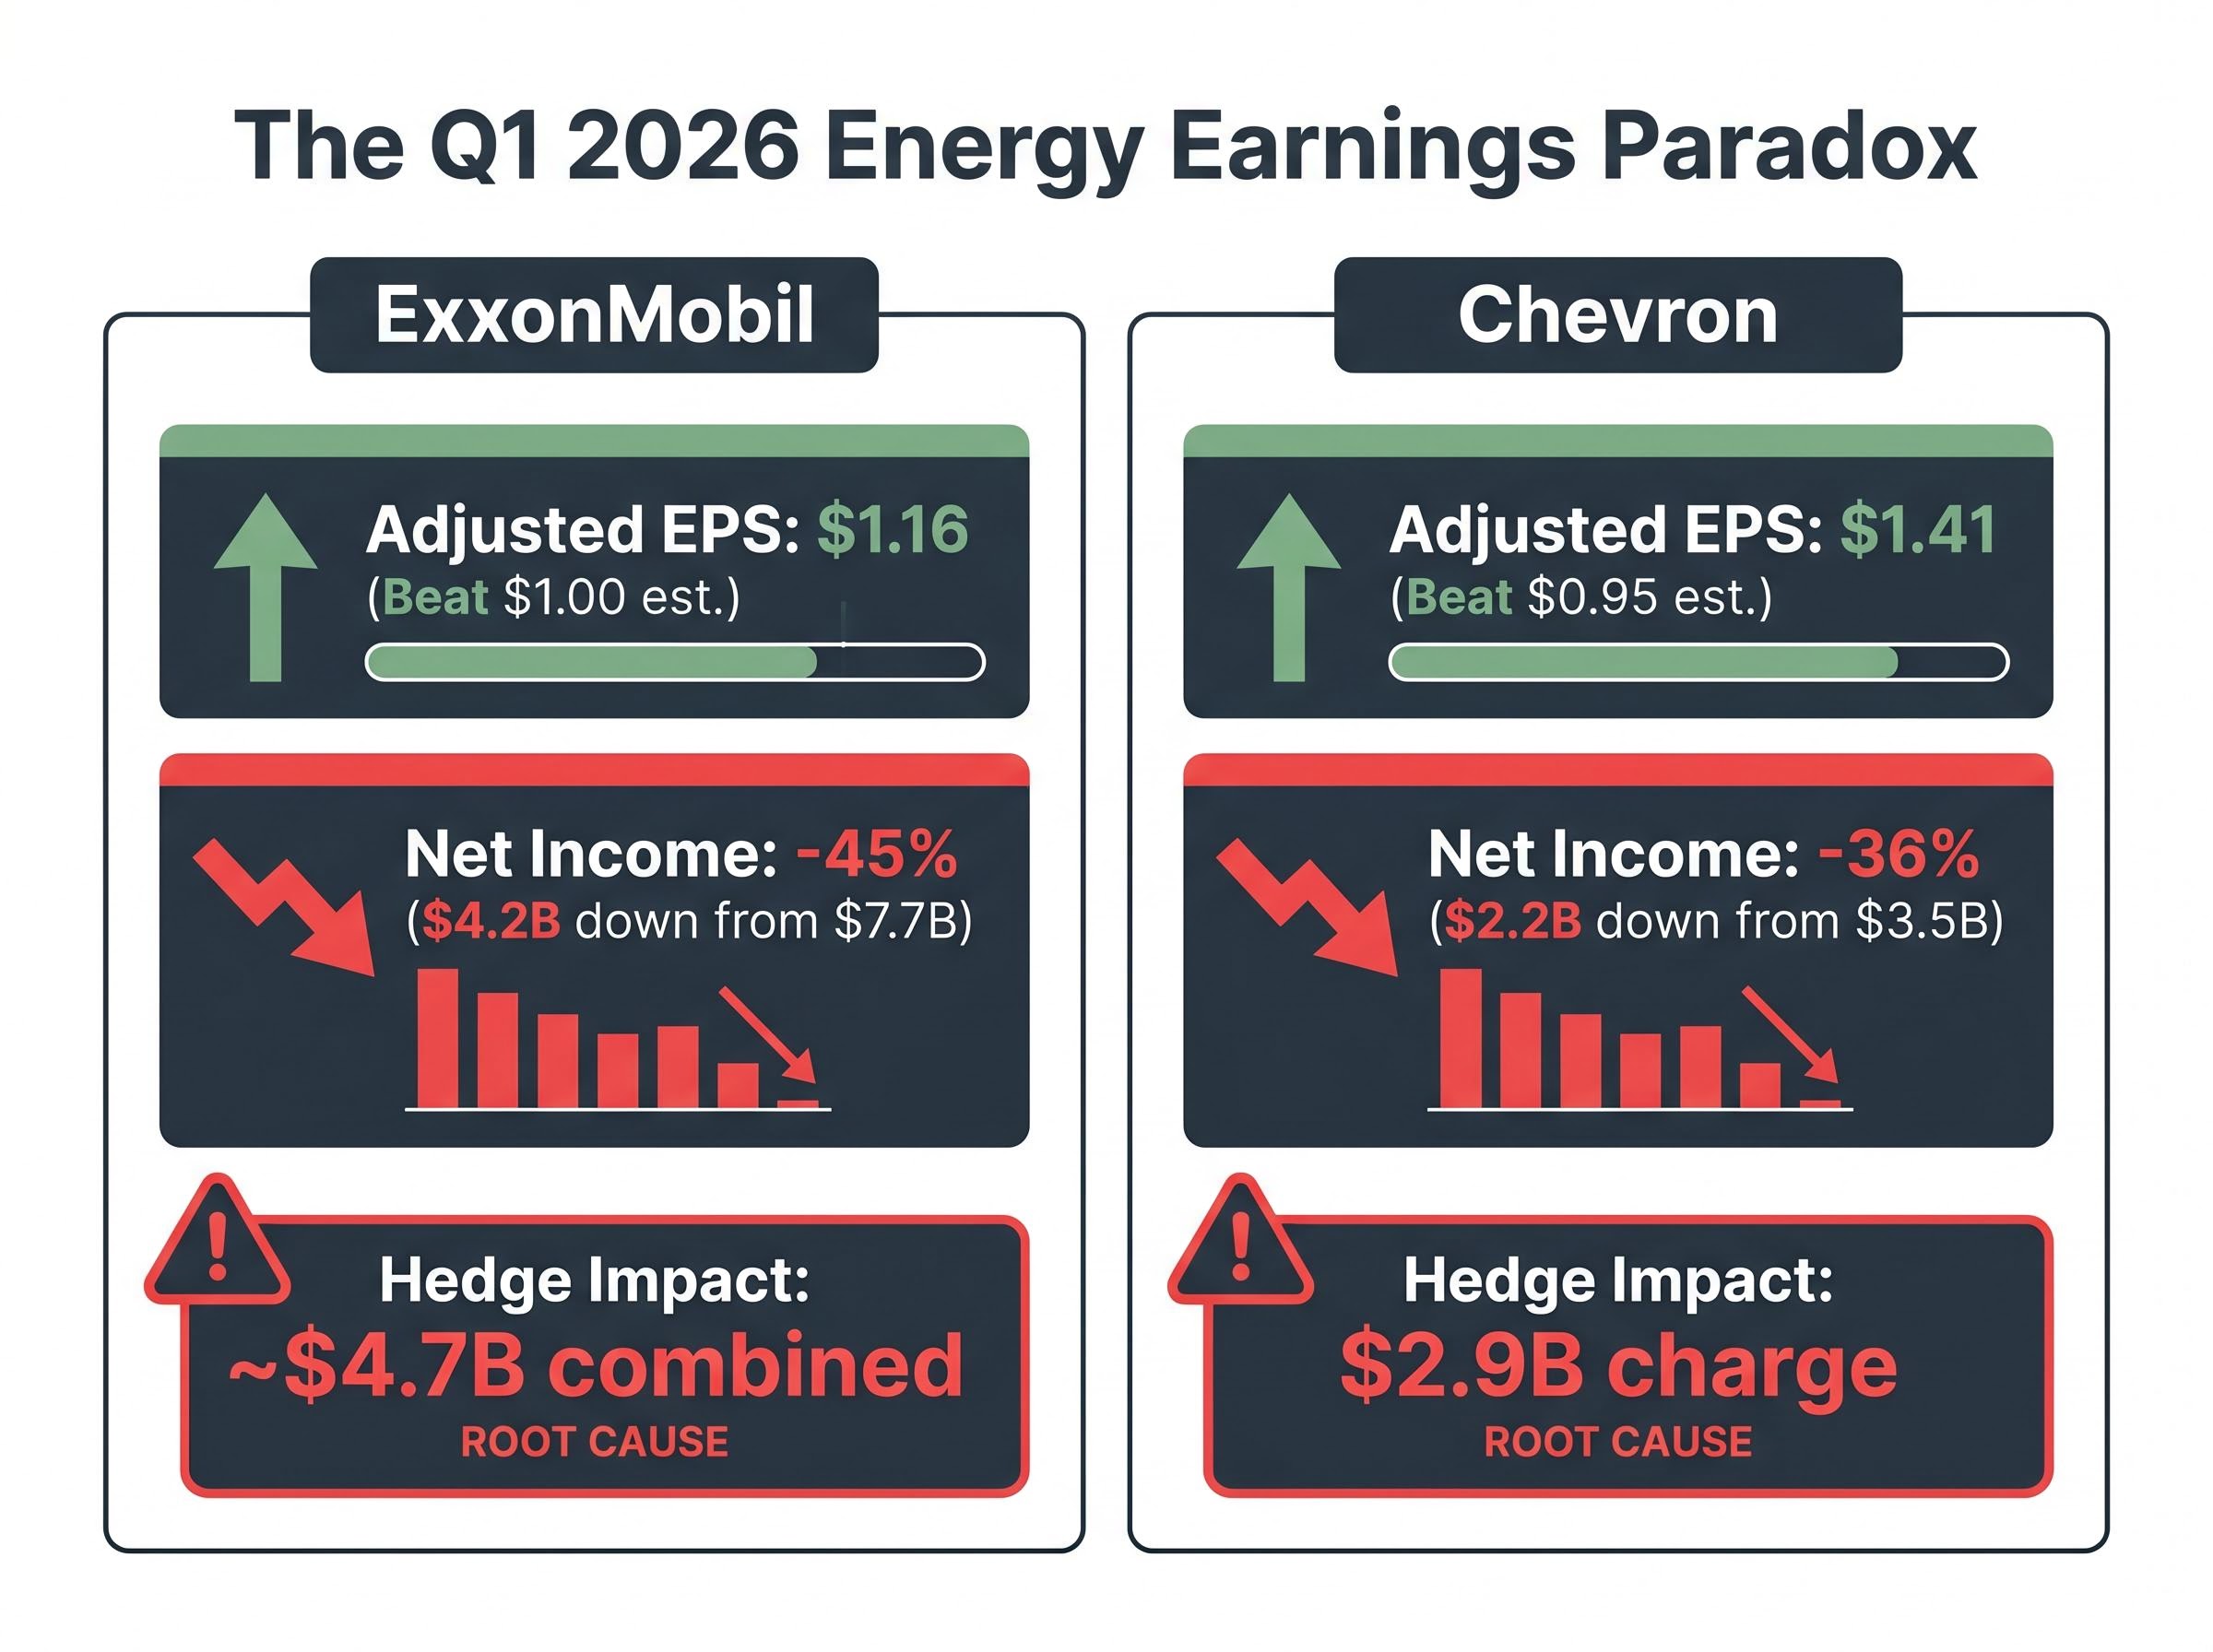
Both ExxonMobil and Chevron beat first-quarter earnings estimates convincingly. Both also posted year-on-year net income declines of 36-45%. The paradox resolves through one mechanism: hedging.
Exxon reported Q1 2026 adjusted earnings per share of $1.16, beating the $1.00 consensus estimate by 16%, on revenue of $85.14 billion (above the $82.18 billion estimate). Yet net income fell 45% to $4.2 billion, down from $7.7 billion a year earlier. The gap is explained by approximately $4 billion in hedge timing effects plus $700 million on closed hedging positions. These were risk management programmes designed for a pre-conflict price environment; when Brent moved from $72 to $126, the hedges that locked in lower prices became costly.
Chevron delivered an even larger earnings surprise: adjusted EPS of $1.41 versus the $0.95 estimate, a 48% beat and the company’s largest since October 2020. Revenue of $48.61 billion missed the $52.1 billion estimate by 7%, and net income fell 36% to $2.2 billion from $3.5 billion. A $2.9 billion financial hedge charge accounts for the divergence. Production, meanwhile, rose 15% to approximately 3.9 million barrels per day, and Chevron returned $6 billion to shareholders during the quarter.
| Metric | ExxonMobil Q1 2026 | Chevron Q1 2026 |
|---|---|---|
| Adjusted EPS (actual vs. estimate) | $1.16 vs. $1.00 (+16%) | $1.41 vs. $0.95 (+48%) |
| Net Income Change (YoY) | -45% ($4.2B from $7.7B) | -36% ($2.2B from $3.5B) |
| Hedge Impact | ~$4.7B combined | $2.9B charge |
| Production Change | Segment profit -15% to $5.74B | +15% to ~3.9M bpd; segment profit +4% |
ExxonMobil CEO Darren Woods flagged that approximately 15% of the company’s production is affected by the conflict, with Middle East output potentially falling 750,000 barrels per day if the Strait remains closed throughout Q2 2026.
For investors holding energy equities, Q2 represents the real test: it will reveal whether the conflict translates into the windfall that the sector’s year-to-date equity gains imply, or whether hedge losses continue to suppress reported earnings.
Spirit Airlines was already fragile. The sequence that led to its permanent closure on 2 May 2026 was not a single event but a three-stage structural failure, with the Iran conflict delivering the final blow at precisely the point of maximum vulnerability:
Jet fuel prices increased approximately 57% since the 28 February 2026 conflict outbreak, the single cost variable that made Spirit’s recovery plan unviable.
Spirit ranked as the eighth-largest US carrier. Approximately 17,000 workers (including 14,000 direct employees) lost their positions. Some 9,000 flights and 1.8 million seats scheduled for May 2026, representing approximately 2% of domestic US capacity, are permanently gone.
The fuel cost shock hit the survivors almost as hard. American Airlines revised its 2026 EPS forecast to $0.70-$1.30 per share, citing an approximately $4 billion increase in fuel costs. United Airlines cut its 2026 earnings outlook to $7-$11 per share and slashed capacity.
With Spirit gone, four carriers (United, American, Delta, Southwest) now hold approximately 80% of domestic US capacity. Reduced supply and concentrated pricing power mean US consumers will absorb higher airfares regardless of how the conflict resolves.
Beyond the aviation and energy sectors, consumer spending rotation toward discount retailers was already visible in March and April data, with companies like JetBlue and Booking Holdings reporting demand compression while value-oriented chains reported relative outperformance, a dynamic that is directly connected to the same fuel cost channel compressing airline economics.
The Federal Reserve is already discounting tariff-driven inflation in its models. That institutional positioning creates a specific constraint: discounting a second, simultaneous inflation source from energy costs would undermine the Fed’s credibility on its price stability mandate. Fed Chair Jerome Powell has framed the challenge directly, noting that inflation has remained above target for an extended period.
Fed officials including Minneapolis Fed President Neel Kashkari have indicated rate cuts are unlikely in 2026 due to oil-driven inflation. Market pricing now reflects no Fed rate cuts for the remainder of the year, with potential hikes being discussed if the blockade extends. Three committee members dissented on the easing bias at the most recent meeting.
The FOMC dissent at the 29 April meeting was not a single vote but a four-way split, with three hawks opposing the hold as insufficiently tight and one dove arguing for an immediate cut, a fracture that makes reading future committee signals meaningfully harder because the chair cannot rely on an aligned majority to anchor expectations.
Powell’s April 2026 FOMC press conference confirmed that higher energy prices will push up overall inflation in the near term and that the Middle East conflict adds materially to economic uncertainty, providing the committee’s own language for why rate cuts remain off the table.
The Fed’s specific constraint: it cannot simultaneously treat tariff-driven inflation and energy-driven inflation as transitory without losing credibility on its core mandate.
The manufacturing sector data confirms the oil shock is already transmitting broadly into input costs. The ISM Prices Paid index spiked to 84.6 in April 2026, up from 78.3 in March, the highest reading since April 2022 and a three-month increase of 25.6 points. The ISM Manufacturing index itself came in at 52.7, below the 53.2 consensus, with the new orders sub-index at 54.1. Three channels are active:
The European Central Bank (ECB) postponed rate reductions as of 19 March 2026, citing supply shortage inflation, confirming this is not a US-specific constraint. For holders of fixed income or those evaluating refinancing decisions, the rate environment will remain elevated for longer than pre-conflict expectations suggested.
Iran’s 14-point proposal outlines a framework for resolution. The core demands include:
The Trump administration responded sceptically as of 3 May 2026, and the president instructed advisers to prepare for a prolonged blockade scenario. US crude exports meanwhile hit a record 6.44 million barrels per day, contributing to a 6.2 million barrel inventory drawdown. Gasoline inventories declined for the eleventh consecutive week.
The analytical question is not whether resolution comes, but which consequences reverse if it does and which are already permanent:
| Reversible if Blockade Ends | Structurally Permanent |
|---|---|
| Brent crude pricing (compresses toward pre-conflict levels) | Spirit Airlines closure; 17,000 jobs lost |
| Fed rate trajectory (easing path reopens) | 2% domestic airline capacity permanently removed |
| Airline earnings recovery (fuel costs normalise) | UAE exit from OPEC+; alliance architecture altered |
| Manufacturing input cost relief (ISM Prices Paid eases) | Saudi Ras Tanura infrastructure damage |
The four transmission channels covered here, energy supply, corporate earnings, aviation economics, and Fed policy, are not independent stories. Each channel is amplifying the others. Higher oil prices distort energy earnings through hedge losses, raise airline fuel costs to the point of corporate failure, and feed into the inflation data that constrains the Fed from cutting rates.
The single most important variable to monitor is whether the Strait of Hormuz blockade persists beyond Q2 2026. Exxon’s CEO has already flagged a 750,000 barrel per day Middle East output loss if it does. The Fed’s rate trajectory depends directly on whether oil-driven inflation extends or retreats.
Some consequences, however, are already locked in. 17,000 Spirit workers are not returning. 1.8 million May seats are permanently gone. The OPEC+ alliance that existed on 30 April no longer exists. The cascade is still moving, and not all of what it has already broken can be rebuilt.
Investors weighing whether current energy equity gains are sustainable will find our full explainer on oil shocks and stock market returns, which examines S&P 500 performance in the 12 months following the 2008, 2011, and 2022 oil price crossings above $100, alongside Goldman Sachs and Morgan Stanley positioning data specific to the current disruption.
This article is for informational purposes only and should not be considered financial advice. Investors should conduct their own research and consult with financial professionals before making investment decisions. Past performance does not guarantee future results. Financial projections are subject to market conditions and various risk factors.
The Iran conflict has driven Brent crude from roughly $72.48 to over $107 per barrel, raising fuel and input costs across industries, contributing to Spirit Airlines' permanent closure, distorting energy company earnings through hedge losses, and removing the Federal Reserve's ability to cut interest rates in 2026.
Iran's Strait of Hormuz blockade, initiated on 4 March 2026, removed approximately 10.1 million barrels per day from global supply, driving Brent crude from a pre-conflict baseline of $72.48 per barrel to a peak of around $126 per barrel before settling near $107.13 as of 3 May 2026, still 48% above pre-conflict levels.
Spirit Airlines permanently ceased operations on 2 May 2026 after jet fuel prices rose approximately 57% following the Iran conflict outbreak, destroying the cost assumptions of its post-bankruptcy recovery plan and causing a proposed $500 million government bailout to collapse when creditors rejected the equity control terms.
Fed officials including Minneapolis Fed President Neel Kashkari have indicated rate cuts are unlikely in 2026 due to oil-driven inflation, and market pricing now reflects no cuts for the remainder of the year, with potential hikes being discussed if the blockade extends.
Both companies beat Q1 2026 earnings estimates but reported year-on-year net income declines of 36-45%, because pre-conflict hedging programmes locked in lower oil prices that became costly liabilities when Brent surged; Exxon absorbed roughly $4.7 billion in combined hedge impacts and Chevron took a $2.9 billion hedge charge.