
Why an 11% Yield Fund Left Investors $20,000 Behind
12 hrs ago
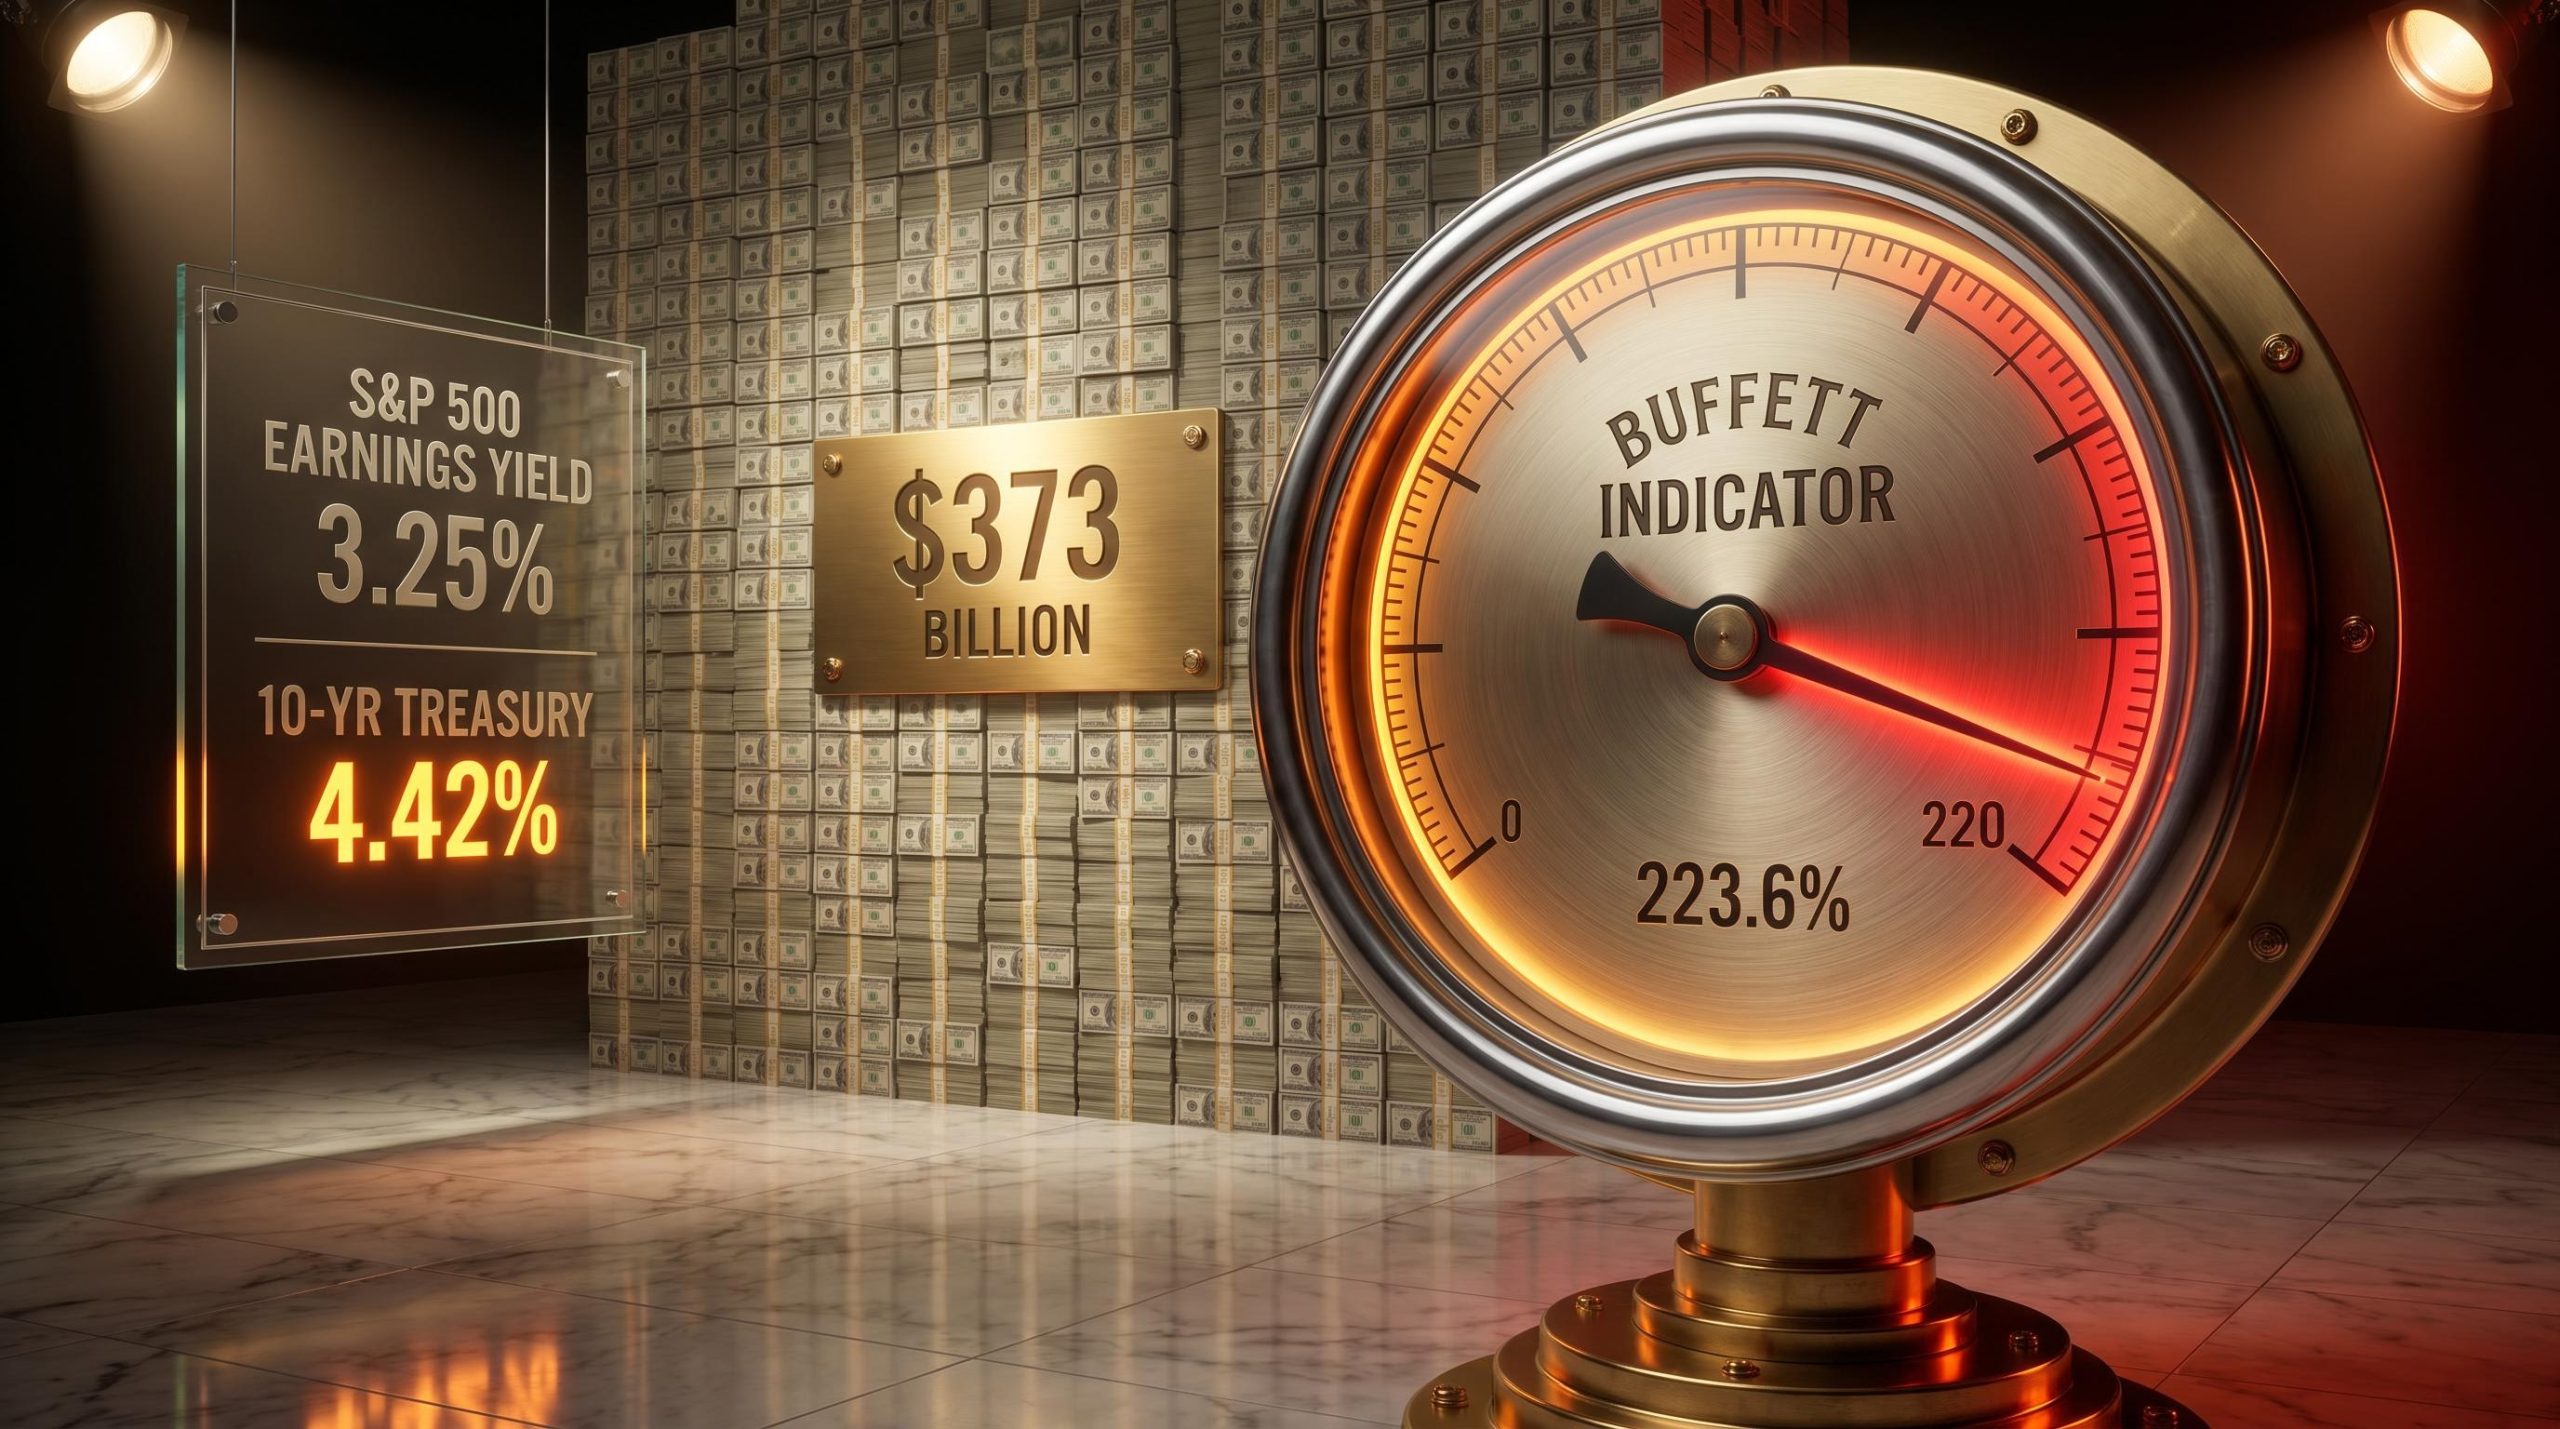
The Buffett Indicator sits at 223.6% as of 1 May 2026, a level that exceeds the peaks recorded during the dot-com bubble and places current US equity valuations roughly 2.4 standard deviations above their long-run historical trend. It is not the only signal flashing caution.
Three widely tracked valuation frameworks are aligned in the same direction: the Wilshire-to-GDP ratio, the gap between equity earnings yields and risk-free Treasury yields, and the near-absence of margin-of-safety buying opportunities in quality businesses. Berkshire Hathaway, under new CEO Greg Abel, continues to hold approximately $373 billion in cash, a posture that itself functions as a market signal.
What follows is an examination of what each valuation signal measures, why they matter in combination, and how individual investors can translate this diagnosis into a concrete positioning strategy: building strategic cash, preparing a pre-researched watchlist, and identifying which real-world signals suggest conditions have shifted.
No single valuation metric carries enough weight to anchor an investment thesis. The significance of the current moment lies in the convergence: three independent frameworks, each measuring a different dimension of market pricing, are pointing in the same direction simultaneously.
The signals are:
223.6%: The Buffett Indicator’s current reading places US equity valuations approximately 2.4 standard deviations above the historical trend, according to GuruFocus and MacroMicro data as of 1 May 2026.
A fourth corroborating data point sits underneath all three. Berkshire’s cash reserve of approximately $373 billion, the largest in US corporate history, reflects a sustained institutional judgment that prevailing prices do not justify large-scale equity deployment. That alignment across frameworks and institutional behaviour is historically rare.
Beyond valuation ratios, corroborating warning signals are accumulating in the physical economy: US average gasoline prices reached $4.25 per gallon in late April 2026, a level exceeded in fewer than 3% of all weeks since 1993 and one that has historically preceded an average 11% S&P 500 decline over the following six months.
The Buffett Indicator divides total US stock market capitalisation by US gross domestic product (GDP). The result expresses the aggregate price of all publicly traded US equities as a percentage of the economy’s annual output. Warren Buffett described it in a 2001 Fortune magazine article as “arguably the most useful single measure” of overall market valuation.
The logic is straightforward. Corporate earnings are a share of GDP. When the total price of equities significantly exceeds the economy’s output, investors are collectively paying a premium that assumes earnings growth will outpace economic growth for an extended period.
Index concentration risk compounds the overvaluation picture: the Magnificent Seven stocks represented approximately 33.7% of S&P 500 market capitalisation by April 2026, meaning a cap-weighted index investor’s exposure to overvalued mega-cap technology is structurally larger than most passive investors recognise.
NBER research on GDP growth expectations and equity returns provides empirical grounding for the Buffett Indicator’s predictive logic, finding that elevated market capitalisation to GDP ratios correlate with lower long-run equity returns, precisely the dynamic the current 223.6% reading implies.
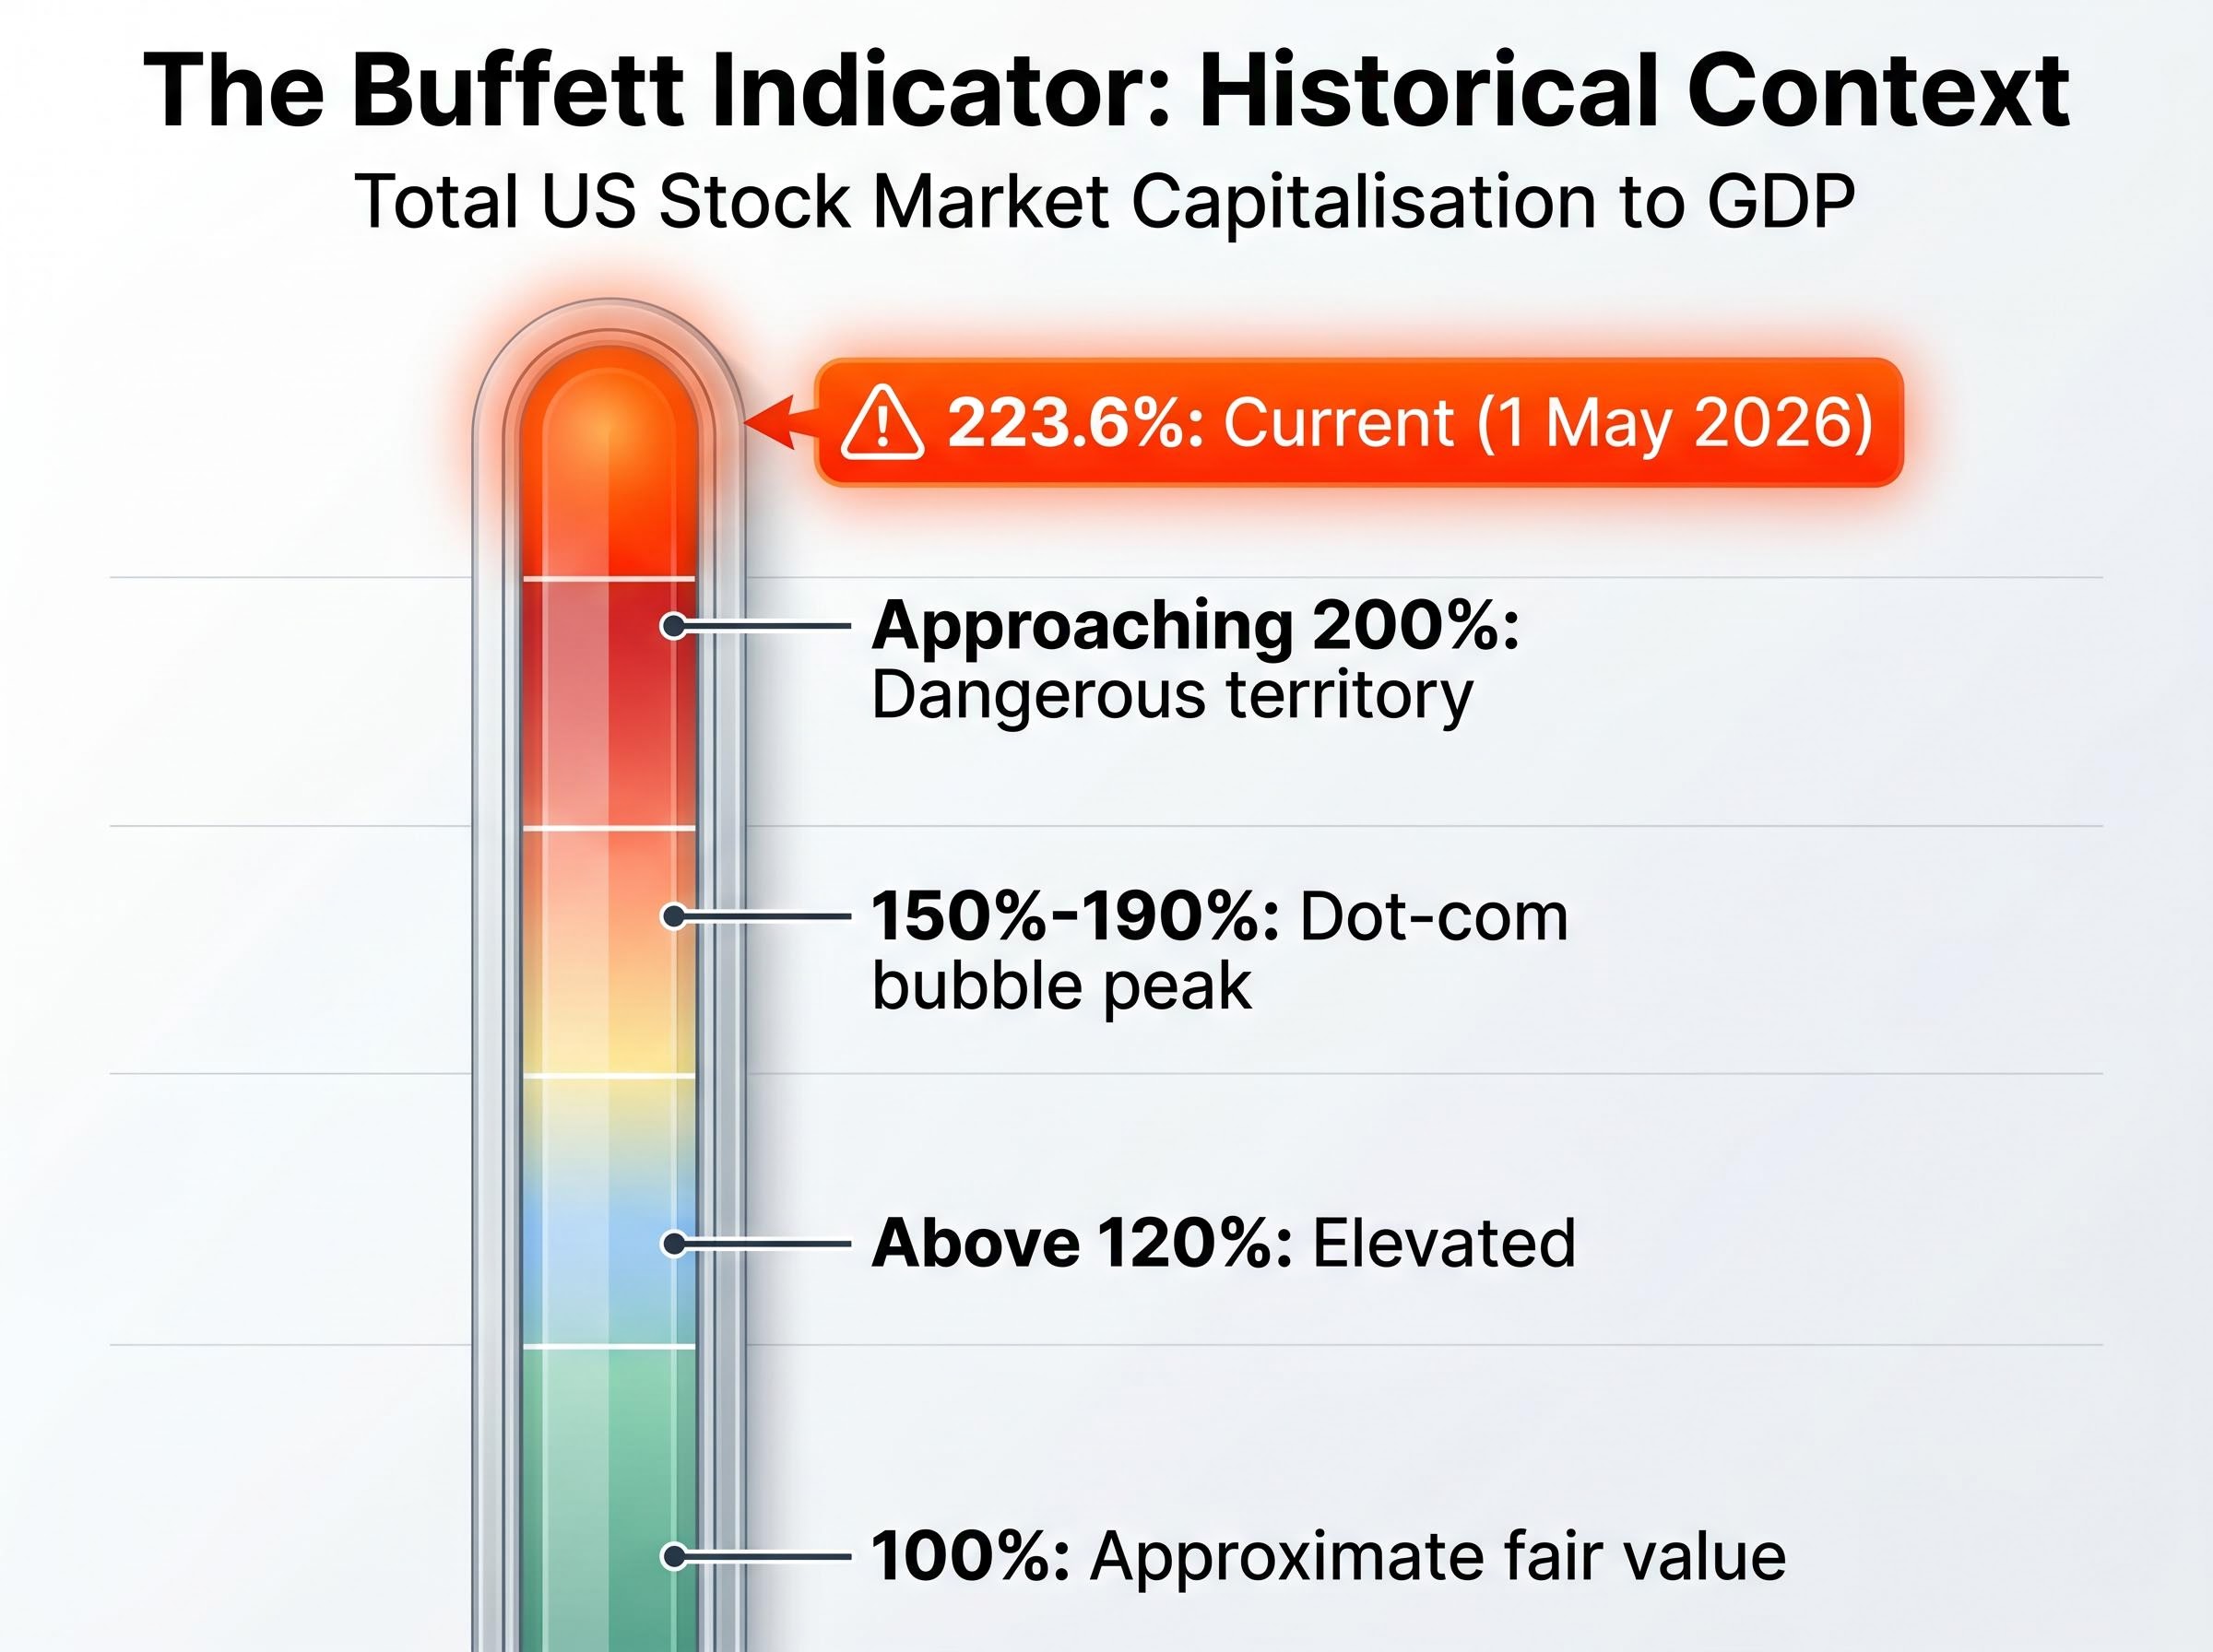
Informal thresholds have emerged over the indicator’s history, outlined below.
| Buffett Indicator Level | Characterisation |
|---|---|
| ~100% | Approximate fair value |
| Above ~120% | Elevated |
| Approaching 200% | Dangerous territory |
| 223.6% (current) | Significantly overvalued |
During the dot-com bubble, the Buffett Indicator peaked at approximately 150-190%, depending on the methodology used (Wilshire 5000 versus broader market capitalisation measures). The current 223.6% reading substantially exceeds those prior peaks by any comparable measure.
A reading of approximately 230% was recorded as of 31 December 2025. The modest decline to 223.6% by 1 May 2026 reflects short-term market movement rather than a meaningful shift in valuation status. At 2.4 standard deviations above the historical trend, the market remains among the most stretched valuations in modern financial history regardless of the precise month-to-month reading.
The macro indicators are telling. The ground-level experience confirms them.
Margin of safety refers to the gap between a business’s estimated intrinsic value and the price at which it trades. When an investor purchases a stock at a meaningful discount to intrinsic value, that gap provides a buffer against errors in the estimate, unexpected earnings declines, or broader market drawdowns. In a richly valued market, that buffer compresses or disappears entirely.
Buffett’s own behaviour illustrated the point. In the roughly 19 months before his retirement, he made no significant new stock purchases despite managing the world’s largest corporate cash reserve. His final shareholder letter indicated he was actively seeking acquisitions but could not identify sufficiently attractive deals at prevailing prices.
Berkshire’s cash reserve exceeded $380 billion at the time of Buffett’s retirement, the largest in US corporate history. That figure was not a passive accumulation. It was the result of a disciplined investor scanning the entire investable universe and concluding that prices did not justify deployment.
The three overvaluation signals now sit side by side:
Goldman Sachs projects the S&P 500 to reach 7,600 by year-end 2026, representing approximately 6% upside from levels at the time of the forecast. The bank cites strong corporate earnings as the primary driver.
The earnings-growth argument carries legitimate weight. Valuation metrics measure what investors are paying today; they do not account for the possibility that earnings could grow into current multiples. Select individual stocks may also offer value even within a broadly elevated market. The overvaluation diagnosis applies at the index level; it does not preclude stock-specific opportunities.
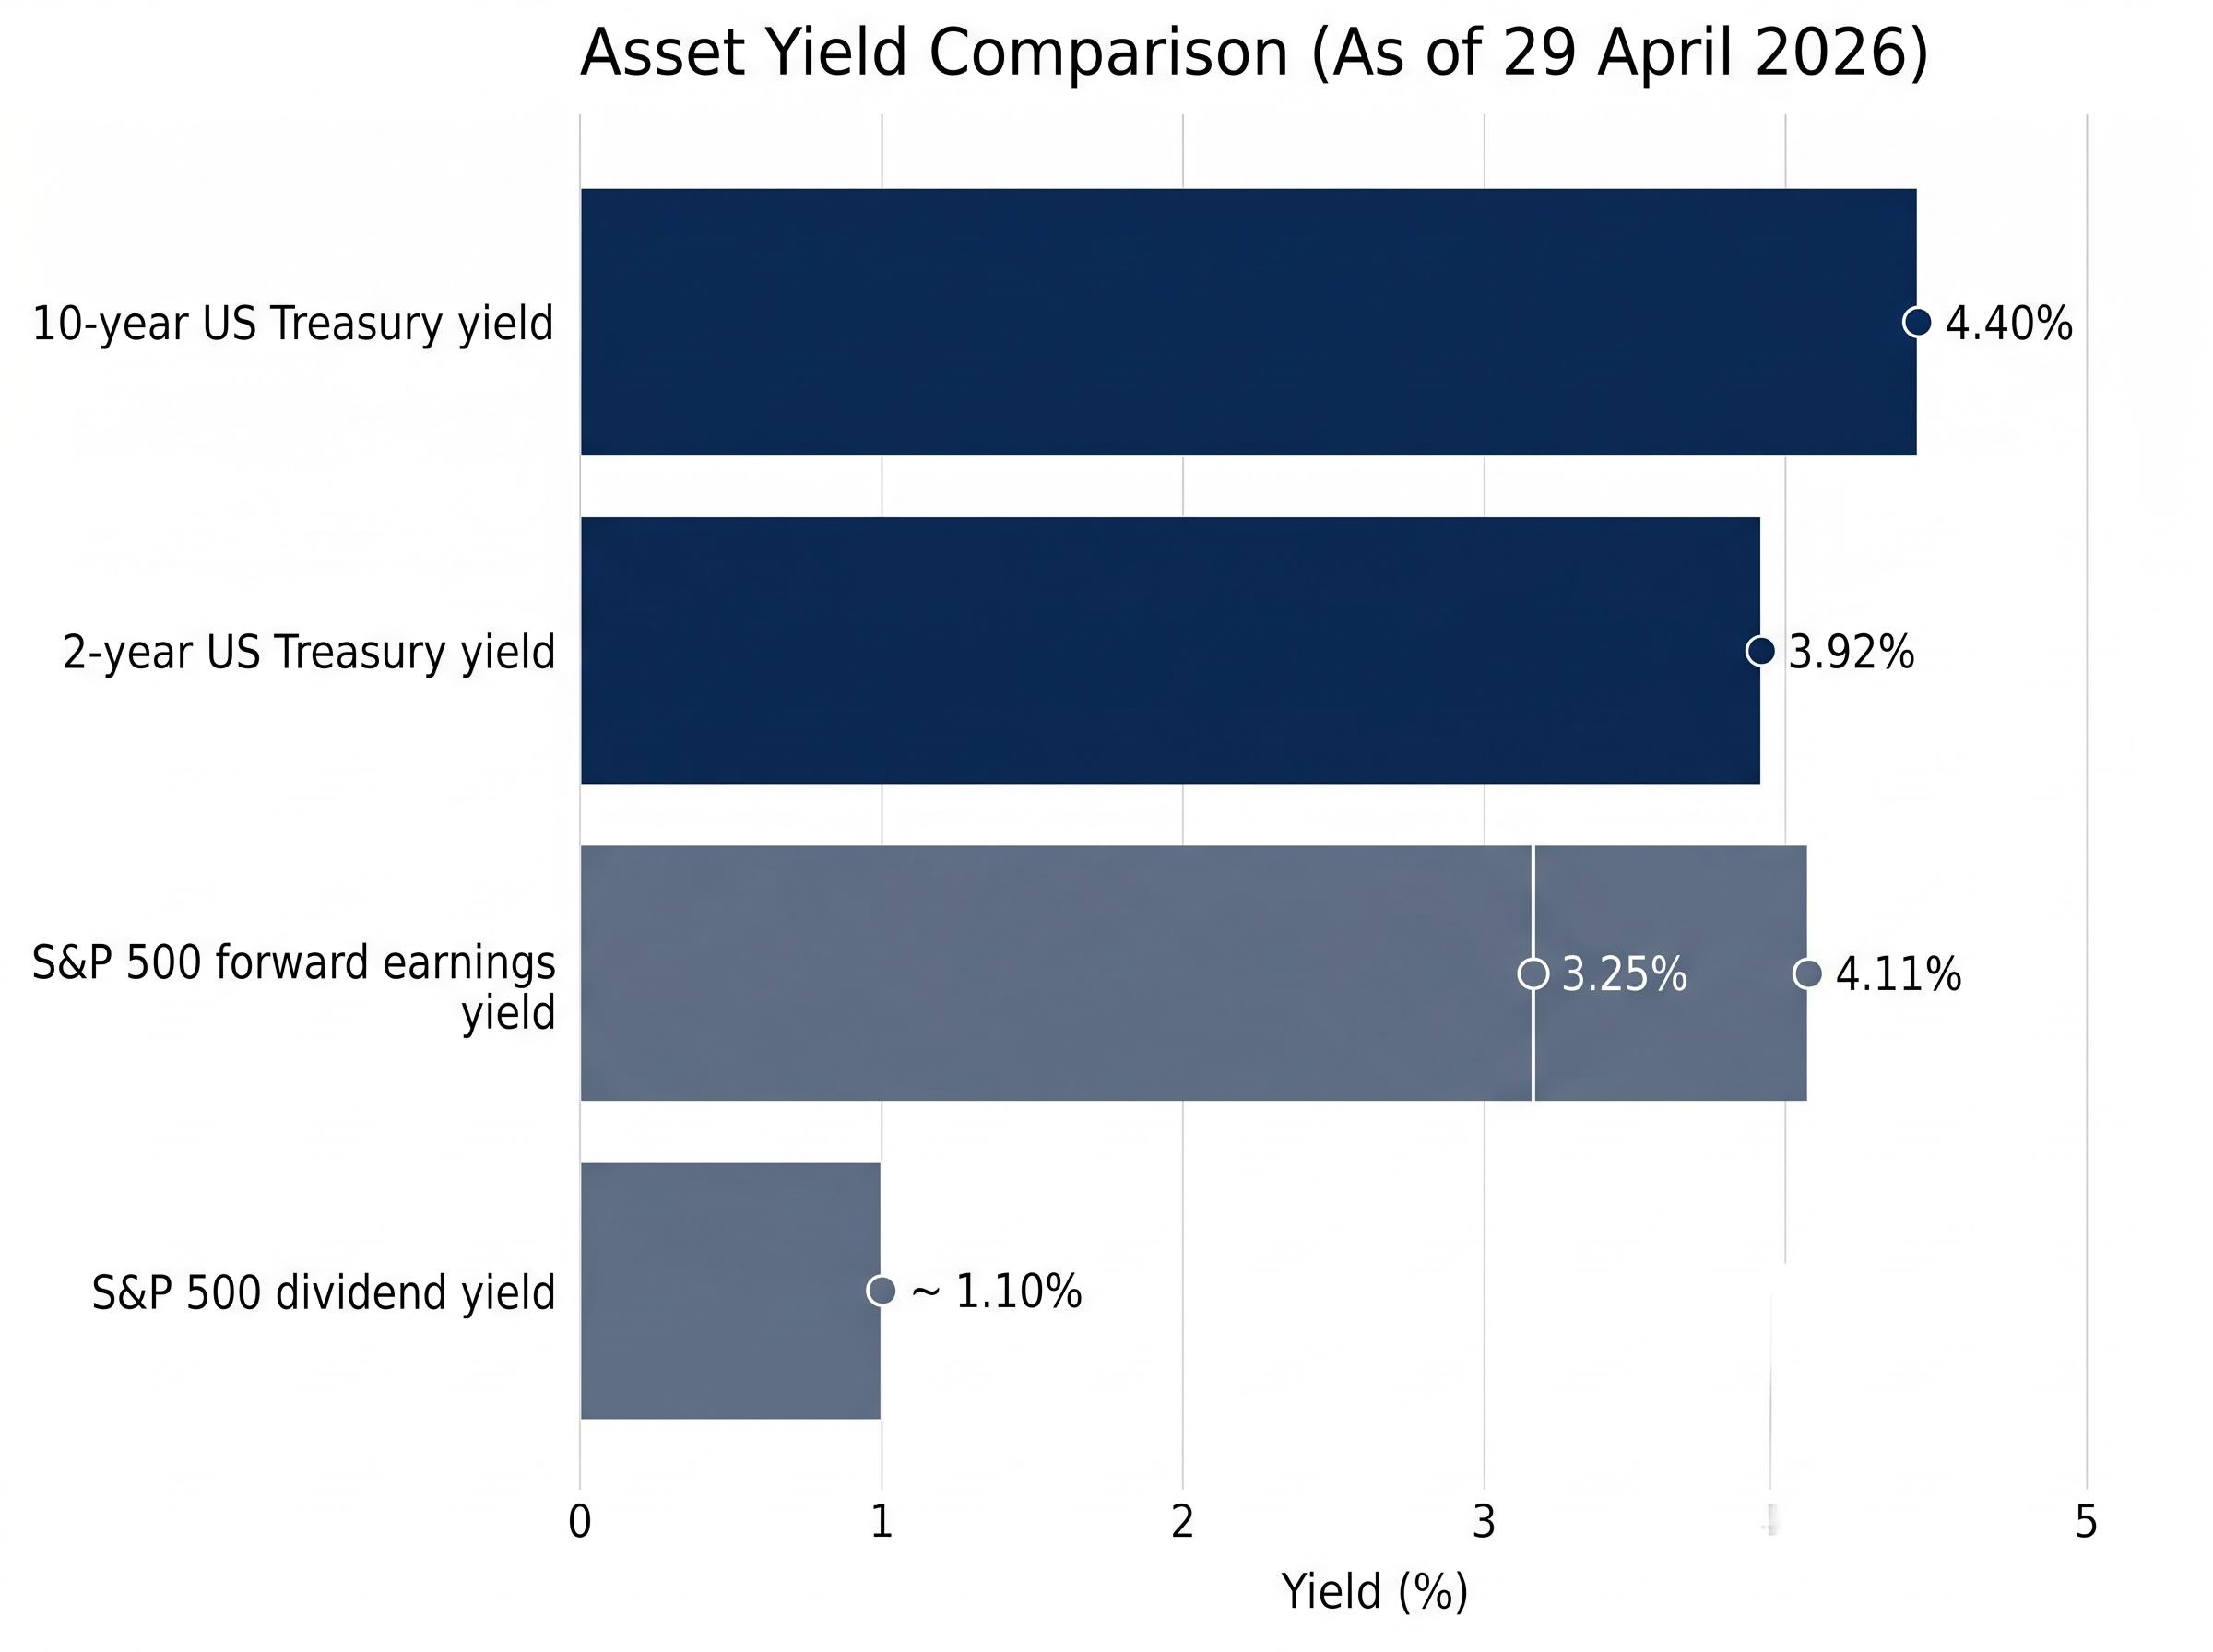
A second framework reinforces the picture. The Fed Model comparison places the S&P 500’s forward earnings yield, the inverse of the price-to-earnings ratio, alongside the 10-year Treasury yield. When Treasury bonds yield more than equities earn, investors are not being compensated for the additional risk that stocks carry over a risk-free government bond.
As of 29 April 2026, the numbers sit as follows.
| Asset | Approximate Yield |
|---|---|
| S&P 500 forward earnings yield | 3.25%-4.11% |
| 10-year US Treasury yield | 4.40%-4.42% |
| 2-year US Treasury yield | 3.88%-3.92% |
| S&P 500 dividend yield | ~1.10% |
The spread is unfavourable for equities on both estimates. Using the lower earnings yield figure (approximately 3.25%, per Multpl), equities yield roughly 115-117 basis points less than the risk-free 10-year rate. Using the higher forward estimate (approximately 4.11%, per GuruFocus), the gap narrows but remains approximately 30 basis points negative.
Either reading means the same thing. A Treasury bond, backed by the US government, currently pays more than the earnings stream investors receive per dollar of equity purchased.
The 10-year Treasury yield signals a risk-compensation problem for equity holders, but the 30-year Treasury yield threshold of 5% carries a separate and arguably larger structural risk: a breach at that level would push 30-year fixed mortgage rates above 8%, widen corporate borrowing costs, and compound a federal deficit already running at approximately 7.2% of GDP.
For years, elevated equity valuations were justified by the argument that “There Is No Alternative” (TINA) to stocks when interest rates sat near zero. At a 4.40%+ 10-year Treasury yield, that justification no longer holds. Risk-free alternatives exist, and they pay more.
This signal has appeared only a limited number of times over the past four decades, and those prior instances have historically preceded significant market declines.
Diagnosis without a response is incomplete. Three sequential actions translate the valuation analysis into a concrete preparation strategy.
Cash held deliberately is not idle capital. It is strategic optionality, the capacity to act when the market eventually offers prices that compensate investors for the risks they are taking.
Berkshire Hathaway’s approximate 20% annualised returns over roughly six decades were built on precisely this discipline: patience during expensive markets, followed by decisive deployment when prices corrected. Abel’s April 2026 deployment of approximately $43 billion into Japanese equities demonstrated that selective capital allocation continues even within a cautious overall posture.
Investors exploring how to structure the deployment of strategic cash reserves once market conditions shift will find our dedicated guide to dollar-cost averaging strategies useful: it examines historical lump-sum versus DCA performance data across market cycles, including the mathematical case for each approach and a hybrid deployment framework for investors managing a windfall or re-entry after a period of elevated cash holdings.
A 13F filing is a quarterly disclosure that institutional investment managers with more than $100 million in qualifying assets must submit to the Securities and Exchange Commission (SEC). It reveals equity holdings, new positions, and changes in position size. Berkshire Hathaway’s 13F filings carry outsized interpretive weight given the firm’s track record and the scale of its current cash reserve.
The specific items to monitor in each quarterly filing:
The current maintenance of approximately $373 billion in cash (as of end-2025 and February 2026) functions as an ongoing signal that conditions have not yet become attractive enough for large-scale US equity deployment. Abel’s $43 billion Japanese equities investment in April 2026 represents selective international allocation, not broad-based US equity buying.
Historical precedent exists for this pattern. Buffett held elevated cash reserves ahead of the 2008-2009 downturn, then deployed capital into Goldman Sachs and Bank of America during the crisis on favourable terms. The signal was not in predicting the bottom; it was in the behavioural shift from accumulation to deployment visible through public filings.
The signal to watch is not an absolute market level. It is the behavioural shift: a pattern of meaningful, sustained US equity deployment by Abel visible through consecutive quarters of 13F filings.
Investors who wait until that deployment pattern is confirmed will act after the signal, not before it. Building a pre-researched watchlist now preserves the ability to move quickly alongside or even ahead of the institutional shift. Preparation before the signal arrives is the actionable takeaway.
Three independent valuation frameworks are aligned. The Buffett Indicator at 223.6% exceeds dot-com peaks. Equity earnings yields trail Treasury yields. The most studied value investor in modern history concluded that prevailing prices did not justify large-scale deployment.
Overvalued markets can remain elevated for extended periods, and no valuation framework reliably predicts timing. What the data does support is a deliberate response: accumulate strategic cash, build a pre-researched watchlist of five to fifteen quality businesses at predetermined buy prices, and monitor Berkshire’s quarterly 13F filings for the deployment signal that conditions have changed.
Preparation is the variable investors control. The market’s timeline is not.
This article is for informational purposes only and should not be considered financial advice. Investors should conduct their own research and consult with financial professionals before making investment decisions. Past performance does not guarantee future results. Financial projections are subject to market conditions and various risk factors.
The Buffett Indicator divides total US stock market capitalisation by GDP to express the aggregate price of all publicly traded US equities as a percentage of annual economic output. Warren Buffett described it in a 2001 Fortune magazine article as arguably the most useful single measure of overall market valuation.
A reading of 223.6% places US equity valuations approximately 2.4 standard deviations above their long-run historical trend and substantially exceeds the dot-com bubble peak of roughly 150-190%, indicating the market is significantly overvalued by this measure.
As of late April 2026, the 10-year US Treasury yield of approximately 4.40%-4.42% exceeds the S&P 500 forward earnings yield of 3.25%-4.11%, meaning risk-free government bonds currently pay more than equities, which removes the traditional justification for accepting equity risk.
The article recommends three sequential steps: monitoring observable valuation signals rather than reacting to headlines, building a strategic cash position to preserve optionality, and constructing a pre-researched watchlist of five to fifteen quality businesses with predetermined buy prices reflecting a margin of safety.
Berkshire Hathaway holds approximately $373 billion in cash, the largest corporate cash reserve in US history, reflecting a sustained institutional judgment that prevailing equity prices do not justify large-scale deployment and functioning as an independent overvaluation signal.


