Castlelake’s 650p easyJet Bid Faces Final Deadline Today
2 hrs ago

Brent crude is trading at $111.35 and WTI at $105.43 as of 1 May 2026, levels that reflect a months-long geopolitical shock still working its way through every corner of financial markets. Two converging pressures are defining the macro environment this week: Iran has reaffirmed its claim over the Strait of Hormuz and threatened retaliatory strikes against U.S. positions, while the yen has retreated toward 157 per dollar despite Japanese intervention.
These are not isolated events. They are connected through risk sentiment, inflation expectations, and how institutional capital is rotating across asset classes. What follows maps exactly how geopolitical risk is being priced across oil, currencies, and equities right now, what the major banks disagree about, and what that divergence signals for investors tracking today’s stock market moves.
Iran’s 30 April warning of retaliatory strikes against U.S. positions came hours after President Trump reiterated the possibility of a naval blockade and U.S. military officials presented new action options to the White House. Three active escalation signals are sustaining oil’s risk premium heading into the weekend:
Iran warned on 30 April 2026 that retaliatory strikes against U.S. positions remained on the table if escalation continued, a statement that kept the geopolitical risk premium active across crude futures heading into the weekend.
The price sitting at $111.35 Brent is already the moderated version of a much sharper shock. Brent peaked near $126 in April before retreating, and the current level reflects a market that has absorbed the worst-case scenario but has not priced it out entirely.
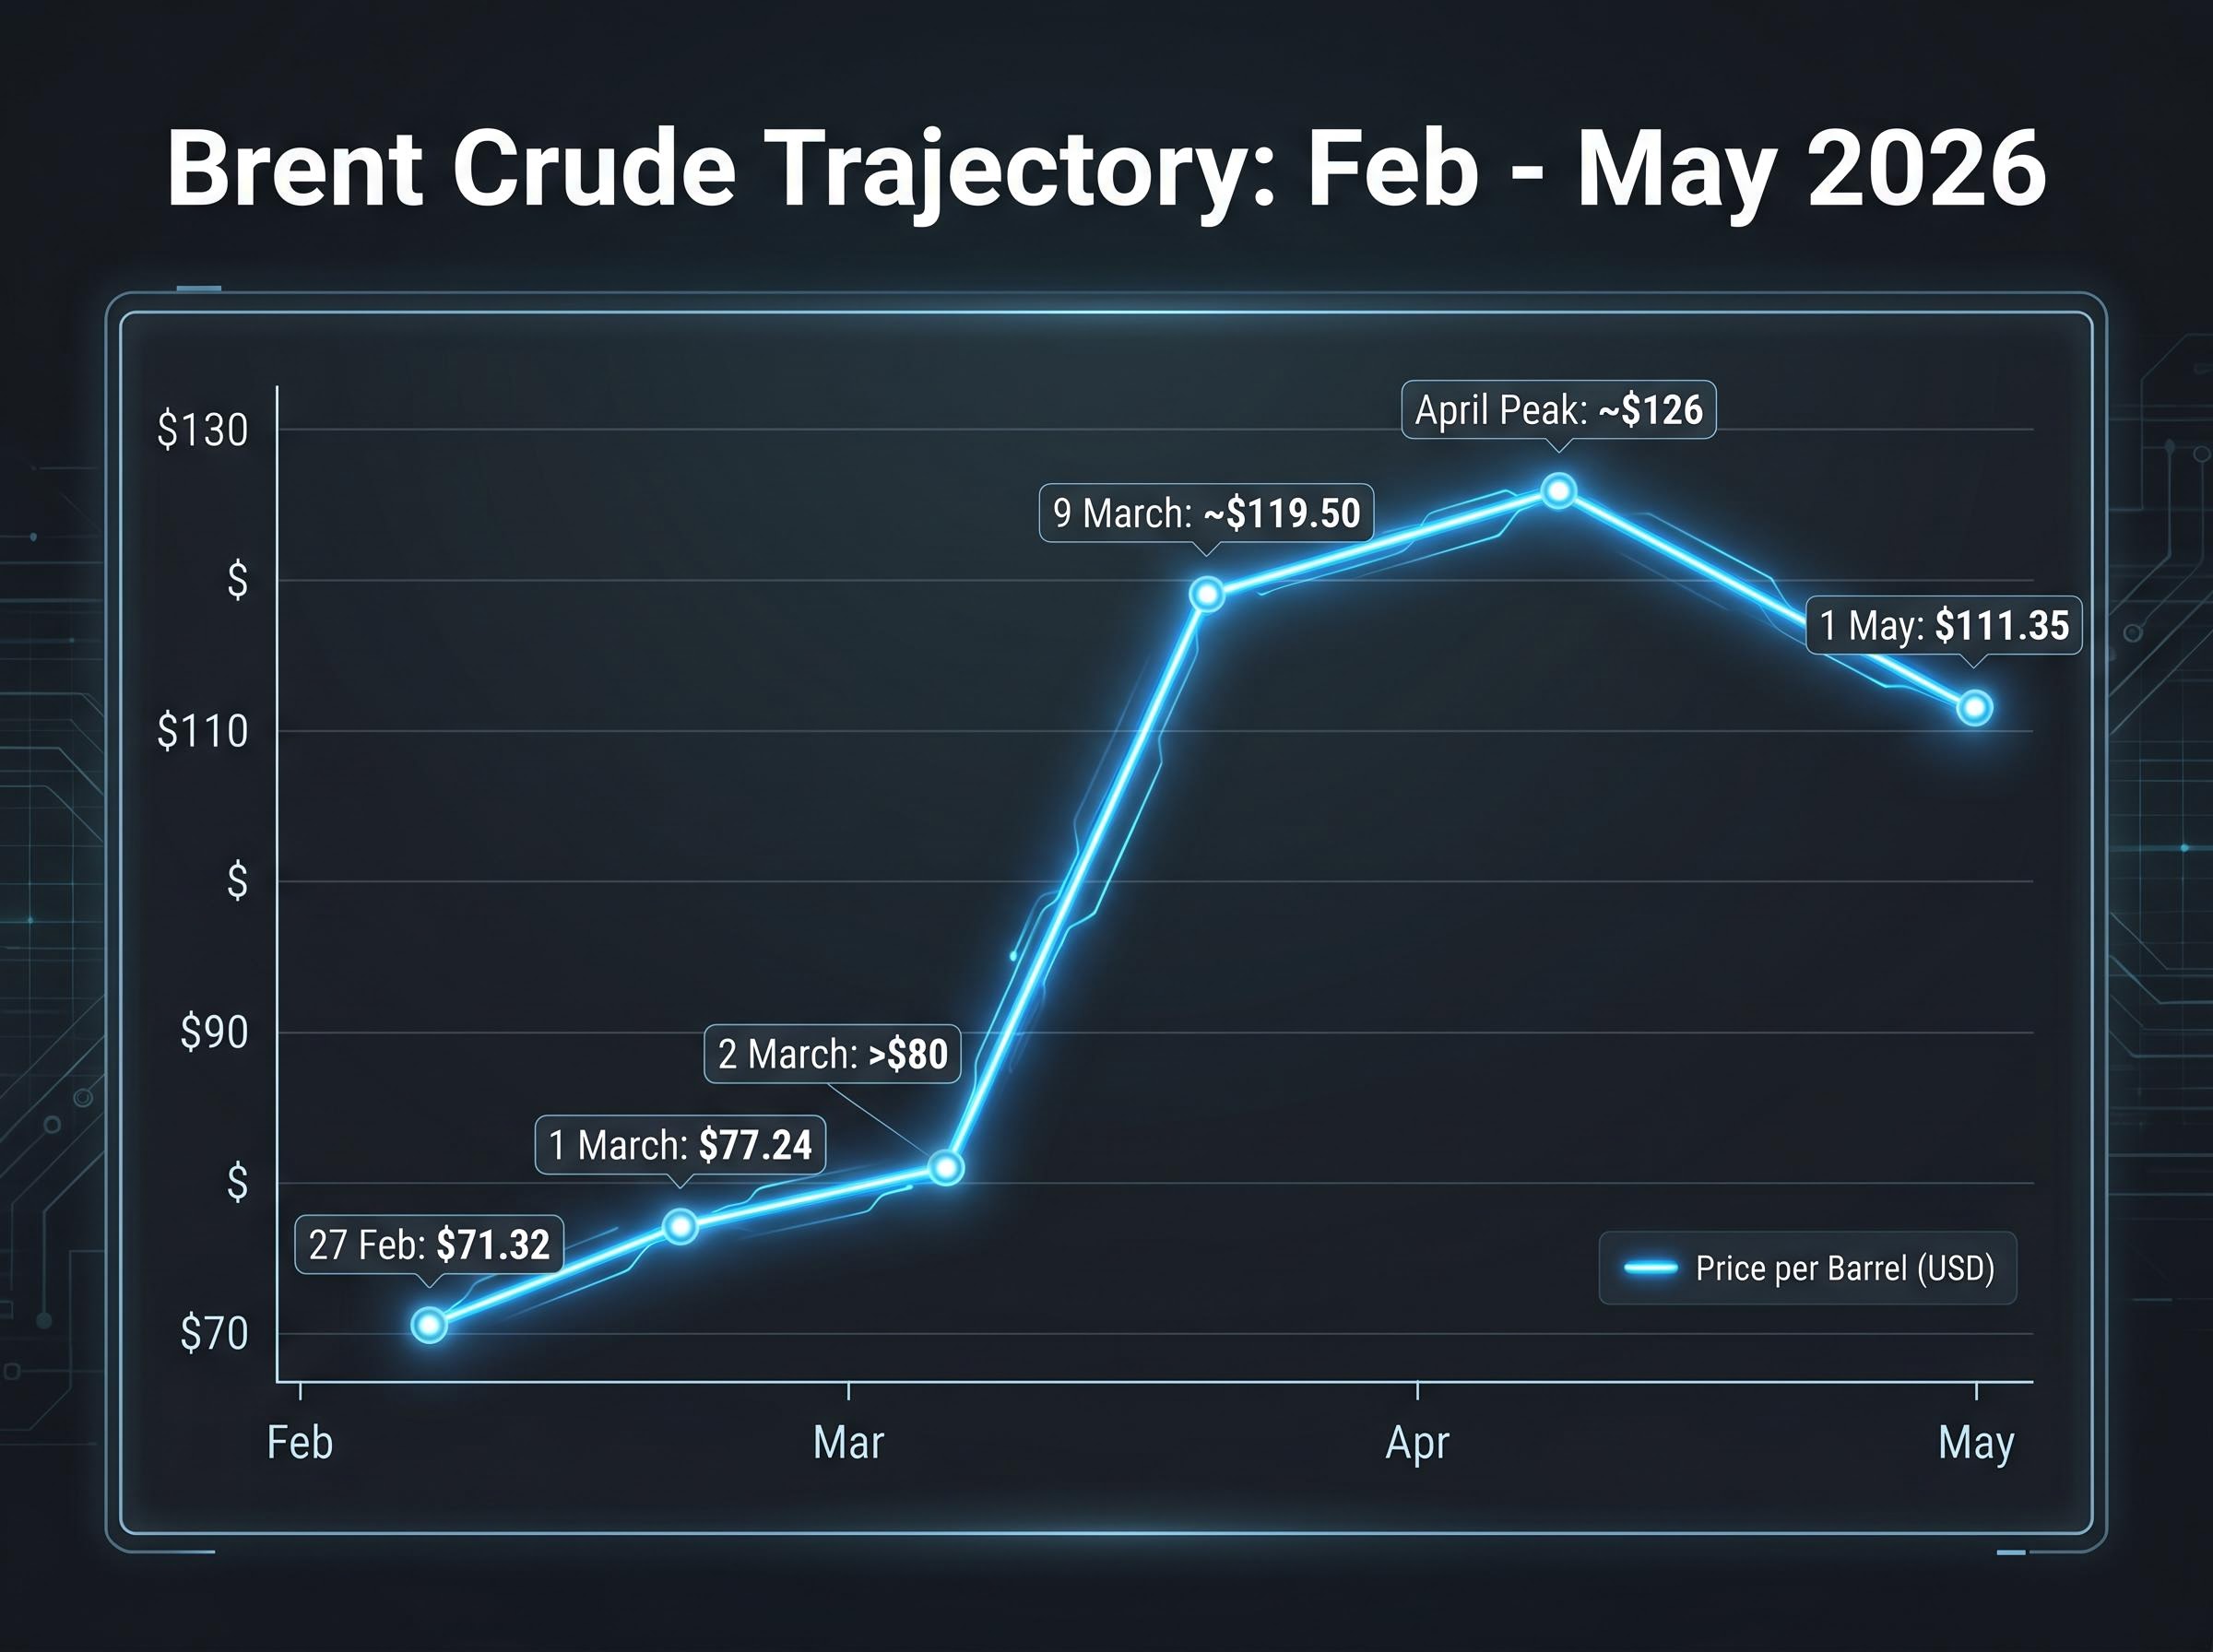
The price arc across March and April was not a single-session spike. Brent climbed from $71.32 on 27 February to $77.24 around 1 March, then surged past $80 on 2 March and reached approximately $119.50 by 9 March, a cumulative gain exceeding 40% across March. That multi-day, sustained trajectory signals structural repricing rather than panic trading.
By April, Brent had pushed to approximately $126 before retreating to its current level. The Hormuz Strait handles roughly 20% of global oil flow; the risk premium embedded in current prices reflects a rational response to a genuine supply disruption scenario, not speculative froth.
Brent’s intraday spike above $125 on 30 April captured the upper bound of what markets were pricing for a full Hormuz closure scenario, with the IEA estimating roughly 13 million barrels per day removed from global supply at the peak of the disruption.
The Strait of Hormuz is a narrow passage between Iran and Oman connecting the Persian Gulf to the Gulf of Oman and the open ocean beyond. Its significance comes down to three facts:
This geography gives Iran disproportionate pricing power. Even when no physical disruption has occurred, a credible threat to Hormuz traffic forces traders to price in the possibility of supply loss, a mechanism known as a geopolitical risk premium.
Citigroup estimated in January 2026 that crude markets carried a $3.00-$4.00 per barrel geopolitical risk premium, with $1.50 attributed specifically to conflict risk near the Strait of Hormuz.
That January estimate predated the March military operations. The subsequent price trajectory, from $71 to $126, showed the risk premium expanding from a modest surcharge into a dominant pricing factor. When Iran reaffirms its Hormuz claim, as it did on 30 April, the premium does not need a physical blockade to hold; the credible threat is sufficient.
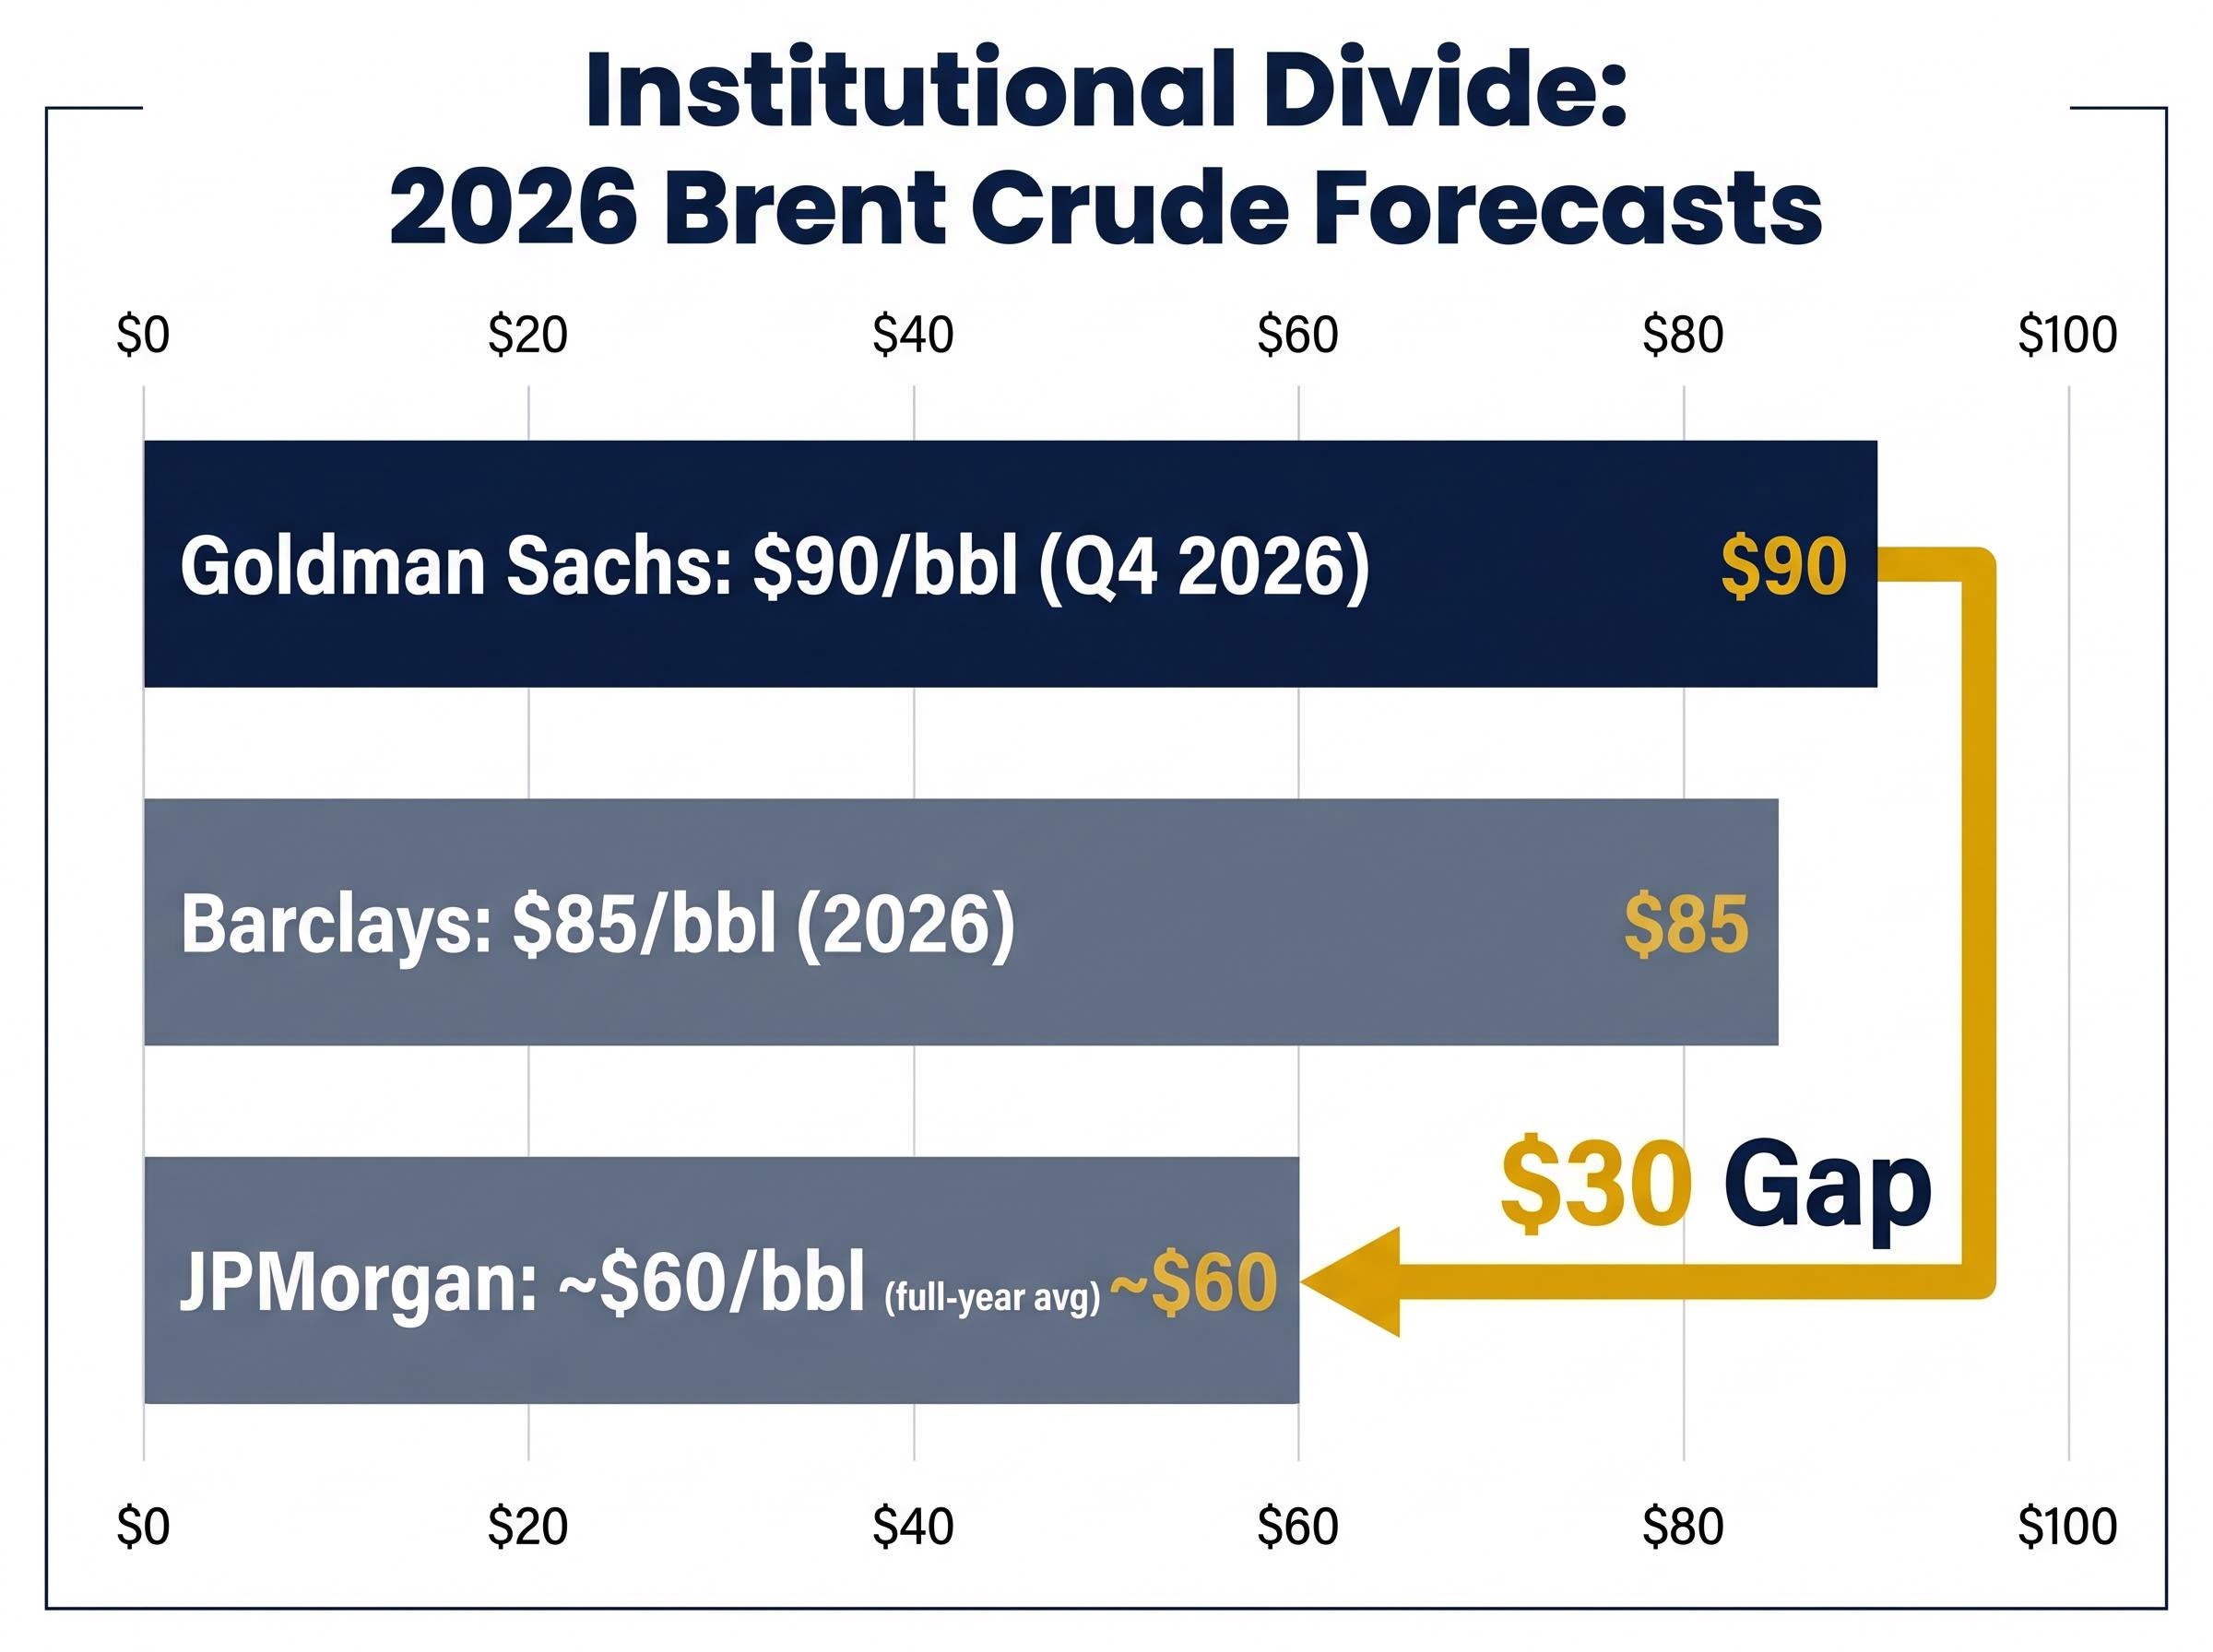
The sharpest institutional divide in current oil analysis sits between Goldman Sachs and JPMorgan. Their year-end Brent forecasts are separated by approximately $30, reflecting fundamentally different assumptions about whether Hormuz supply disruptions will normalise or persist.
| Institution | Brent Forecast | WTI Forecast | Key Assumption |
|---|---|---|---|
| Goldman Sachs | $90/bbl (Q4 2026) | $83/bbl (Q4 2026) | Lower Middle East production persists; supply squeeze continues |
| Barclays | $85/bbl (2026) | N/A | Hormuz disruption risks sustain elevated prices (issued 13 March) |
| JPMorgan | ~$60/bbl (full-year avg) | N/A | Supply normalisation; geopolitical premium fades |
| OPEC+ (context) | Adding 206,000 bpd from May 2026 | Conditional supply return as tensions partially ease | |
That $30 gap is not noise. It reflects whether the current risk premium is a temporary dislocation or a multi-quarter structural feature of the oil market, and that question is the single most consequential variable for energy sector positioning through year-end.
Goldman Sachs projected a global supply deficit of 9.6 million barrels per day as the crisis deepened, a figure that contextualises why the $30 gap between their year-end forecast and JPMorgan’s is not simply a disagreement about diplomacy but a disagreement about how long a structural shortfall persists.
On 5 April 2026, OPEC+ agreed to increase output by 206,000 barrels per day beginning in May, drawing from prior voluntary production cuts. The decision signals a conditional return of supply, contingent on Hormuz stability continuing to improve from the March peak. Whether that supply addition is sufficient to cap Brent below $115 is the near-term test of the bearish case.
USD/JPY approached 160 on 30 April before Japanese government intervention temporarily reversed the move. By 1 May, the pair was trading near 157, a level that reflects how little lasting impact intervention has delivered.
The yen’s weakness is a separate but parallel story to the oil shock. Japan is a major oil importer, so elevated crude prices worsen Japan’s terms of trade, adding structural pressure on the currency that monetary intervention cannot offset when the underlying rate differential is this wide.
The Federal Reserve’s 29 April decision to hold rates steady reinforced the U.S.-Japan rate differential that has driven yen weakness throughout 2026. Analysts from StoneX and MUFG have characterised yen weakness as structural, driven by that persistent differential and broader risk-off sentiment. Bank of Japan actions have provided only short-lived support.
Deutsche Bank strategist Tim Baker offered a multi-variable framework that explains why intervention keeps failing. The framework incorporates three factors:
Deutsche Bank’s Tim Baker noted that USD/JPY appears elevated when measured against interest rate differentials alone, but actually looks low when rates, equities, and oil prices are incorporated as combined variables.
For U.S. investors with exposure to Japanese equities or multinationals with Japanese revenue, this framing is significant: yen weakness is not a problem that resolves on its own even if Japanese authorities persist with intervention, because the three variables driving the currency are all pointing in the same direction.
The equity market response to the oil shock is not a uniform drawdown. It is a sector split. Energy stocks rose 15-20% in April, while consumer discretionary fell 5-10%, with the mechanism being oil-driven inflation squeezing purchasing power. Morgan Stanley attributed the divergence directly to geopolitical tensions.
The oil-driven consumer squeeze is showing up in spending data more granularly than the sector-level equity moves suggest, with transportation and medical cost inflation pulling discretionary income lower and accelerating a shift toward discount retail that the consumer discretionary sector decline only partially captures.
| Sector / Stock | Direction | Approximate Move | Primary Driver |
|---|---|---|---|
| Energy sector | Up | 15-20% (April) | Elevated crude prices |
| Consumer discretionary | Down | 5-10% (April) | Oil-driven inflation, reduced purchasing power |
| Apple (AAPL) | Up | Q2 beat | $111.18B revenue, $2.01 EPS, $100B buyback |
| Alphabet (GOOGL) | Up | +9.96% to $384.80 | Earnings beat on 1 May |
| NVIDIA (NVDA) | Down | -4.63% to $199.57 | Sector rotation, risk repricing |
| S&P 500 | Holding | 7,209.01 | Earnings resilience offsetting geopolitical drag |
The S&P 500 at 7,209.01 is not simply falling alongside oil-driven inflation fears, and the reason is the earnings season underneath it. Barclays strategists flagged U.S. Q1 earnings beats as considerably stronger than European peers, reinforcing U.S. equity resilience relative to the global picture.
Apple reported Q2 revenue of $111.18 billion and earnings per share of $2.01, with Q3 guidance of 14-17% revenue growth against a consensus estimate of 9.5%. The company also authorised a $100 billion share buyback. That buyback is a capital allocation signal that supports the share price even if macro headwinds persist, and the guidance beat is the clearest single-stock expression of why the broader market is holding despite the geopolitical backdrop.
The Federal Reserve held rates steady at its 29 April 2026 meeting. The official statement cited modest job gains, stable unemployment at 4.3% (with March nonfarm payrolls at +178,000), and elevated inflation driven in part by geopolitical factors and energy price shocks.
The FOMC’s April 2026 rate decision confirmed the federal funds rate would remain at 3.5 to 3.75 percent, with the official statement explicitly attributing elevated inflation in part to global energy prices, a framing that positions the current inflationary episode as supply-driven rather than a product of overheated domestic demand.
The Fed characterised elevated inflation as partly tied to geopolitical factors and energy price shocks, framing the current inflationary environment as at least partially supply-driven rather than demand-driven.
That hold connects directly to all three asset stories covered above:
The Fed’s decision is the macro anchor that ties these dynamics together. The central bank is deliberately staying still while three major asset classes are in motion.
For investors tracking how the current Fed posture extends beyond the immediate hold, our dedicated guide to the Fed rate path through 2027 maps the specific conditions under which financial markets now project no cuts before late 2027, including the sustained geopolitical inflation channel and the implications for rate-sensitive equity multiples and fixed income positioning.
Oil at $111 Brent with an active Hormuz threat. The yen near 157 with intervention stalling. Equities bifurcating by sector but holding on earnings. These three dynamics share a common driver: geopolitical risk that has not yet found a resolution.
Goldman Sachs and JPMorgan are $30 apart on year-end Brent. Japanese intervention keeps failing. The next escalation signal from Iran or Washington could reset all three dynamics simultaneously. Four specific catalysts deserve attention in the near term:
The framework connecting oil, currencies, and equities through the Fed’s rate posture is the lens through which the next round of headlines will be most legible.
This article is for informational purposes only and should not be considered financial advice. Investors should conduct their own research and consult with financial professionals before making investment decisions.
Past performance does not guarantee future results. Financial projections referenced are subject to market conditions and various risk factors.
A geopolitical risk premium is the extra price traders add to crude oil to account for the possibility of supply disruptions caused by political instability or conflict. Citigroup estimated crude markets carried a $3.00-$4.00 per barrel premium in January 2026, with $1.50 attributed specifically to conflict risk near the Strait of Hormuz.
The Strait of Hormuz handles roughly 20% of global oil supply and narrows to approximately 33 kilometres at its tightest point, with no pipeline or alternative route capable of replacing its volumes if disrupted. Even a credible threat to the waterway, without any physical blockade, is sufficient to sustain elevated crude prices.
Goldman Sachs forecasts Brent at $90 per barrel for Q4 2026, while JPMorgan projects a full-year average of around $60 per barrel, a gap of approximately $30 reflecting fundamentally different assumptions about whether Hormuz supply disruptions will persist or normalise.
Energy stocks rose 15-20% in April 2026 on elevated crude prices, while consumer discretionary stocks fell 5-10% as oil-driven inflation squeezed household purchasing power. Morgan Stanley attributed this bifurcation directly to geopolitical tensions.
The Fed held rates at 3.5 to 3.75 percent at its 29 April 2026 meeting, citing stable unemployment at 4.3% and characterising elevated inflation as partly supply-driven due to global energy prices rather than overheated domestic demand, a posture that keeps the U.S.-Japan rate differential wide and supports crude price floors.