
ANZ Dividend Holds at 83 Cents as Profit Surge Masks Weak Revenue
6 mins ago

When Iran shut the Strait of Hormuz in late February 2026, equity markets that had been posting strong regional gains flipped into some of their worst monthly performances in years. The MSCI ACWI ended Q1 down 3.2% in US-dollar terms, but that headline number masked a far more uneven story underneath.
The conflict escalated on 28 February 2026, triggering a broad reassessment of energy exposure, trade disruption risk, and inflation trajectories across developed and emerging economies alike. A ceasefire announced on 8 April 2026 prompted a partial recovery, yet volatility and structural uncertainty remain elevated. What follows is an analysis of which regions absorbed the worst of the damage, what drove the divergence between US and non-US markets, how the shock is rewriting central bank rate expectations, and what Australian investors should be weighing as of May 2026.
Through late February, the global equity picture was broadly constructive. Several markets had posted strong positive returns ahead of the escalation:
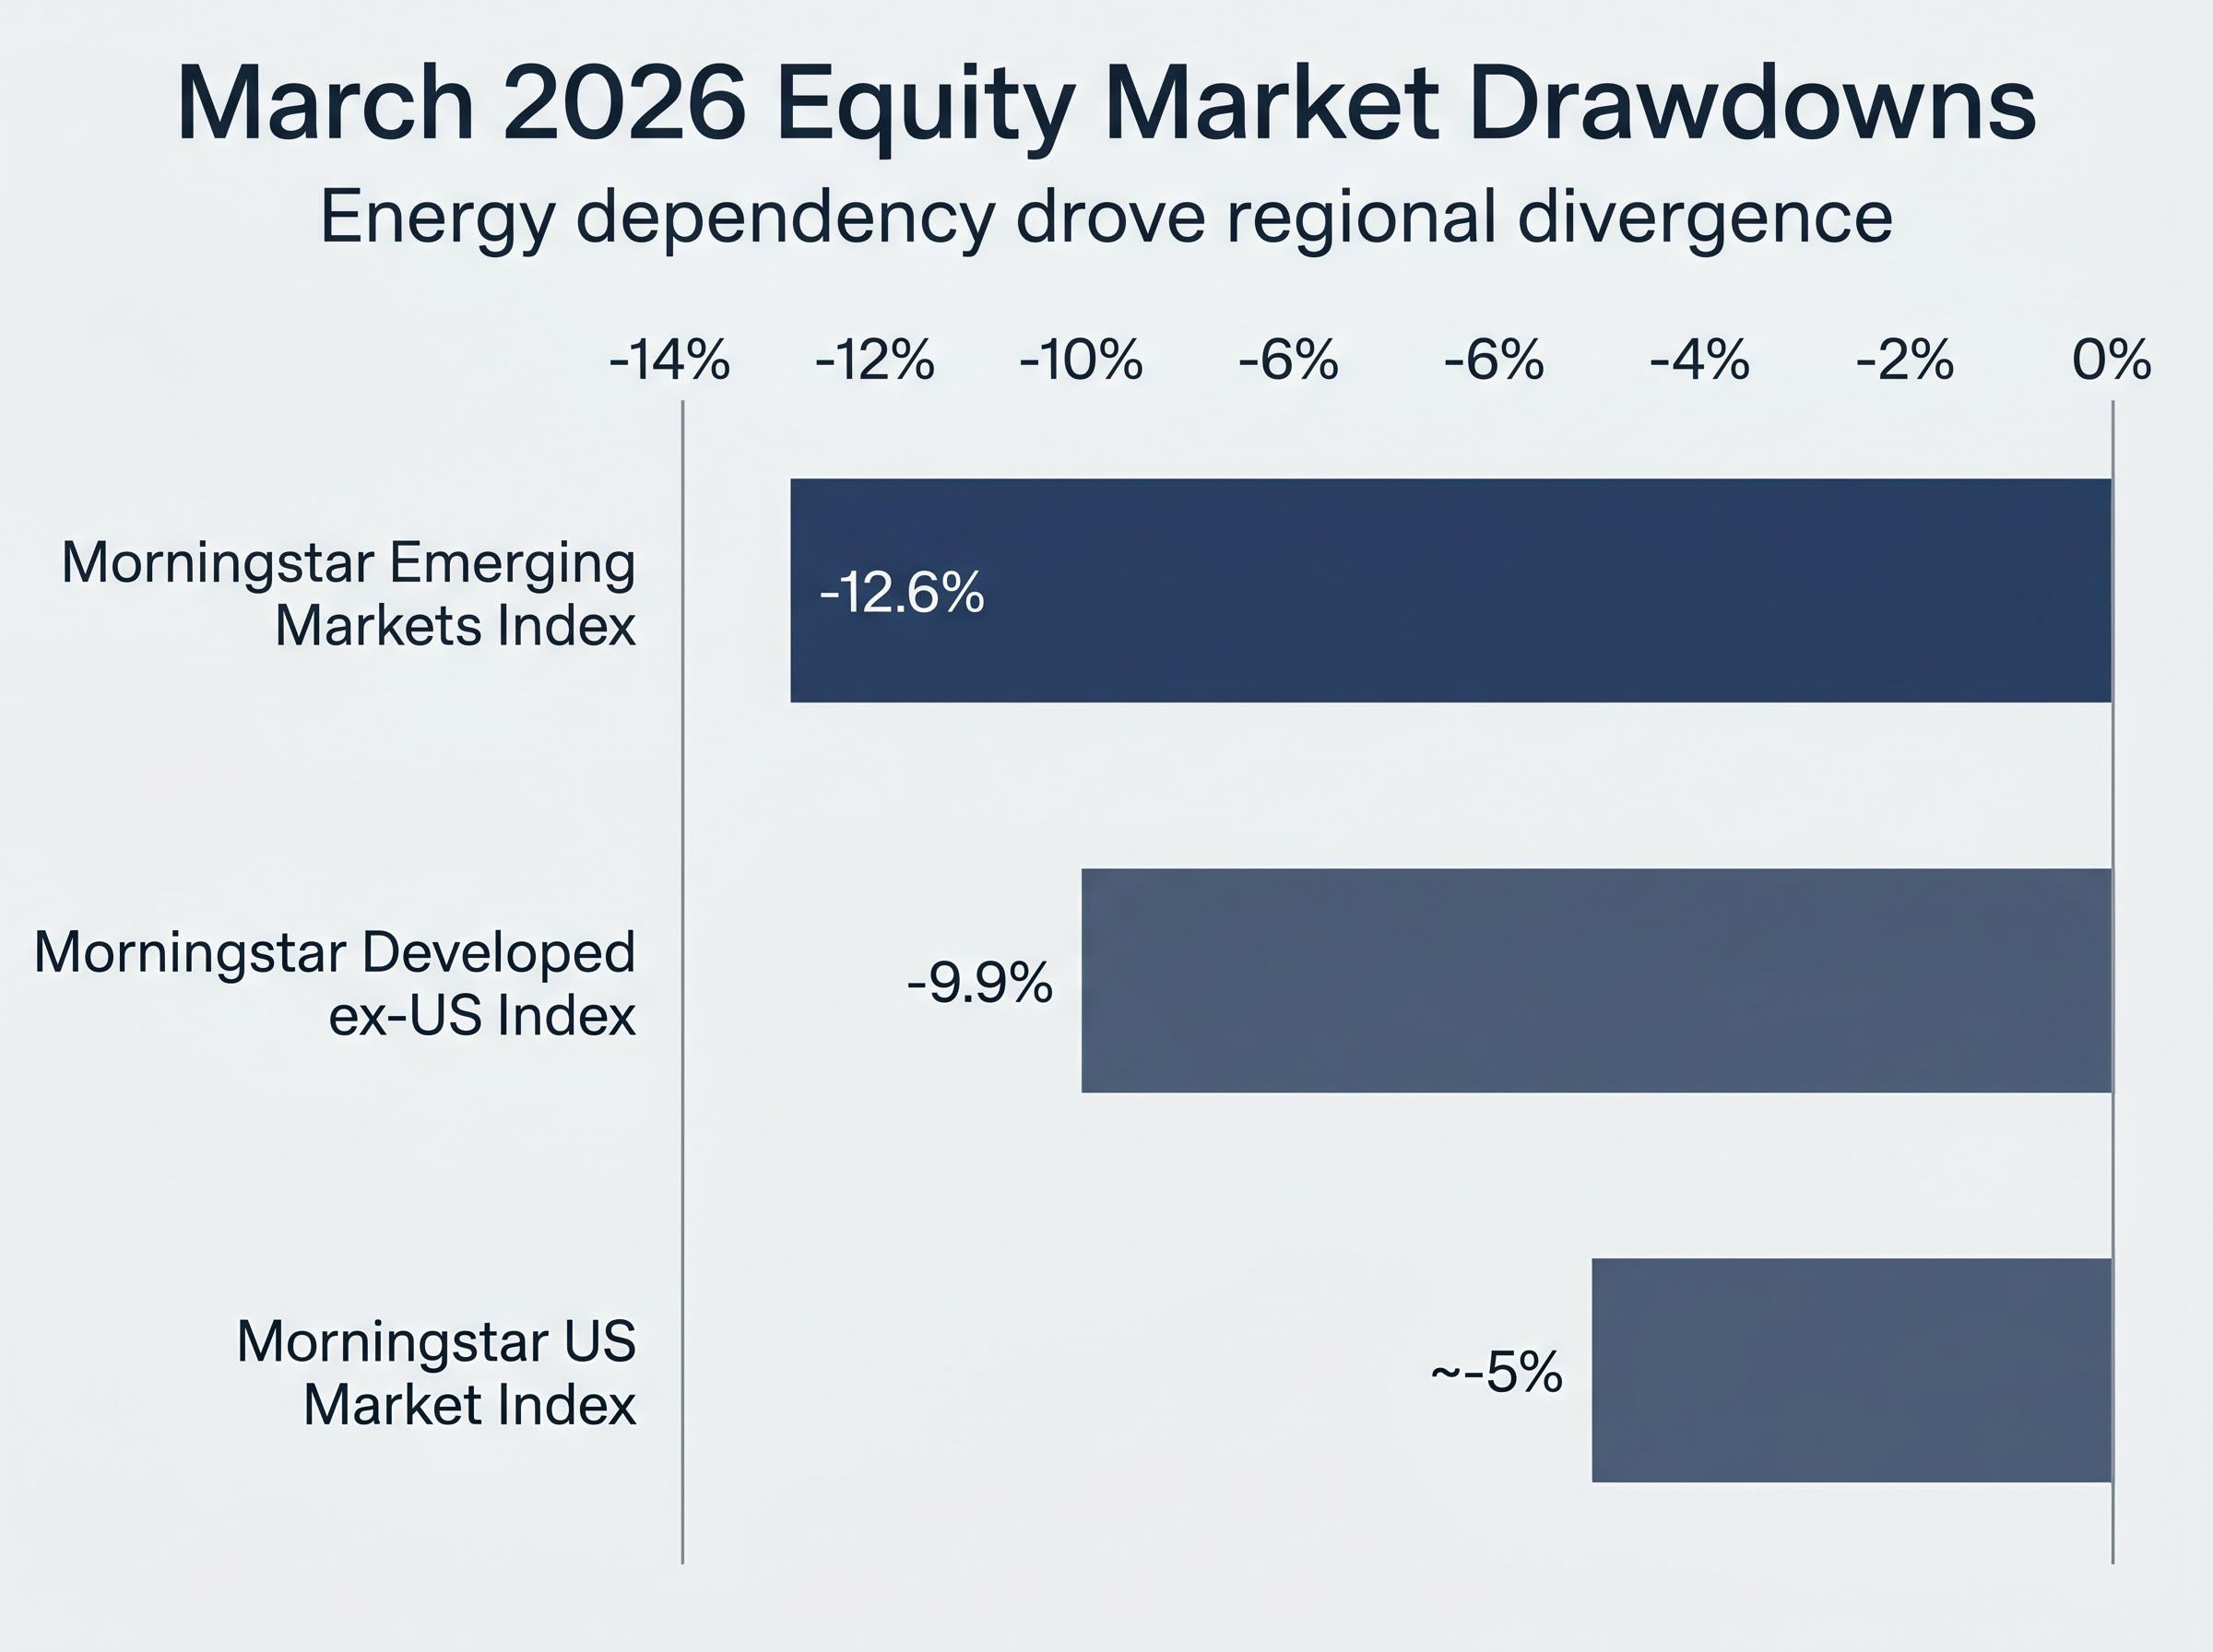
Then the conflict escalated on 28 February, and the quarter turned sharply. The S&P 500 recorded five consecutive weeks of declines, its worst monthly performance since 2022. The Morningstar US Market Index fell approximately 5% in March. Energy and commodities equities were a notable exception, rising as oil price expectations surged.
The damage outside the United States was considerably worse.
The MSCI ACWI ex US fell more than 10% in March 2026, a decline that dwarfed the US drawdown and signalled that the conflict’s market impact was anything but uniform.
That disparity between US and non-US returns is the analytical thread running through the rest of this piece. Without understanding the shape of Q1, the partial recovery following the 8 April ceasefire can be easily misread as a return to prior conditions. It was not.
The regional return data from March was not random volatility. It traced a structural line: exposure to the Strait of Hormuz correlated tightly with Middle Eastern energy import dependency.
The Morningstar Emerging Markets Index declined 12.6% in March. The Morningstar Developed Markets ex-US Index dropped 9.9%, with roughly three-quarters of that index composed of European developed and Japanese equities at end of March. Both regions rely heavily on Saudi and Iraqi petroleum transiting the Hormuz chokepoint.
The International Energy Agency described the disruption in stark terms.
The IEA called the Hormuz closure the “largest supply disruption in the history of the global oil market.”
US equities, by contrast, held up comparatively well. Domestic production capacity and geographic distance from Middle Eastern supply routes provided a buffer that energy-import-dependent economies simply did not have. Emerging market economies faced additional susceptibility through broader commodity price sensitivity and thinner fiscal cushions.
| Region | Index | March 2026 Return | Key Energy Dependency Factor |
|---|---|---|---|
| Emerging Markets | Morningstar EM Index | -12.6% | Broad commodity and oil import exposure |
| Developed ex-US (Europe/Japan) | Morningstar Developed ex-US Index | -9.9% | Heavy reliance on Hormuz-transiting oil |
| United States | Morningstar US Market Index | ~-5% | Domestic production buffers import risk |
This framework, mapping energy dependency to equity drawdown severity, is the most useful analytical lens Australian investors can apply to future geopolitical disruptions. It maps exposure predictably rather than requiring case-by-case guesswork.
Capital reallocation accelerated across sector lines as the conflict deepened, with institutional flows rotating away from energy-import-dependent consumer and industrial names toward domestic producers, commodity equities, and technology infrastructure, a pattern that explains much of the dispersion within regional indexes that aggregate return figures obscure.
Oil prices remain elevated despite the ceasefire, and the signal is not just the headline barrel price. Futures are trading in steep backwardation, meaning near-term contracts are priced significantly above longer-dated ones. In practical terms, backwardation indicates that buyers are paying a premium for immediate delivery, a bet that supply tightness will persist rather than ease quickly.
Infrastructure damage and reopening logistics explain the disconnect between the diplomatic progress and the price structure. The Strait of Hormuz remained closed as of the latest reporting, and even when physical transit resumes, the market is pricing in a drawn-out normalisation.
Morningstar Investment Management has framed the forward outlook through three scenarios:
| Scenario | Likelihood | Estimated Oil Price Range | Key Portfolio Risk |
|---|---|---|---|
| Rapid resolution | Low | Below $75 per barrel | Reversal of energy equity gains |
| Gradual resolution into H2 2026 | Medium | $100-$125 per barrel | Sustained inflation pressure |
| Prolonged war | Low | Above $125 per barrel | Fixed income and EM sovereign debt losses |
The third scenario carries the most consequential portfolio implications despite its low assigned probability. Under sustained prices above $125 per barrel, long-duration fixed income becomes a liability rather than a hedge. Inflation pressures override growth concerns, credit spreads widen, and emerging-market sovereign debt could face double-digit percentage losses.
Duration, the measure of a bond’s sensitivity to interest rate changes, works against holders when inflation forces central banks into a tightening posture. This is the risk that investors who treated bonds as a geopolitical hedge may not have fully priced in.
The channel through which an oil price surge transmits into recession risk runs through four simultaneous pressure points: compressed consumer disposable income, rising business input costs, Federal Reserve rate resistance, and a broad pullback in corporate investment and hiring, each of which compounds the others rather than operating in isolation.
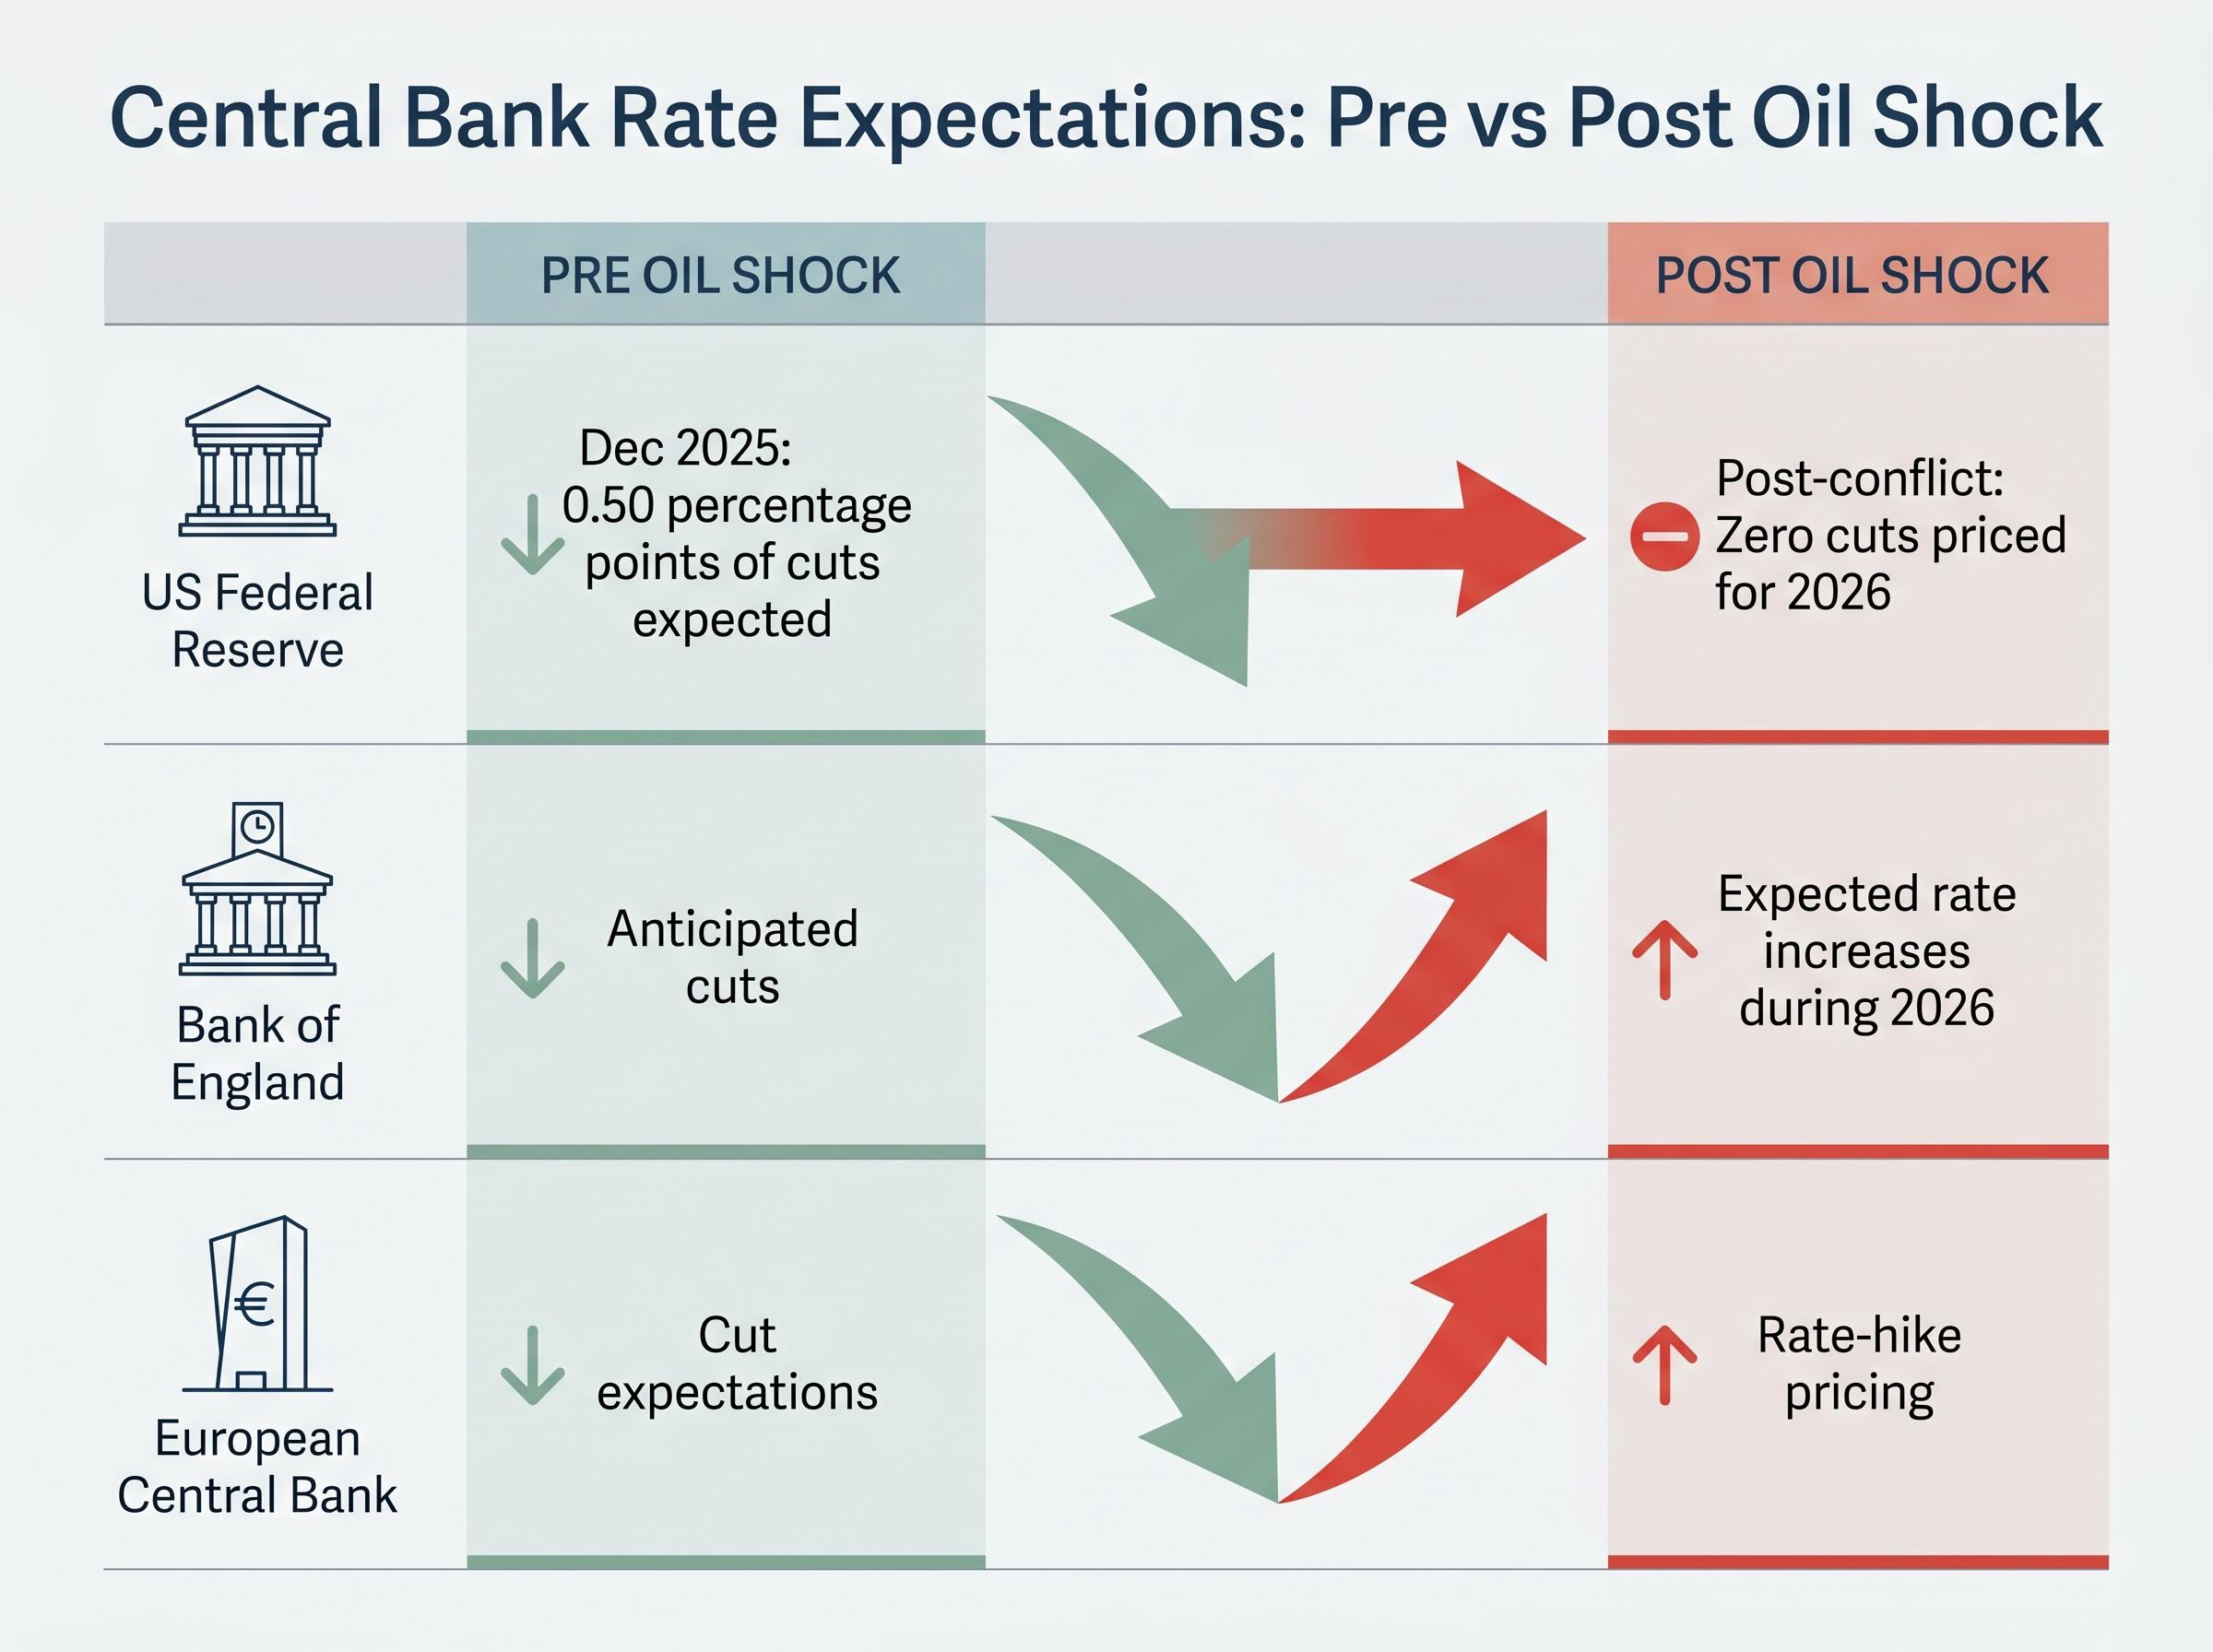
In December 2025, futures markets were pricing approximately 0.50 percentage points of US federal-funds rate cuts for 2026. Rate relief was the consensus expectation across developed economies.
The conflict erased that outlook entirely.
Post-conflict, futures markets shifted to pricing zero cuts for the US Federal Reserve in 2026, a full reversal of the 0.50 percentage points of easing expected just months earlier.
The shift was more pronounced outside the United States:
Neither the Fed nor the ECB actually raised rates in April 2026. But the forward pricing shift itself carries real portfolio consequences. Equity discount rates rise when rate-cut expectations disappear. Bond portfolios reprice as duration becomes less attractive. The relative appeal of growth stocks versus value stocks shifts when cheaper capital is no longer on the horizon.
For EU and Asian economies already under energy cost stress, the tightening bias compounds pressure on growth. Rate relief that investors had counted on is no longer arriving.
Australia’s exposure to the conflict runs through three distinct channels, each operating with its own logic:
On 8 April 2026, the ASX surged over 2% to a five-week high, generating approximately $80 billion in market capitalisation gains. The S&P/ASX 200 rose roughly 1-3% in early April amid post-ceasefire optimism. That bounce, while significant, does not signal a clean resolution of Australian market risk.
The energy sector tells a different story. ASX energy stocks declined approximately 7.3% as oil prices pulled back from their conflict-driven peaks below $100 per barrel. Sector-level effects ran directly opposite to the broader market’s recovery, illustrating why blanket portfolio adjustments in response to geopolitical events are likely to produce unintended results.
Australian inflation rose to 4.6% in the year to March 2026, driven by fuel price shocks. Trimmed mean inflation, the measure the RBA watches most closely as a policy benchmark, came in at 3.5% for Q1 2026.
The RBA measures of consumer price inflation confirm the quarterly CPI and trimmed mean readings that feed directly into the Board’s rate decisions, making the March 2026 trimmed mean result of 3.5% a pivotal data point for assessing how far above the 2-3% target band domestic inflation currently sits.
The RBA warned that the global oil shock could drive up domestic inflation expectations. Prior rate-cut expectations have been replaced by rate-rise forecasts. The RBA has not yet moved, but the direction of travel has changed materially. For Australian mortgage holders, the shift from anticipated rate relief to potential rate increases is a direct financial consequence of a conflict that felt geographically distant. Bond portfolios and equity valuations face simultaneous pressure from the same source.
Historical precedent offers some reassurance, but with qualification. Short, contained geopolitical conflicts have generally represented buying opportunities over long horizons.
According to Morningstar analysis, few short-term geopolitical events have caused lasting damage to equity markets over extended time horizons.
The Morningstar Emerging Markets Index delivered a gain of nearly 27% over the 12-month period prior to the March selloff, underscoring the danger of reactive reallocation out of hard-hit regions. Wall Street indexes were hitting record highs by 17 April 2026, illustrating how quickly snapback rallies can materialise when de-escalation optimism takes hold.
The speed of the Wall Street snapback raises serious questions about geopolitical risk mispricing, particularly the degree to which markets are pricing Hormuz reopening as a near-certainty rather than a contingent outcome that could reverse on a single headline.
The unresolved Hormuz situation and inflation persistence make this a more complex case than the typical geopolitical shock, however. Goldman Sachs lowered GDP forecasts and raised inflation projections in response to the conflict, suggesting the macroeconomic drag extends beyond the headline event. Charles Schwab noted that temporary truces offer relief but volatility remains elevated from ongoing headline risks and economic ripple effects.
For Australian investors reviewing positioning, the following action considerations are ordered by priority:
For Australian investors wanting a structured framework to act on these positioning considerations, our dedicated guide to volatile ASX portfolio construction walks through a three-layer approach covering cash buffers, income-generating bonds, and diversified equity exposure, with specific ASX-listed instruments and dollar-cost averaging mechanics for each layer.
This article is for informational purposes only and should not be considered financial advice. Investors should conduct their own research and consult with financial professionals before making investment decisions. Past performance does not guarantee future results. Financial projections are subject to market conditions and various risk factors.
Geography and energy dependency were the primary drivers of regional return divergence in Q1, not market-level valuations or earnings fundamentals. That structural reality persists regardless of ceasefire progress.
Australian investors face layered exposure that demands segment-level thinking: the inflation channel feeding into RBA policy, ASX energy sector dynamics that can move against the broader market, and emerging market allocations that carry both the highest drawdown risk and the highest recovery potential.
A full Hormuz resolution could spark a significant snapback rally. But infrastructure normalisation and inflation persistence mean the macroeconomic consequences of this conflict will outlast the conflict itself.
As Charles Schwab’s analysis noted, temporary truces offer relief, but volatility remains elevated from ongoing headline risks and economic ripple effects, particularly inflation driven by oil and gas prices.
The ceasefire was a start. It was not a conclusion.
When Iran shut the Strait of Hormuz in late February 2026, the MSCI ACWI fell 3.2% for Q1, but non-US markets bore the brunt, with the MSCI ACWI ex US dropping more than 10% in March alone, driven by energy import dependency.
The IEA described the closure as the largest supply disruption in the history of the global oil market, pushing oil futures into steep backwardation and creating sustained inflation pressure that threatened long-duration bond holders and energy-import-dependent equity markets.
Fuel-driven inflation pushed Australian CPI to 4.6% in the year to March 2026, with trimmed mean inflation at 3.5% for Q1, causing the RBA to shift from anticipated rate cuts to potential rate increases, directly affecting mortgage holders and bond portfolios.
Morningstar analysis cautions against reactive exits, noting that the Morningstar Emerging Markets Index gained nearly 27% in the 12 months prior to the March selloff, illustrating the high cost of abandoning positions at cyclical lows during geopolitical events.
Emerging markets fell the most, with the Morningstar Emerging Markets Index down 12.6% in March 2026, followed by developed markets excluding the US at 9.9%, while US equities declined approximately 5% due to domestic production buffering import risk.


