
RBA Holds Cash Rate at 4.35% After Three Straight Hikes
2 hrs ago

The global technology sector posted a 21.8% gain in 2025, then handed investors a pullback in early 2026. Into that pullback, a newly listed ASX exchange-traded fund arrived with a specific proposition: 300 global technology companies, a capped index structure, and a management expense ratio of 0.23% per annum. Vanguard‘s VTEK ETF began trading on the ASX in late March 2026, giving Australian investors a single-trade route to deliberate technology sector exposure at a moment when valuations had compressed from their prior-year peak. The timing raises a pointed question. Does the dip represent a re-entry opportunity backed by durable structural forces, or does sector concentration risk warrant caution? What follows is an examination of what VTEK offers, why the technology growth thesis remains intact, how the ETF’s construction addresses concentration concerns, and where this product fits within Australian portfolio construction.
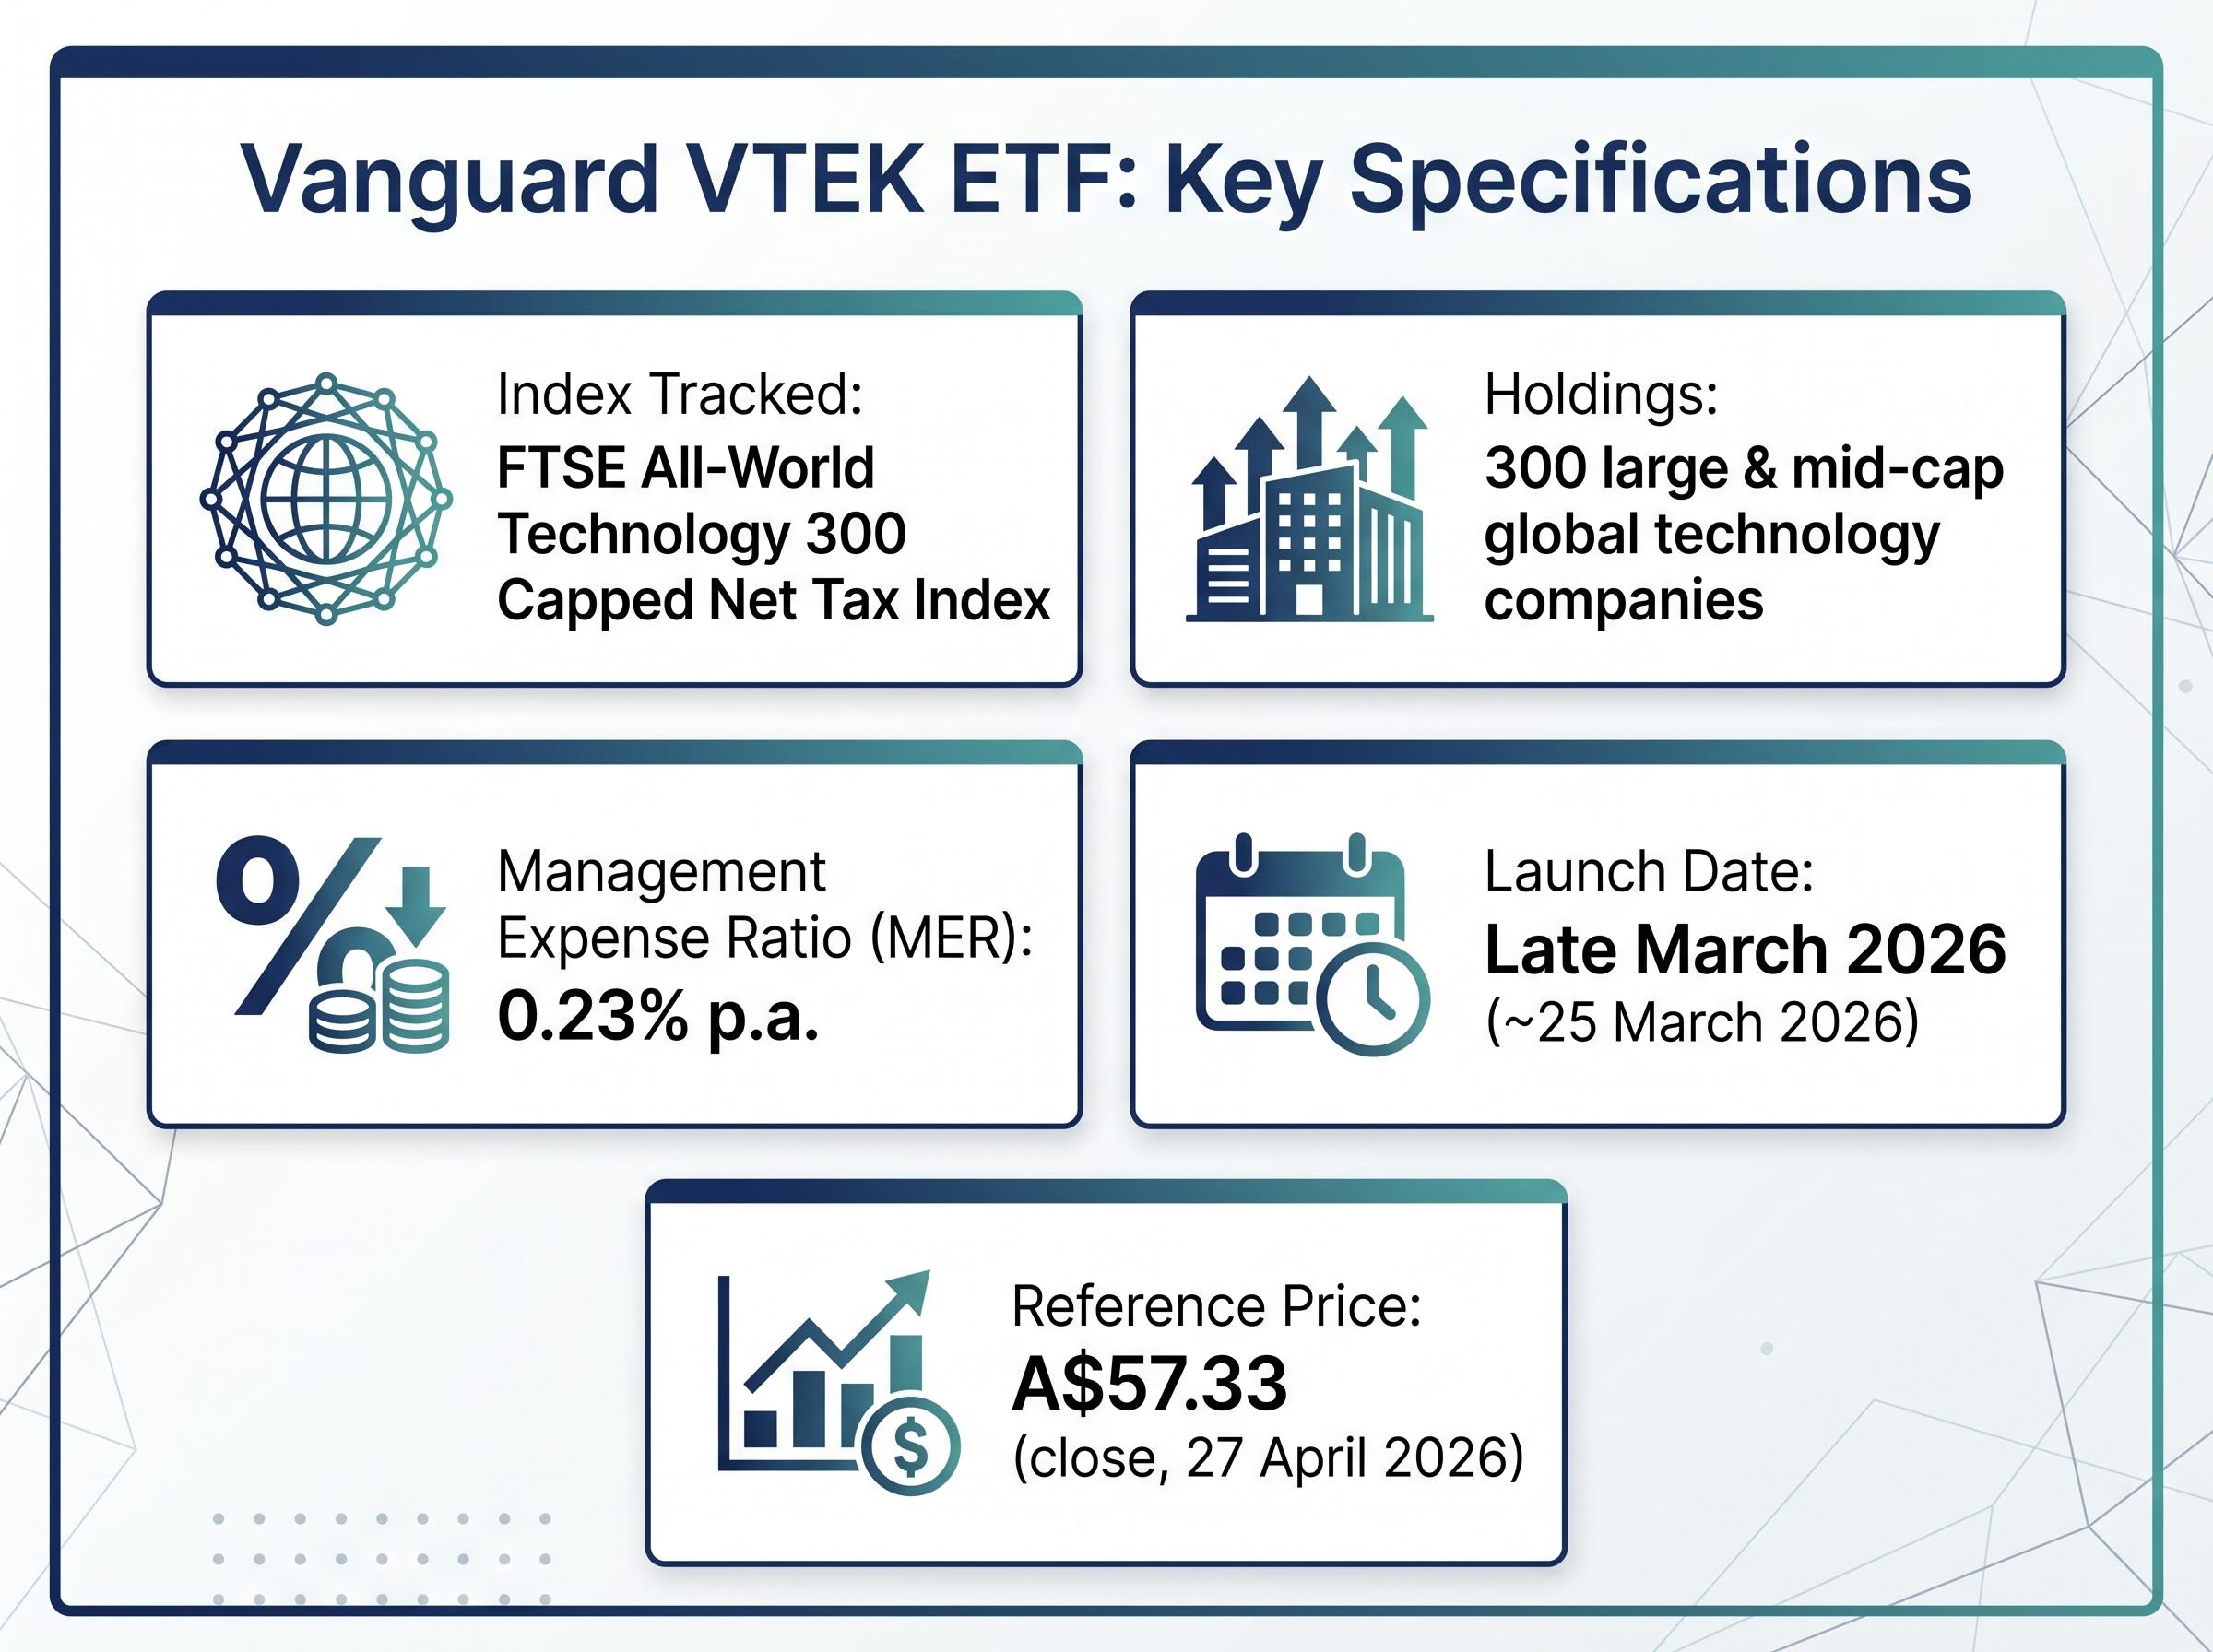
VTEK tracks the FTSE All-World Technology 300 Capped Net Tax Index, a benchmark that selects exactly 300 large and mid-cap technology companies across developed and emerging markets. The “capped” designation is not cosmetic; it means individual position sizes are limited at each rebalance, preventing any single mega-cap from dominating the portfolio’s weight.
The ETF’s management expense ratio sits at 0.23% per annum, competitive for a specialist sector product. VTEK launched on the ASX on approximately 25 March 2026, with the most recently confirmed closing price at approximately A$57.33 as of 27 April 2026, sourced from Yahoo Finance.
Key product specifications:
Given the ETF’s recent launch, assets under management and year-to-date performance figures are not yet meaningful. Investors should verify current figures via Vanguard Australia‘s product disclosure statement.
Vanguard Australia’s VTEK product disclosure confirms the ETF’s inception date of 24 March 2026, its management fee of 0.23% per annum, and the FTSE All-World Technology 300 Capped Net Tax Index as the benchmark, providing the authoritative specification baseline investors should consult before allocating.
| Metric | Detail | Confidence |
|---|---|---|
| Index tracked | FTSE All-World Technology 300 Capped Net Tax Index | High |
| Number of holdings | 300 | High |
| MER | 0.23% p.a. | High |
| Launch date | Late March 2026 (~25 March 2026) | High |
| Price (nearest confirmed) | A$57.33 close (27 April 2026) | High |
| AUM | Not confirmed; requires verification | Low |
| YTD performance | Not meaningful given recent launch | Low |
The early 2026 selloff compressed technology valuations, but the demand drivers underpinning the sector’s revenue growth have not reversed. Three structural forces remain in motion, each reinforcing the others.
AI infrastructure spending by hyperscalers is projected to reach $700 billion in 2026, with approximately 75% directed toward physical hardware and data centre construction, a capital commitment that supports the revenue durability of the large incumbent technology companies that form the core holdings of capped global technology indices.
Global technology spending is projected to grow 9.3% in 2025, with data centre and software segments achieving double-digit growth rates, according to industry forecasts.
The distinction matters for investors evaluating a sector ETF after a selloff. A broken thesis looks different from a compressed valuation. The spending data and enterprise adoption trends point toward the latter: the structural demand backdrop remains intact, even as short-term sentiment has weakened.
A sector ETF, by design, concentrates holdings within a single industry. That is the trade-off investors accept for targeted exposure. The question is not whether concentration risk exists in VTEK, but how many layers of it an investor is absorbing.
Three distinct layers are worth separating:
Australian financial commentary in 2025 and 2026 has noted accelerating concentration risk within the ASX itself, with financial advisers increasingly recommending equal-weight structures as mitigation. Sector ETFs sit further along the concentration spectrum.
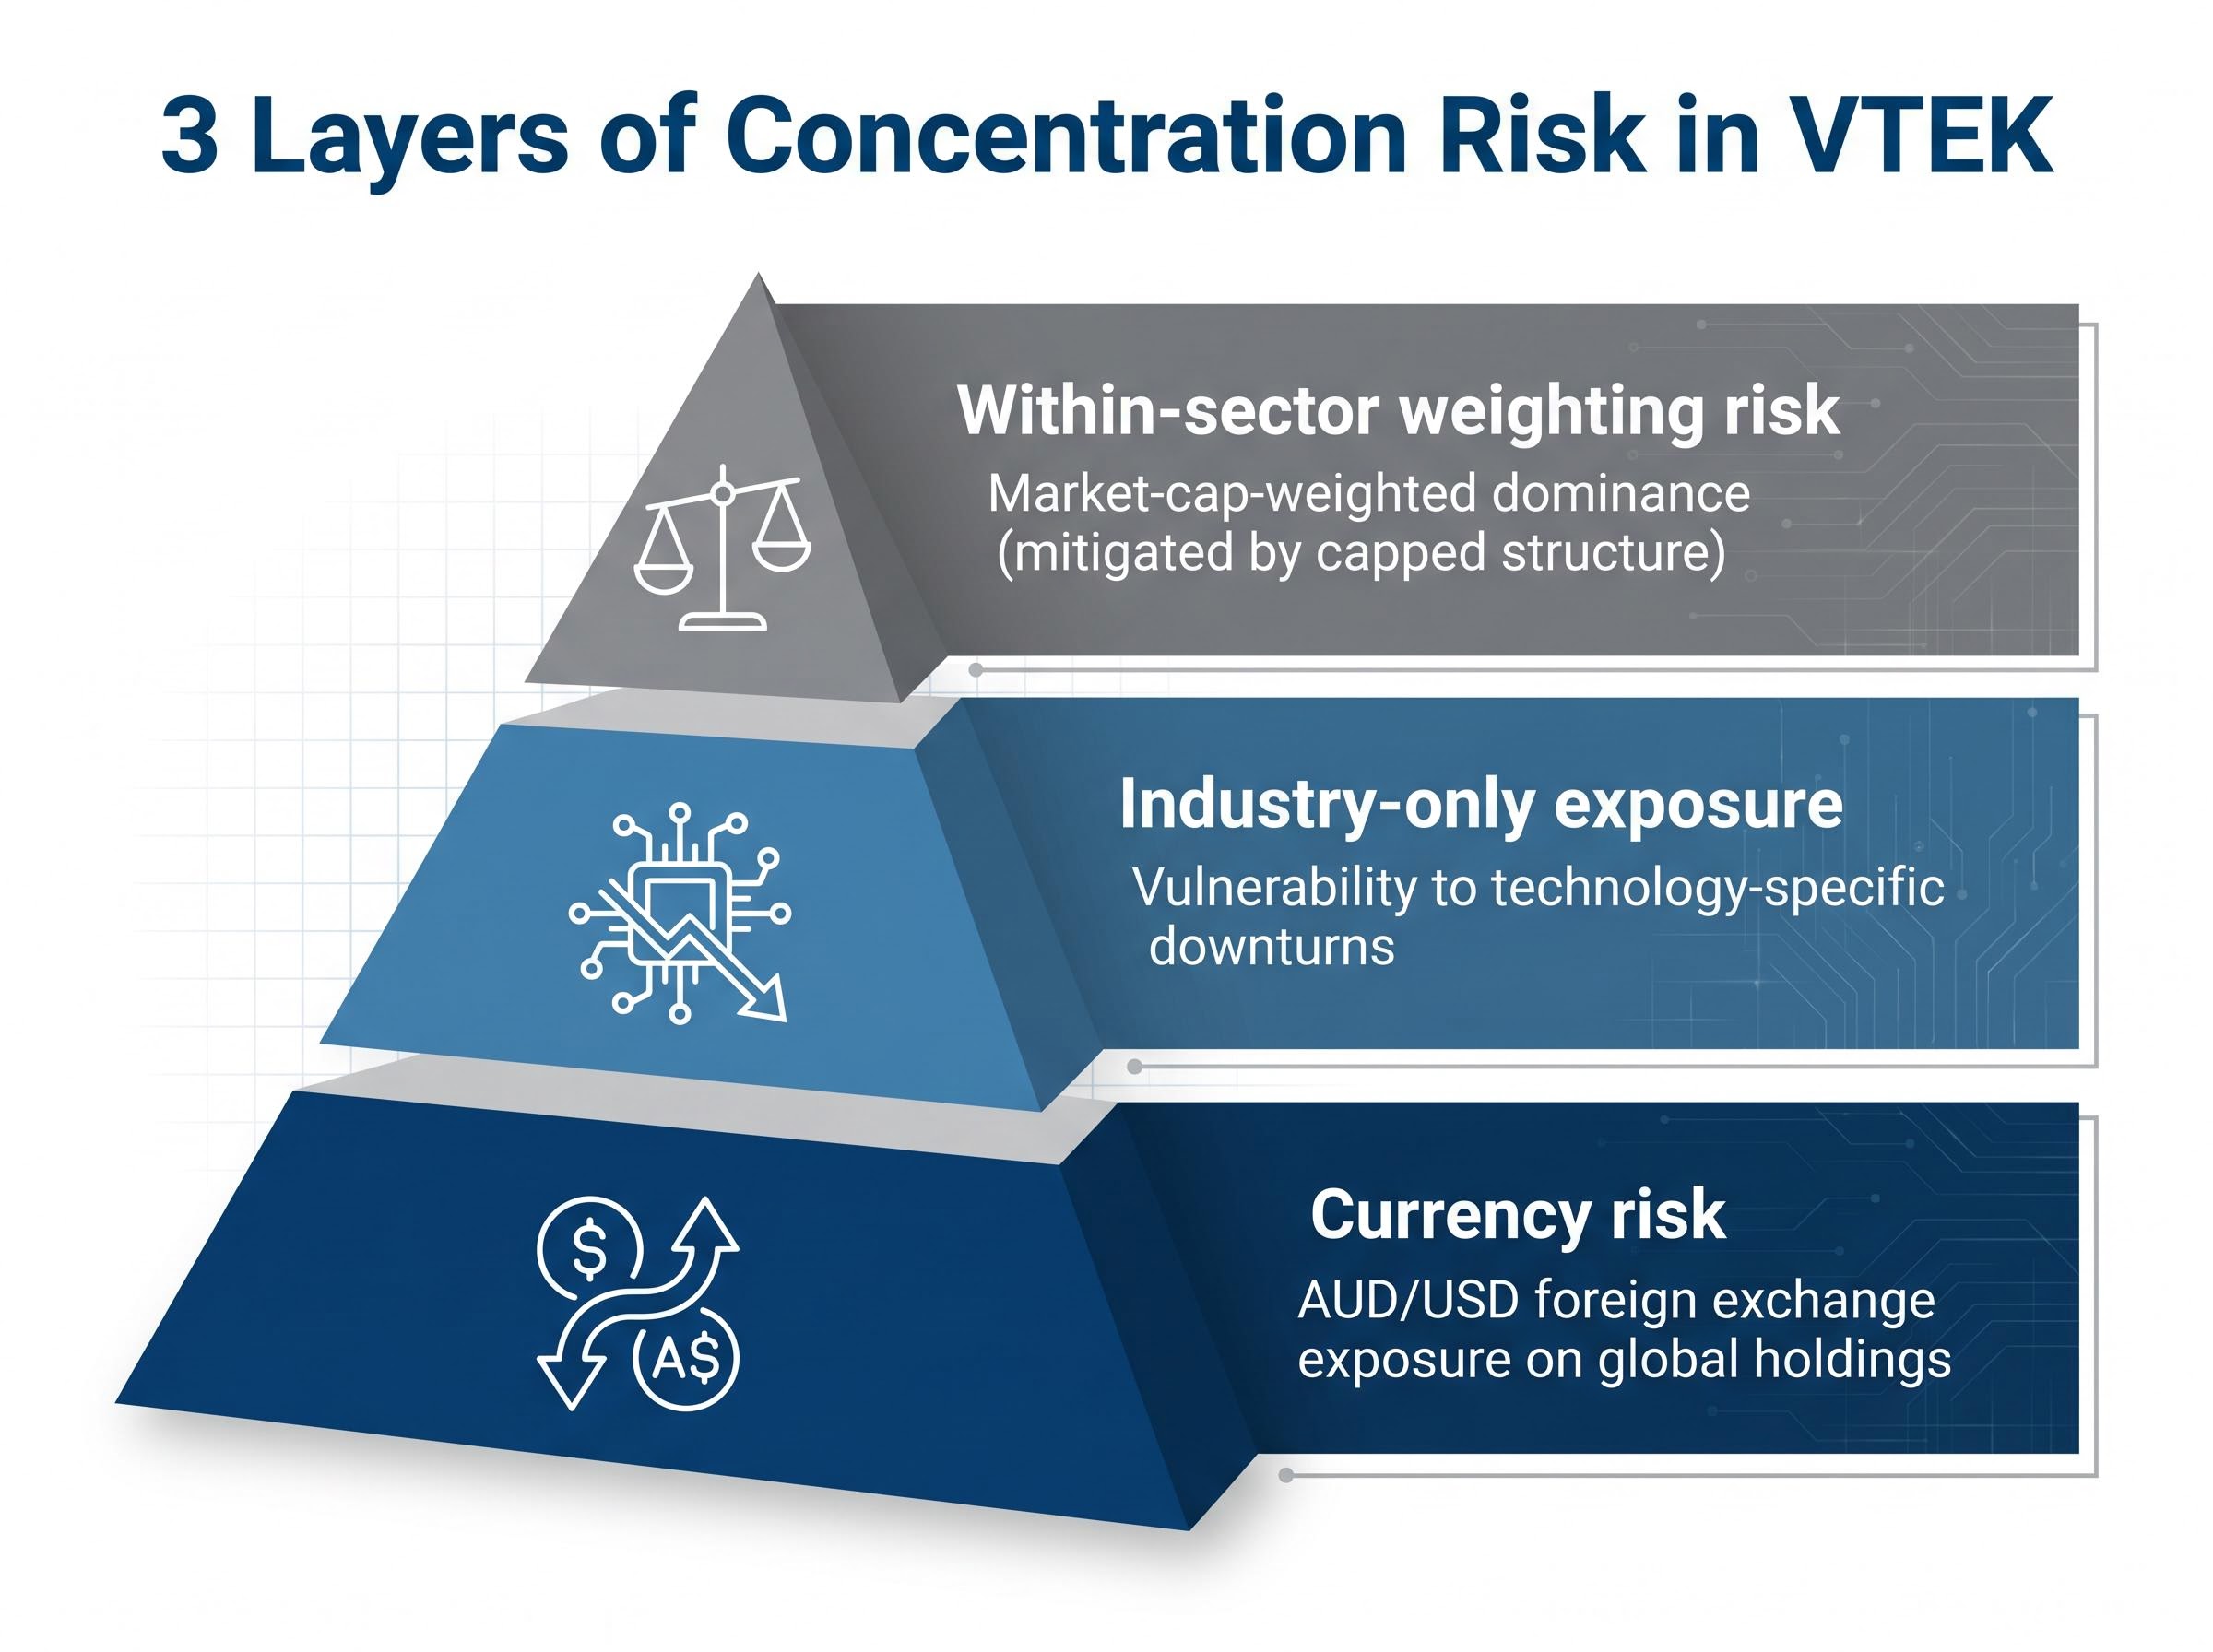
VTEK’s underlying index addresses the first layer directly. The capping mechanism trims individual securities above a size threshold at each rebalance, redistributing weight across smaller holdings within the 300-company portfolio.
The practical effect: no single mega-cap name can dominate VTEK’s returns the way it might in an uncapped, market-cap-weighted technology index. This limits upside capture from a single runaway performer but also limits downside exposure to any single name. It is a within-sector mitigation tool, not a cross-sector diversification solution.
Mega-cap dominance in cap-weighted indices reached a level in 2026 that surpassed the 1930s historical concentration peak, with five names controlling approximately 23% of the broad US market and accounting for more than 70% of the index’s Q1 2026 decline, a dynamic that makes VTEK’s capping mechanism more than a technical footnote.
VTEK arrived on the ASX in late March 2026 during a period of compressed technology valuations relative to the sector’s 2025 peak. The S&P 500 technology sector returned +21.8% in 2025; by early 2026, a portion of that gain had reversed.
For investors evaluating entry timing, a post-selloff starting point can offer structural advantages. A lower average cost base provides an improved margin of safety relative to peak valuations. If the selloff has overshot underlying fundamentals, the entry position is better placed to participate in any mean reversion.
As a general investing principle, entering a position after a selloff can improve the margin of safety relative to peak valuations. This is not a price prediction; it is a statement about the relationship between entry price and long-term return potential.
VTEK’s price of approximately A$57.33 (as of 27 April 2026) serves as a near-launch reference point. Year-to-date performance figures are not meaningful at this stage given the late March launch.
The honest counterpoint: entry-point timing in a sector ETF is not a substitute for understanding whether the underlying thesis remains intact. Short-term price direction is not predictable with confidence, and the difference between buying at the precise trough versus buying two weeks later compresses significantly over a multi-year holding period.
Sector ETFs held over a longer horizon tend to reduce the sensitivity of outcomes to the specific entry price. The distinction matters: VTEK is more suited to a structural allocation decision than a tactical trading view. Investors who hold conviction on the technology sector’s multi-year trajectory may find the precise entry date less consequential than the decision to allocate at all.
The Australian ETF industry launched 73 new products in 2025, with record inflows directed predominantly toward broad-market equity ETFs. Sector products attracted less capital, reflecting investor and adviser preference for core diversified allocations.
Within this context, VTEK positions naturally as a satellite or thematic holding rather than a core allocation. The ASX domestic index is heavily weighted toward financials and resources, underweighting technology. VTEK provides a deliberate tilt toward the sector that the domestic benchmark structurally underrepresents.
ASX home bias has historically left Australian retail portfolios underweight in technology, given the domestic index’s heavy tilt toward financials and resources, and the structural break from that bias accelerated in Q1 2026 when international ETFs overtook domestic funds as the most purchased category across all generational cohorts on major platforms.
Three portfolio construction scenarios illustrate the range:
| Portfolio Role | What VTEK Adds | What VTEK Does Not Replace |
|---|---|---|
| Standalone thematic tilt | Targeted technology exposure across 300 global companies | Broad-market diversification across sectors and geographies |
| Alongside broad-market international ETF | Deliberate technology overweight beyond market-cap weighting | Domestic Australian equity exposure |
| Alongside broad-market international and Australian ETFs | Satellite technology tilt within a diversified core | Defensive or fixed-income allocation |
At an MER of 0.23% per annum, the cost of maintaining this satellite allocation remains modest relative to the targeted sector exposure it delivers.
The investment case for VTEK draws together three supporting elements: a durable structural growth thesis (AI integration, cloud adoption, digital platform moats), a fee-efficient capped index structure that manages within-sector concentration at 0.23% per annum across 300 companies spanning developed and emerging markets, and an entry price that reflects post-selloff compression rather than peak optimism.
The risks that remain are real, and should not be minimised:
VTEK suits investors who hold a structural conviction on global technology’s role in the economy, positioned as part of a broader portfolio, not as a substitute for diversification.
For investors wanting to stress-test the technology growth thesis before committing to a sector allocation, our deep-dive into AI infrastructure monetisation risks examines the disconnect between hardware deployment and software revenue conversion, including the power grid constraints and user growth shortfalls that could pressure valuations if capital expenditures fail to translate into proportionate earnings.
The distinction between a thesis-driven allocation and a momentum-driven trade is worth preserving. Investors who understand the structural forces underpinning their holdings tend to behave differently during volatility than those who entered on recent performance alone. For those with a long-term view on technology’s trajectory, VTEK offers a fee-efficient, structurally considered vehicle to express that conviction on the ASX.
This article is for informational purposes only and should not be considered financial advice. Investors should conduct their own research and consult with financial professionals before making investment decisions. Past performance does not guarantee future results. Financial projections referenced in this article are subject to market conditions and various risk factors.
VTEK is a Vanguard ETF listed on the ASX that tracks the FTSE All-World Technology 300 Capped Net Tax Index, giving investors exposure to 300 large and mid-cap global technology companies with a management expense ratio of 0.23% per annum. The capped index structure limits the weight of any single holding at each rebalance, reducing the risk of mega-cap dominance within the portfolio.
VTEK began trading on the ASX in late March 2026, with an inception date of approximately 24-25 March 2026, making it a very recently listed product with limited trading history to assess.
VTEK uses a capped index structure that trims individual securities above a size threshold at each rebalance, preventing any single mega-cap from dominating the portfolio. However, investors should note that this mechanism only addresses within-sector concentration and does not provide diversification across other industries or asset classes.
VTEK is best positioned as a satellite or thematic holding rather than a core allocation, particularly for investors looking to correct the underrepresentation of technology in the ASX-heavy domestic index. It works well alongside broad-market international and Australian ETFs in a core-satellite structure.
Key risks include sector concentration (no cross-industry diversification), AUD/USD currency exposure from predominantly USD-denominated holdings, interest rate sensitivity affecting technology valuations, and ongoing regulatory scrutiny facing large global technology companies.