Cook Warns Memory Costs Will Force Apple Price Increases in 2026
47 mins ago

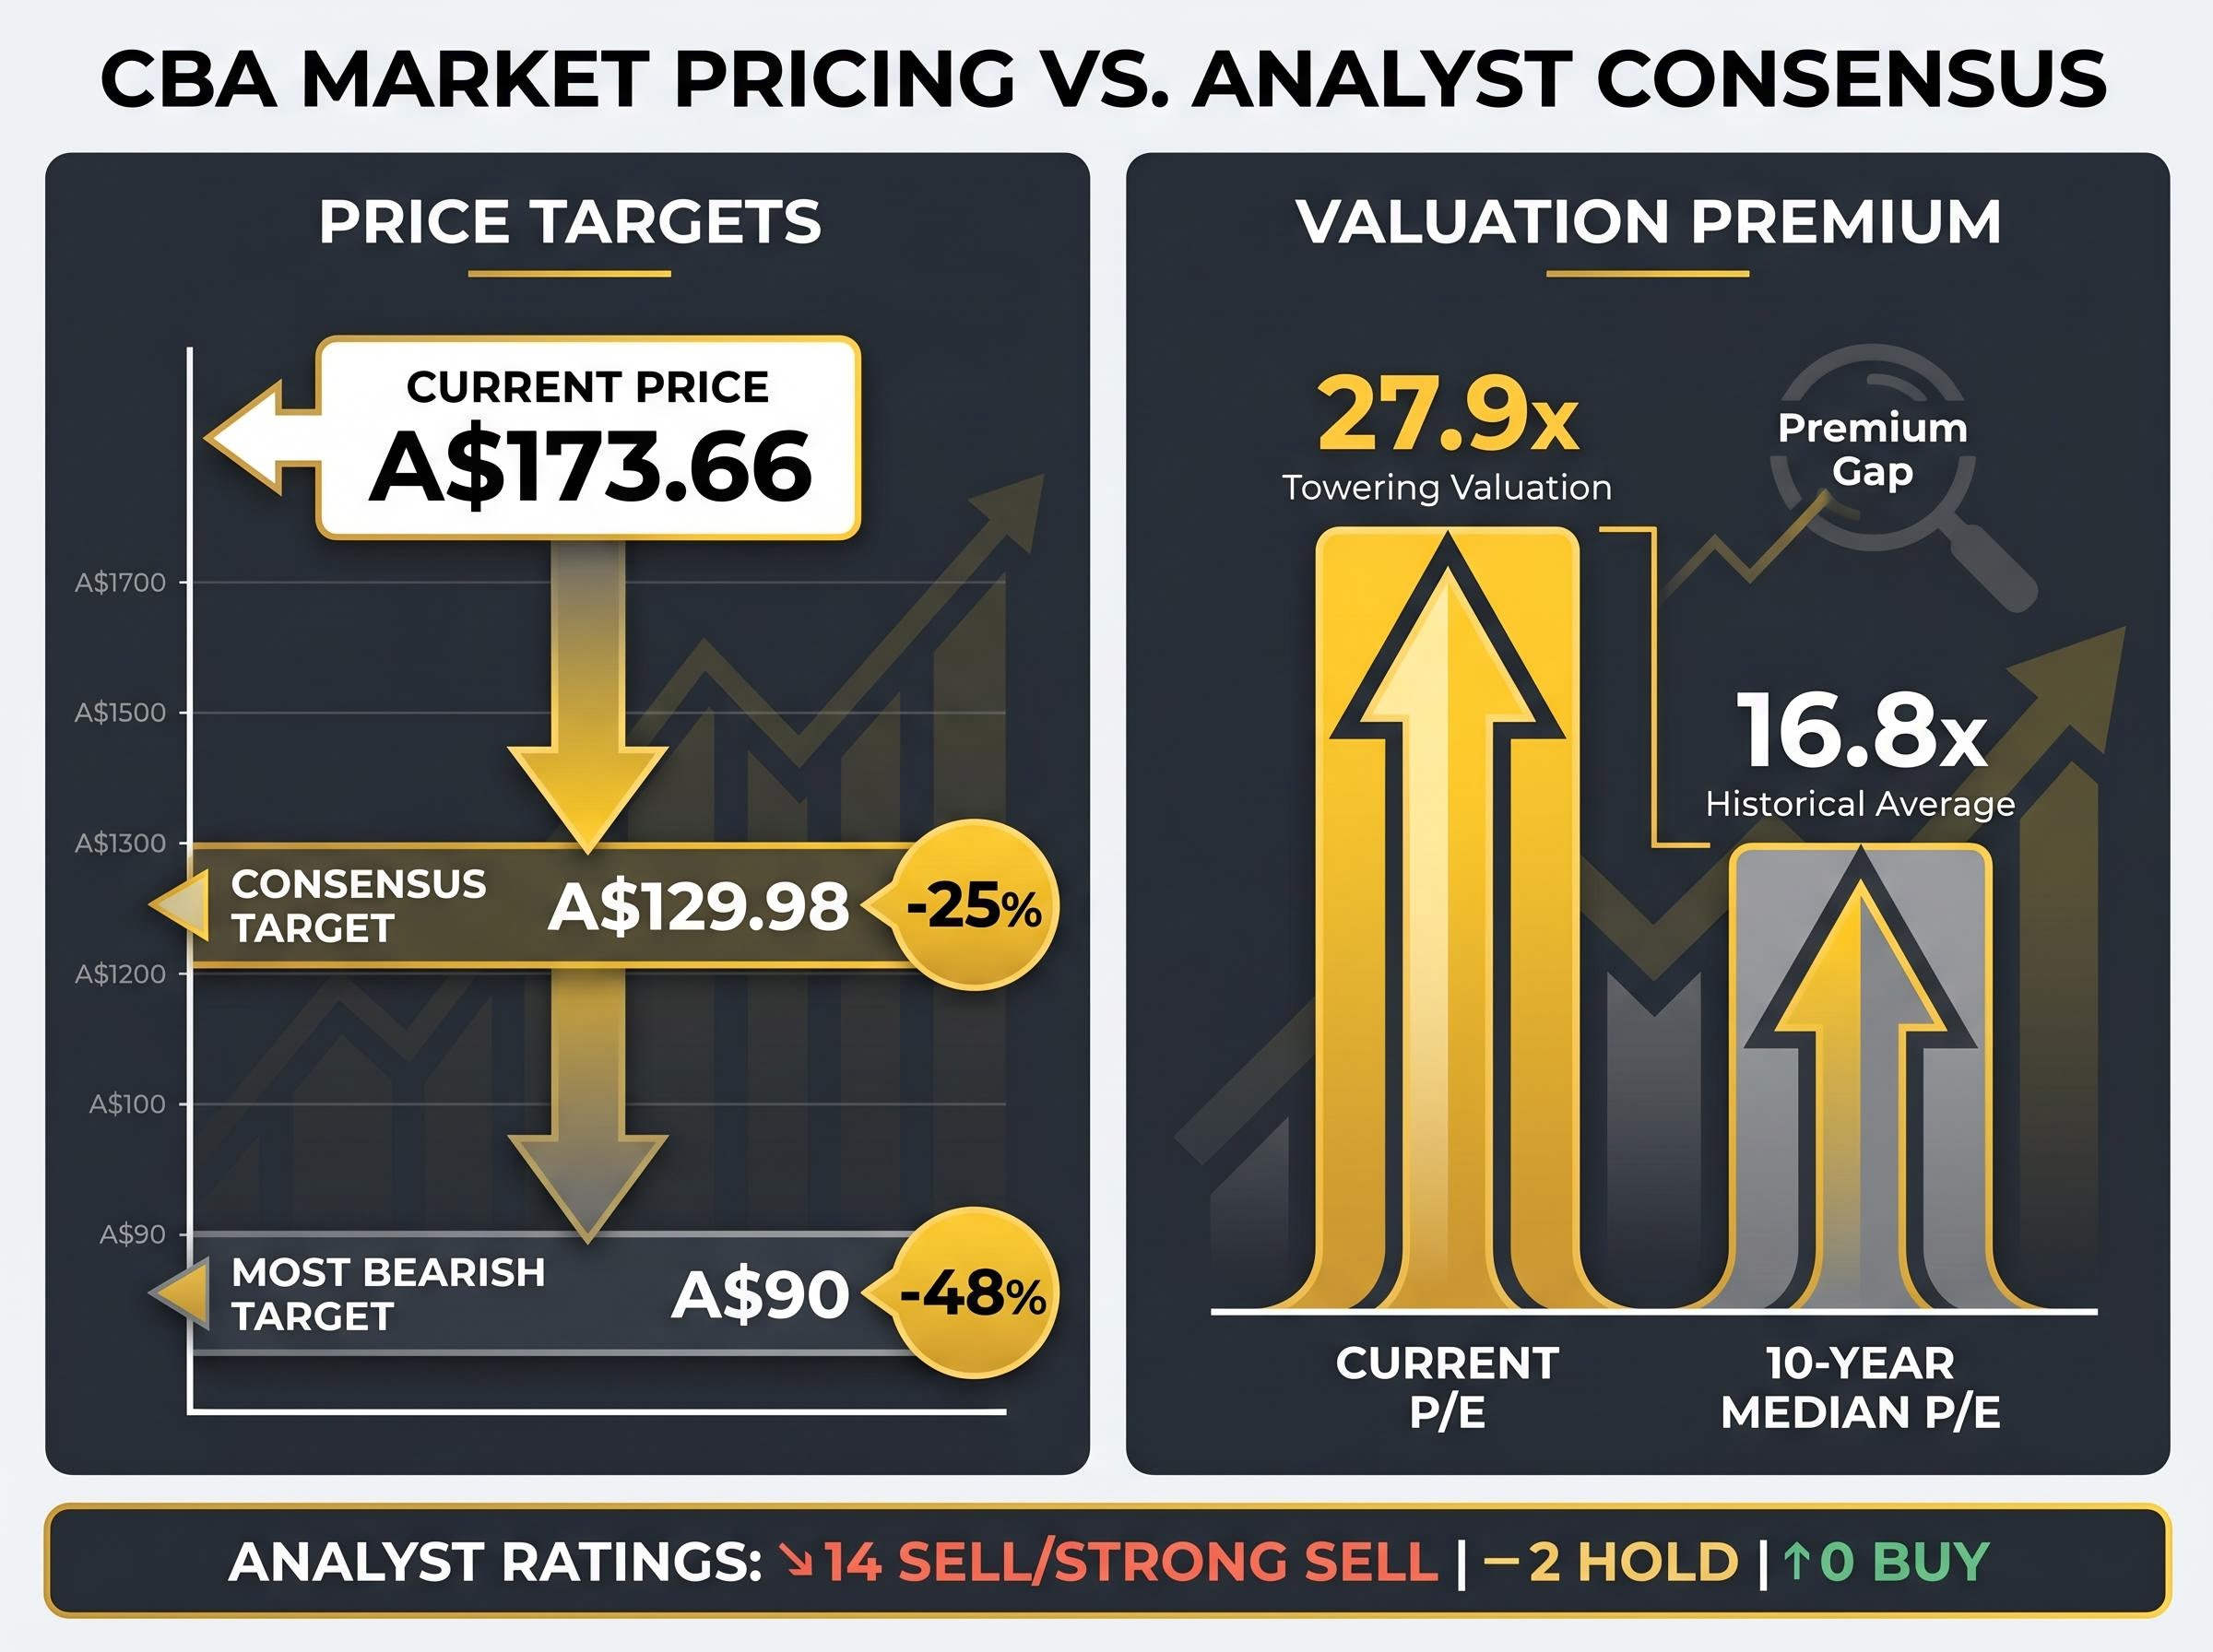
Fourteen of sixteen analysts covering Commonwealth Bank of Australia (CBA) rate the stock a sell. The consensus price target implies a 25% fall from the current CBA share price of approximately A$173.66. The most bearish projection on record sees a 48% crash. Yet CBA’s share registry remains dominated by long-term holders, many of whom have no plans to exit.
The disconnect is not irrational. It reflects two fundamentally different questions being asked of the same stock. One is about capital growth and whether a trailing price-to-earnings (P/E) ratio of 27.9x, roughly 66% above the bank’s 10-year median multiple, can be sustained. The other is about income, and whether CBA’s fully franked dividend, paid without interruption since 2006, justifies holding regardless of where the share price trades next quarter. This analysis unpacks the logic behind that second question: why the income thesis and the growth thesis are not just different in degree but different in kind, and what risks the income case still carries.
The wall of sell ratings is difficult to ignore. According to TradingView data, CBA carries one of the most lopsided analyst consensuses on the ASX.
14 of 16 analysts rate CBA a sell or strong sell. Two rate it a hold. Zero rate it a buy. The consensus 12-month price target sits at A$129.98, implying approximately 25% downside from the current price.
The bearish case rests on straightforward valuation arithmetic:
Morningstar’s analysis of Australian bank overvaluation flags CBA as the most stretched of the Big Four, with a price-to-earnings ratio and price-to-book multiple that sit well above the sector median, a finding that reinforces the sell consensus without resolving the separate question of whether the income profile justifies holding through a re-rating.
Yet CBA shares rose more than 12% following the February 2026 half-year results and have gained nearly 8% year-to-date as of late April 2026. The premium has persisted for an extended period without triggering the correction analysts project. That persistence is not proof the premium is justified, but it does suggest the sell consensus is answering one specific question (is CBA overvalued on a capital growth basis?) while a significant proportion of holders are asking a different one entirely.
The income thesis does not depend on CBA being fairly valued. It depends on the dividend being reliable.
CBA has paid a fully franked semi-annual dividend without interruption since 2006, a span that includes the global financial crisis, a pandemic, and a Royal Commission. The most recently declared dividend of A$2.35 per share (fully franked, paid March 2026) annualises to approximately A$4.70 per share, producing a raw yield of roughly 2.7% at the 30 April 2026 closing price of A$173.66.
CBA’s Fitch credit rating upgrade to AA in March 2026, with a Stable outlook, provides institutional corroboration of the earnings quality argument: the upgrade cited balance sheet strength and earnings resilience, the same characteristics that underpin the dividend sustainability case for income holders weighing the 72% payout ratio against a premium valuation.
On its own, 2.7% does not look compelling. But the headline number understates the income for Australian investors who hold CBA through tax-advantaged structures, because the dividend is fully franked.
A fully franked dividend carries a 30% corporate tax credit attached to each payment. The company has already paid tax on the profits distributed, and that tax credit flows through to the shareholder.
For investors in lower tax brackets, franking credits reduce personal tax payable below what they would owe on an equivalent unfranked payment. For self-managed superannuation funds (SMSFs) in pension phase, where the tax rate is zero, franking credits are fully refundable in cash.
The effect is material. Key dividend metrics at the current share price:
For income-focused holders, this is the core of the case: not the yield in isolation, but the yield after franking, supported by a two-decade record of uninterrupted payments through severe economic disruptions.
The difference between a 2.7% raw yield and the effective yield for a tax-exempt investor is not a rounding error. In dollar terms, it changes the income profile materially.
On an investment of A$8,000 at the current share price of A$173.66, the grossed-up yield inclusive of franking credits is approximately 4.0%, equating to roughly A$322 in annual passive income. For an SMSF in pension phase, the franking credits are not merely an offset against tax owed; they are refunded in cash, converting CBA’s headline 2.7% yield into a meaningfully higher effective return.
The table below illustrates how the effective yield varies by investor type:
| Investor Type | Raw Yield | Franking Credit Value | Effective Gross Yield |
|---|---|---|---|
| SMSF (pension phase) | ~2.7% | Full refund (~1.3%) | ~4.0% |
| Low-rate taxpayer | ~2.7% | Partial offset | ~3.5-3.8% |
| Top marginal rate taxpayer | ~2.7% | Offset against tax owed | ~3.85% |
For SMSFs in pension phase, the effective gross yield of approximately 4.0% makes CBA’s income profile materially more competitive than the raw 2.7% figure suggests when compared to unfranked domestic alternatives or international income options.
This is the mechanism that sustains CBA’s appeal as an income holding even when raw yield comparisons place it well behind its peers.
On a raw yield basis, CBA is the least generous income payer among Australia’s major banks, and not by a narrow margin.
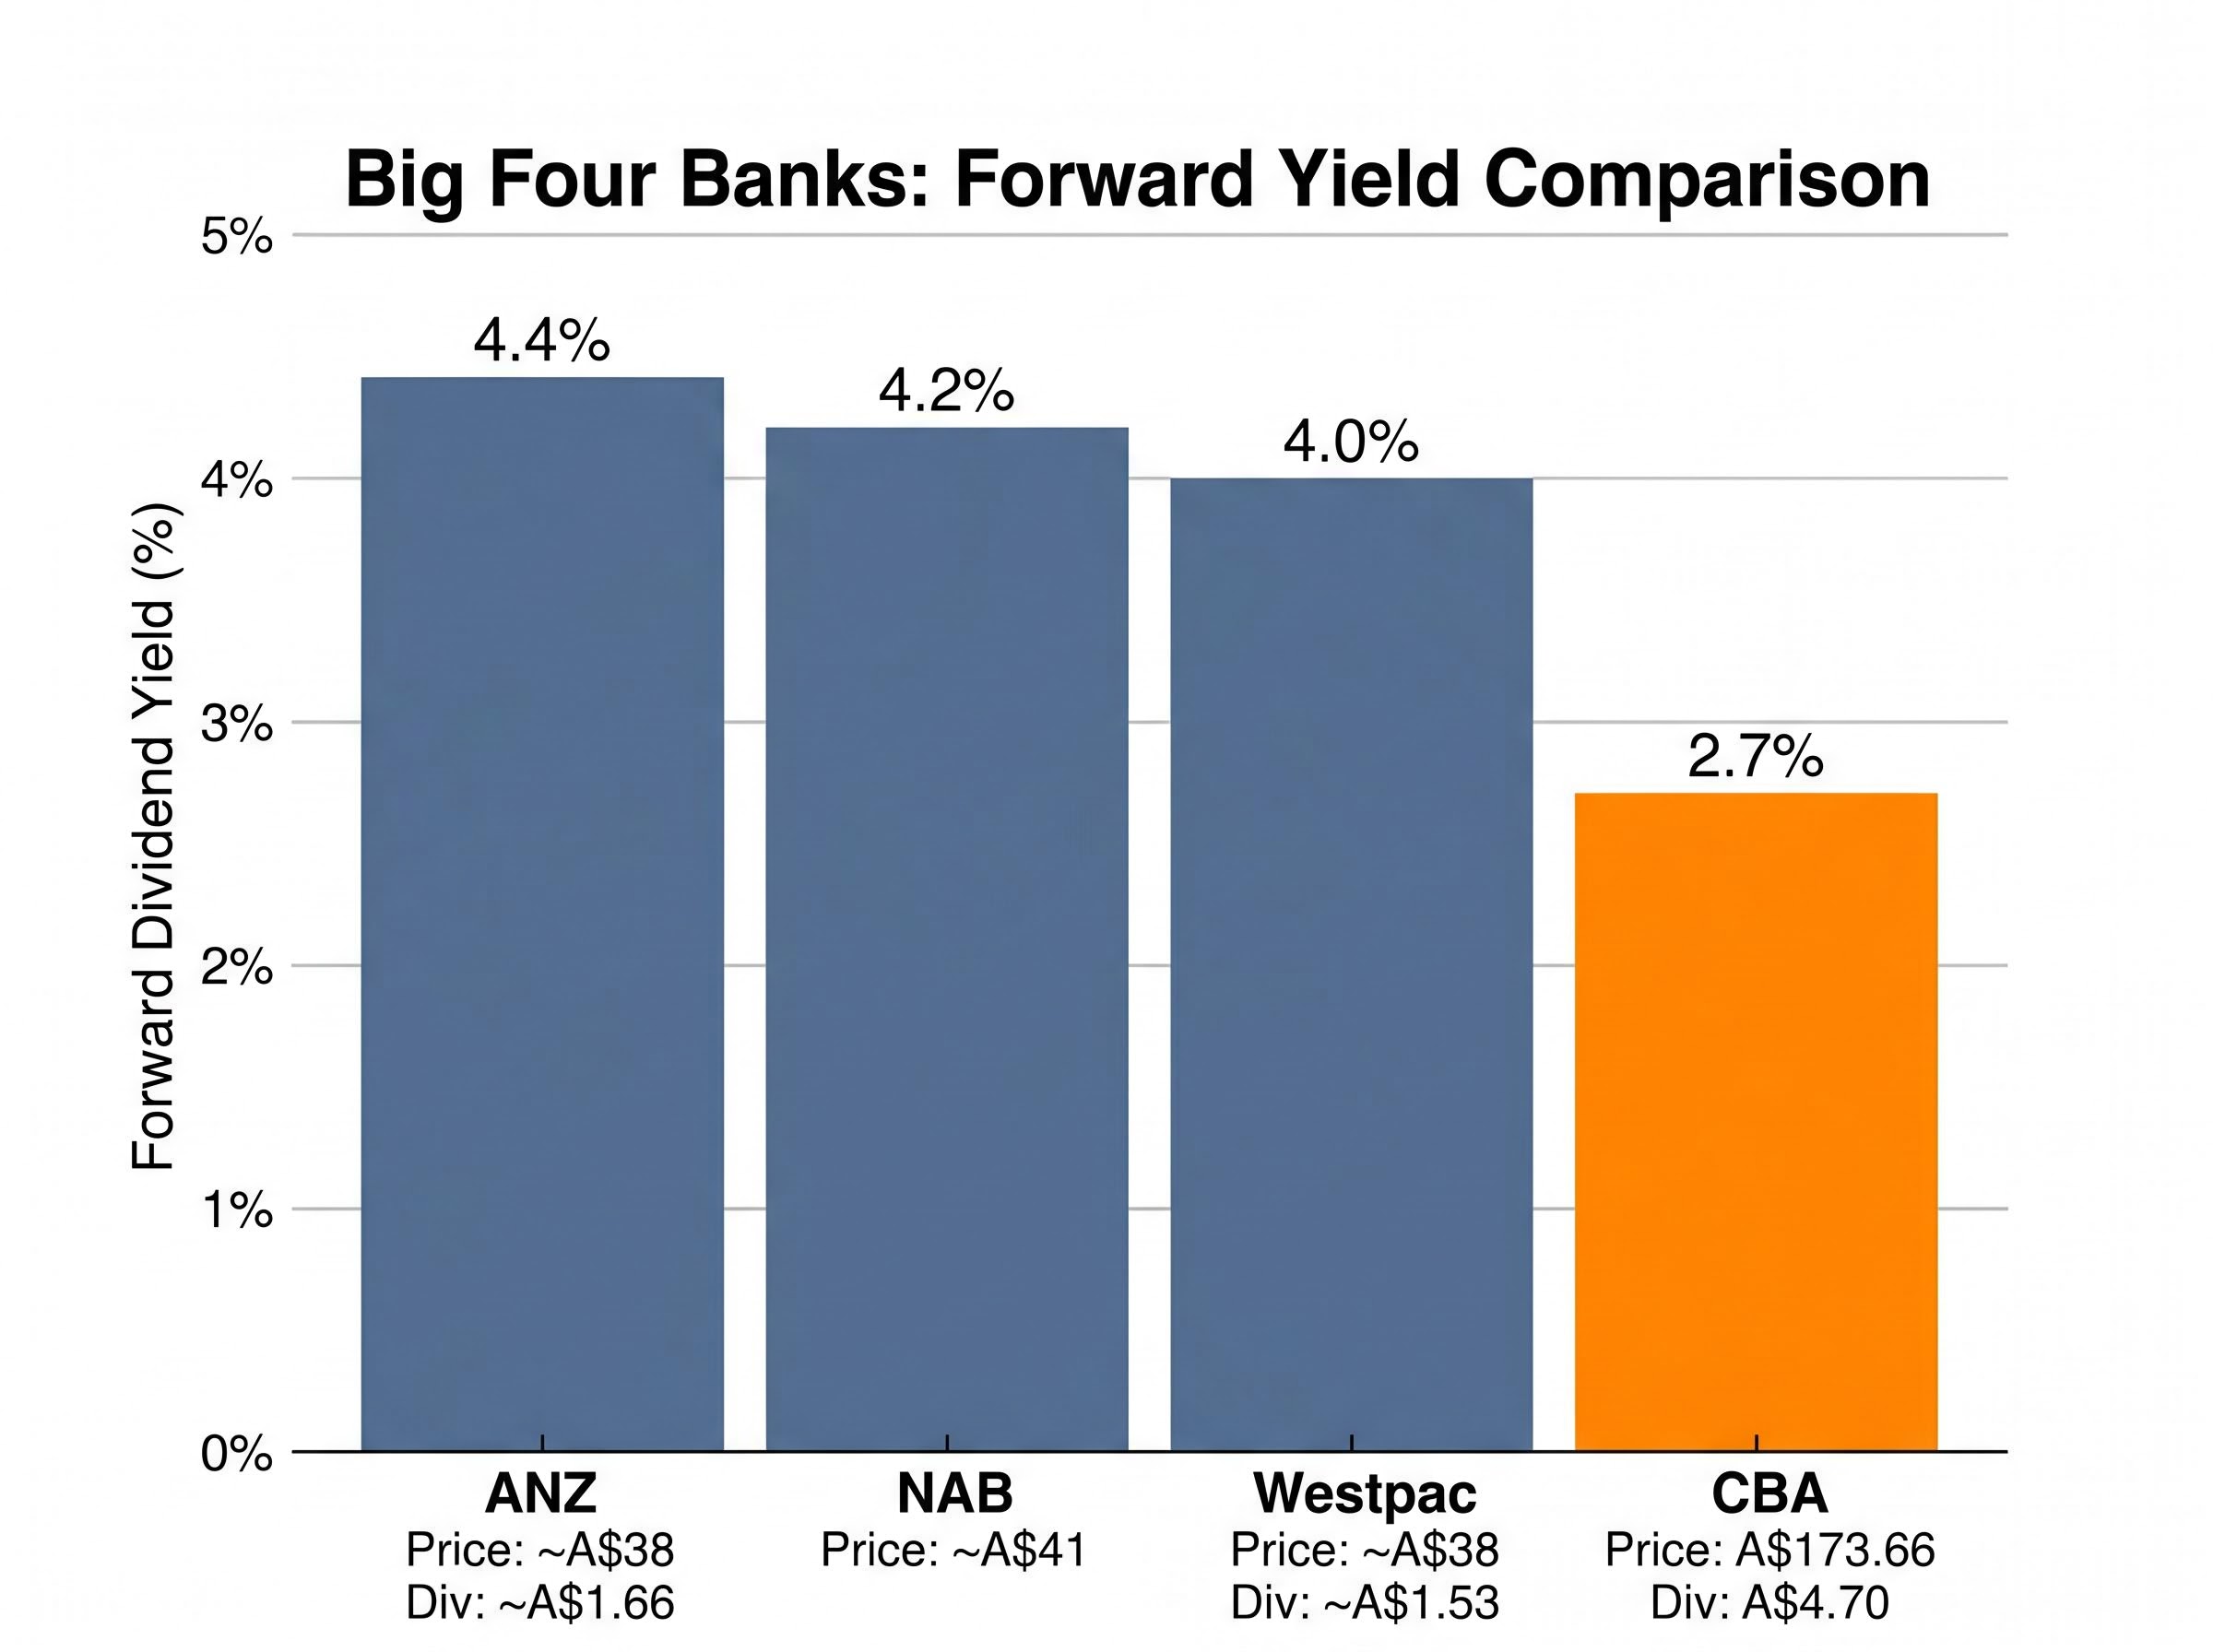
| Bank | Share Price (approx.) | Annual Dividend (approx.) | Forward Yield (approx.) |
|---|---|---|---|
| CBA | A$173.66 | A$4.70 | ~2.7% |
| ANZ | ~A$38 | ~A$1.66 | ~4.4% |
| NAB | ~A$41 | — | ~4.2% |
| Westpac | ~A$38 | ~A$1.53 | ~4.0% |
ANZ at approximately 4.4%, NAB at 4.2%, and Westpac at 4.0% all offer materially higher forward yields. The gap is wide enough that an income-maximising investor allocating fresh capital to Australian banks would have difficulty justifying CBA on yield alone.
CBA’s lower yield is not the product of a smaller dividend. It is the product of a higher share price, driven by a valuation premium its peers do not command. CBA’s HY 2026 cash net profit after tax of A$5.44-5.45 billion, up 6% year-over-year, supports the argument that the premium reflects earnings quality. Whether it justifies the yield sacrifice is a separate question.
Investors choosing CBA over peers on income grounds are implicitly making one of two bets: that CBA’s dividend growth trajectory will narrow the yield gap over time, or that the defensive premium carries value that a raw yield comparison does not capture.
The income case for CBA is defensible, but it is not risk-free. Three vulnerabilities deserve direct attention.
The rate hike cycle trajectory matters particularly for CBA’s mortgage portfolio because oil futures backwardation signals the market views the current inflationary impulse as temporary, meaning the rate environment that currently supports NIM expansion may reverse faster than consensus pricing implies, compressing the margin tailwind that has underpinned recent earnings growth.
CBA’s own economists have described the May 2026 RBA decision as “finely balanced,” suggesting genuine uncertainty about the rate trajectory from here.
The Q3 FY2026 trading update, scheduled for 13 May 2026, will provide the next concrete signal on margin trends, credit quality, and operating cost trajectory. Income-focused holders should treat it as a near-term test of the earnings resilience that underpins the dividend.
The analyst sell consensus and the income holder’s conviction are not in direct conflict. They are answering different questions with different evidence.
For investors evaluating their CBA position, the first step is identifying which question applies:
CBA’s five-year price appreciation of approximately 95% (from A$89.04 to roughly A$173.66) means an investor who placed A$10,000 in April 2021 would hold approximately A$19,500 today. The 72% payout ratio maintained through HY 2026 supports dividend sustainability near-term, and elevated market volatility throughout 2026 has reinforced CBA’s status as a perceived safe-haven within Australian equities.
The income case is most coherent for specific investor profiles: SMSFs in pension phase, where franking credits are fully refundable; retirees with low or zero marginal tax rates, where the gross-up is maximised; and long-horizon holders using CBA as a defensive anchor within a diversified portfolio.
For investors whose primary objective is yield maximisation on a raw basis, ANZ and NAB currently offer materially higher income without the same valuation premium. That trade-off is worth acknowledging rather than dismissing.
Investors weighing CBA against its Big Four peers on income grounds will find our full explainer on Australian investor trends shifting away from ASX home bias examines why international ETF inflows overtook domestic fund purchases for the first time in Q1 2026, covering the macro drivers, generational cohort data, and portfolio reallocation patterns that provide context for evaluating concentrated domestic bank exposure.
The analyst consensus is not wrong. On a capital growth basis, CBA’s valuation leaves limited margin for error. A trailing P/E of 27.9x against a 10-year median of 16.8x is a measurable premium, and one that the sell-side is correct to flag.
What the consensus does not address, and what much of CBA’s registry appears to be prioritising, is the income continuity question. CBA’s fully franked dividend, held through a tax-advantaged structure such as a pension-phase SMSF, is a defensible income position backed by two decades of uninterrupted payments and a 72% payout ratio supported by 6% earnings growth in the most recent half. The question is whether the current share price leaves room for error if that earnings growth slows.
Three signals will shape the answer in the near term:
This article is for informational purposes only and should not be considered financial advice. Investors should conduct their own research and consult with financial professionals before making investment decisions. Past performance does not guarantee future results.
Most analysts rate CBA a sell because its trailing price-to-earnings ratio of 27.9x sits roughly 66% above its 10-year median multiple of 16.8x, implying limited room for capital growth. However, many long-term holders are prioritising income rather than price appreciation, which is a separate investment question the sell consensus does not fully address.
A fully franked dividend carries a 30% corporate tax credit attached to each payment, reflecting tax already paid by the company on its profits. For Australian investors in low tax brackets or SMSFs in pension phase, these credits can be fully refunded in cash, lifting CBA's raw yield of approximately 2.7% to an effective gross yield of around 4.0%.
CBA offers the lowest raw forward yield among the Big Four at approximately 2.7%, compared to ANZ at 4.4%, NAB at 4.2%, and Westpac at 4.0%. The gap reflects CBA's higher share price driven by a valuation premium its peers do not command, rather than a smaller dividend payment.
CBA's payout ratio stands at 72% of cash profit, supported by 6% earnings growth in HY 2026 and a Fitch credit rating upgrade to AA in March 2026. The dividend has been paid without interruption since 2006, though rising operating costs and potential rate environment changes represent risks income investors should monitor.
Three near-term catalysts are the Q3 FY2026 trading update scheduled for 13 May 2026, the RBA's May 2026 rate decision (described by CBA's own economists as finely balanced), and the trajectory of operating costs which grew 3% half-on-half in HY 2026. These events will provide the clearest signals on whether CBA's earnings resilience and dividend sustainability remain intact.