Goldman Sachs Cuts 2026 Smartphone Shipment Forecast 10% on AI Crunch
12 mins ago
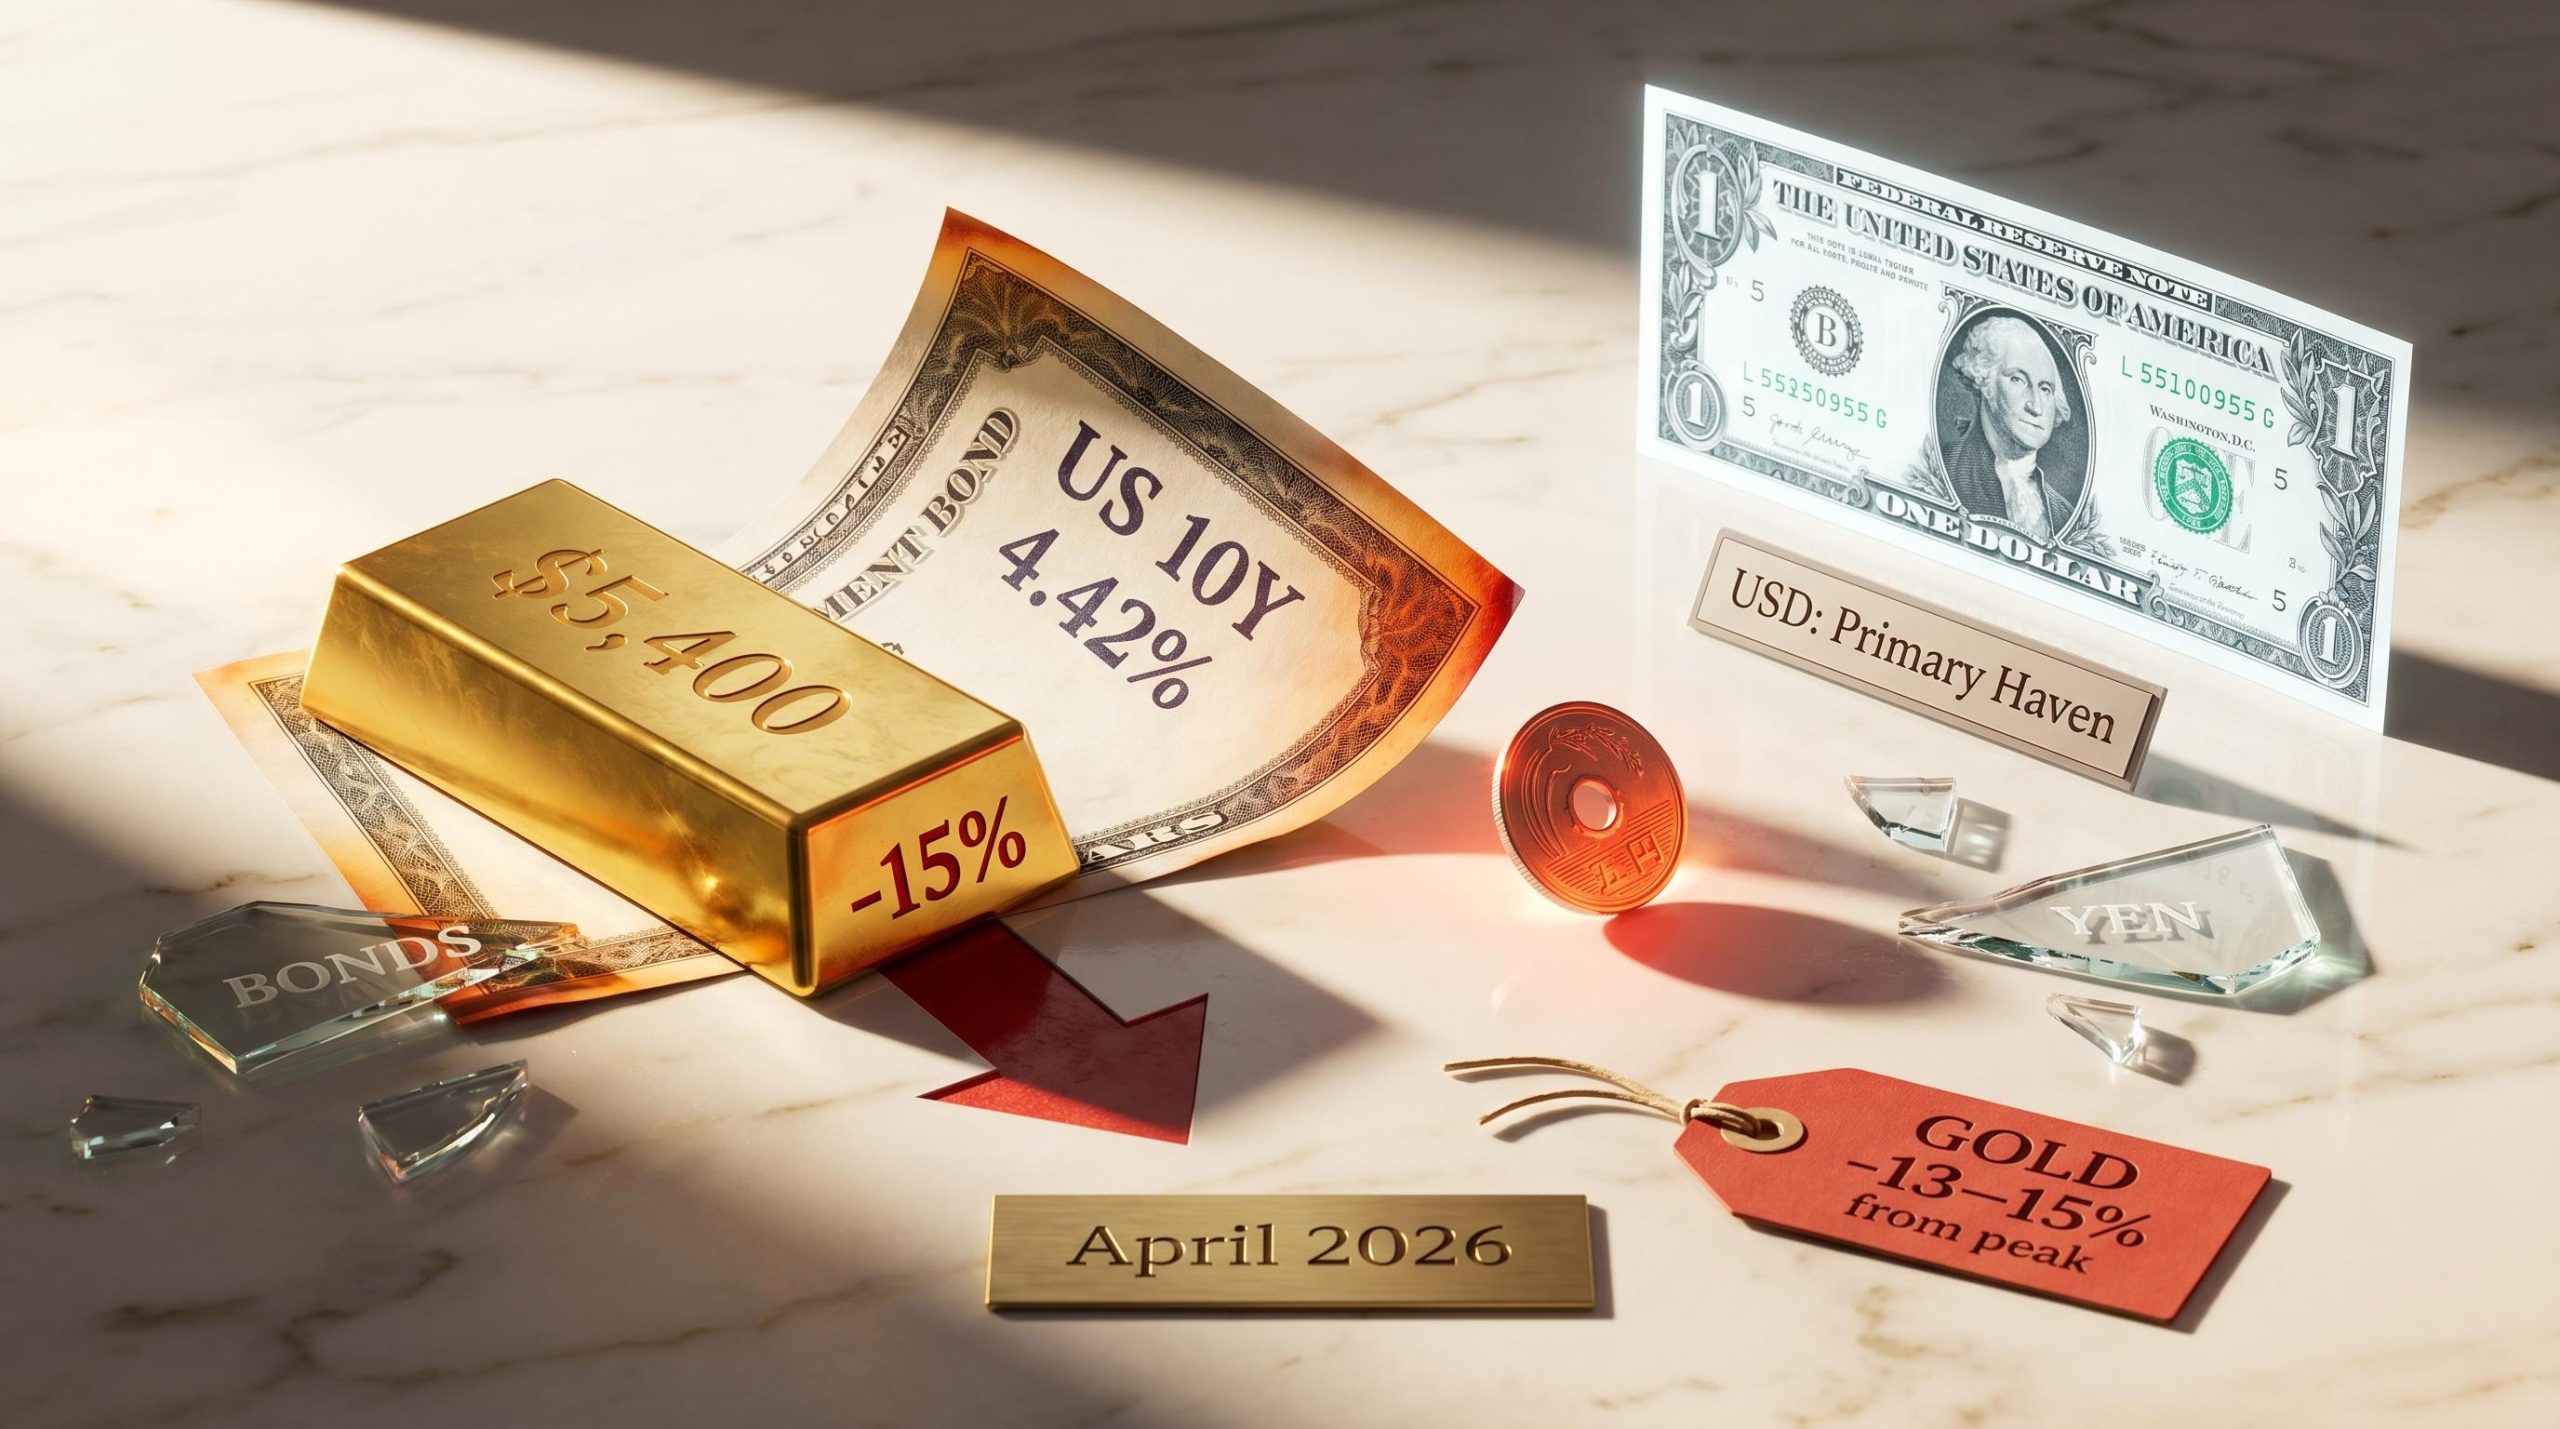
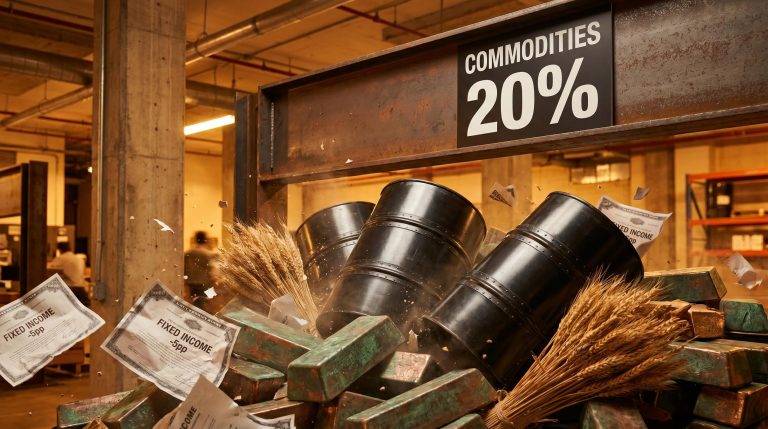
Gold surged to $5,400 an ounce when the Iran War began. Six weeks later, it had given back 15% of that gain. Bonds fell in the same quarter. The yen weakened. For Australian investors who built defensive portfolios around exactly these assets, the crisis delivered the opposite of what the playbook promised.
The Iran War’s closure of the Strait of Hormuz has generated what the International Energy Agency has described as the largest oil supply disruption on record, and that single structural fact is enough to break the logic underpinning four decades of crisis-portfolio construction. This is not a familiar demand-driven downturn where central banks cut rates and bonds rally. It is a supply-side shock that simultaneously drives inflation and suppresses growth, leaving conventional safe haven assets in precisely the wrong position.
What follows unpacks why each major defensive asset is misfiring, what structural dynamic is driving the divergence, and what Australian investors should actually be holding in a stagflationary crisis environment.
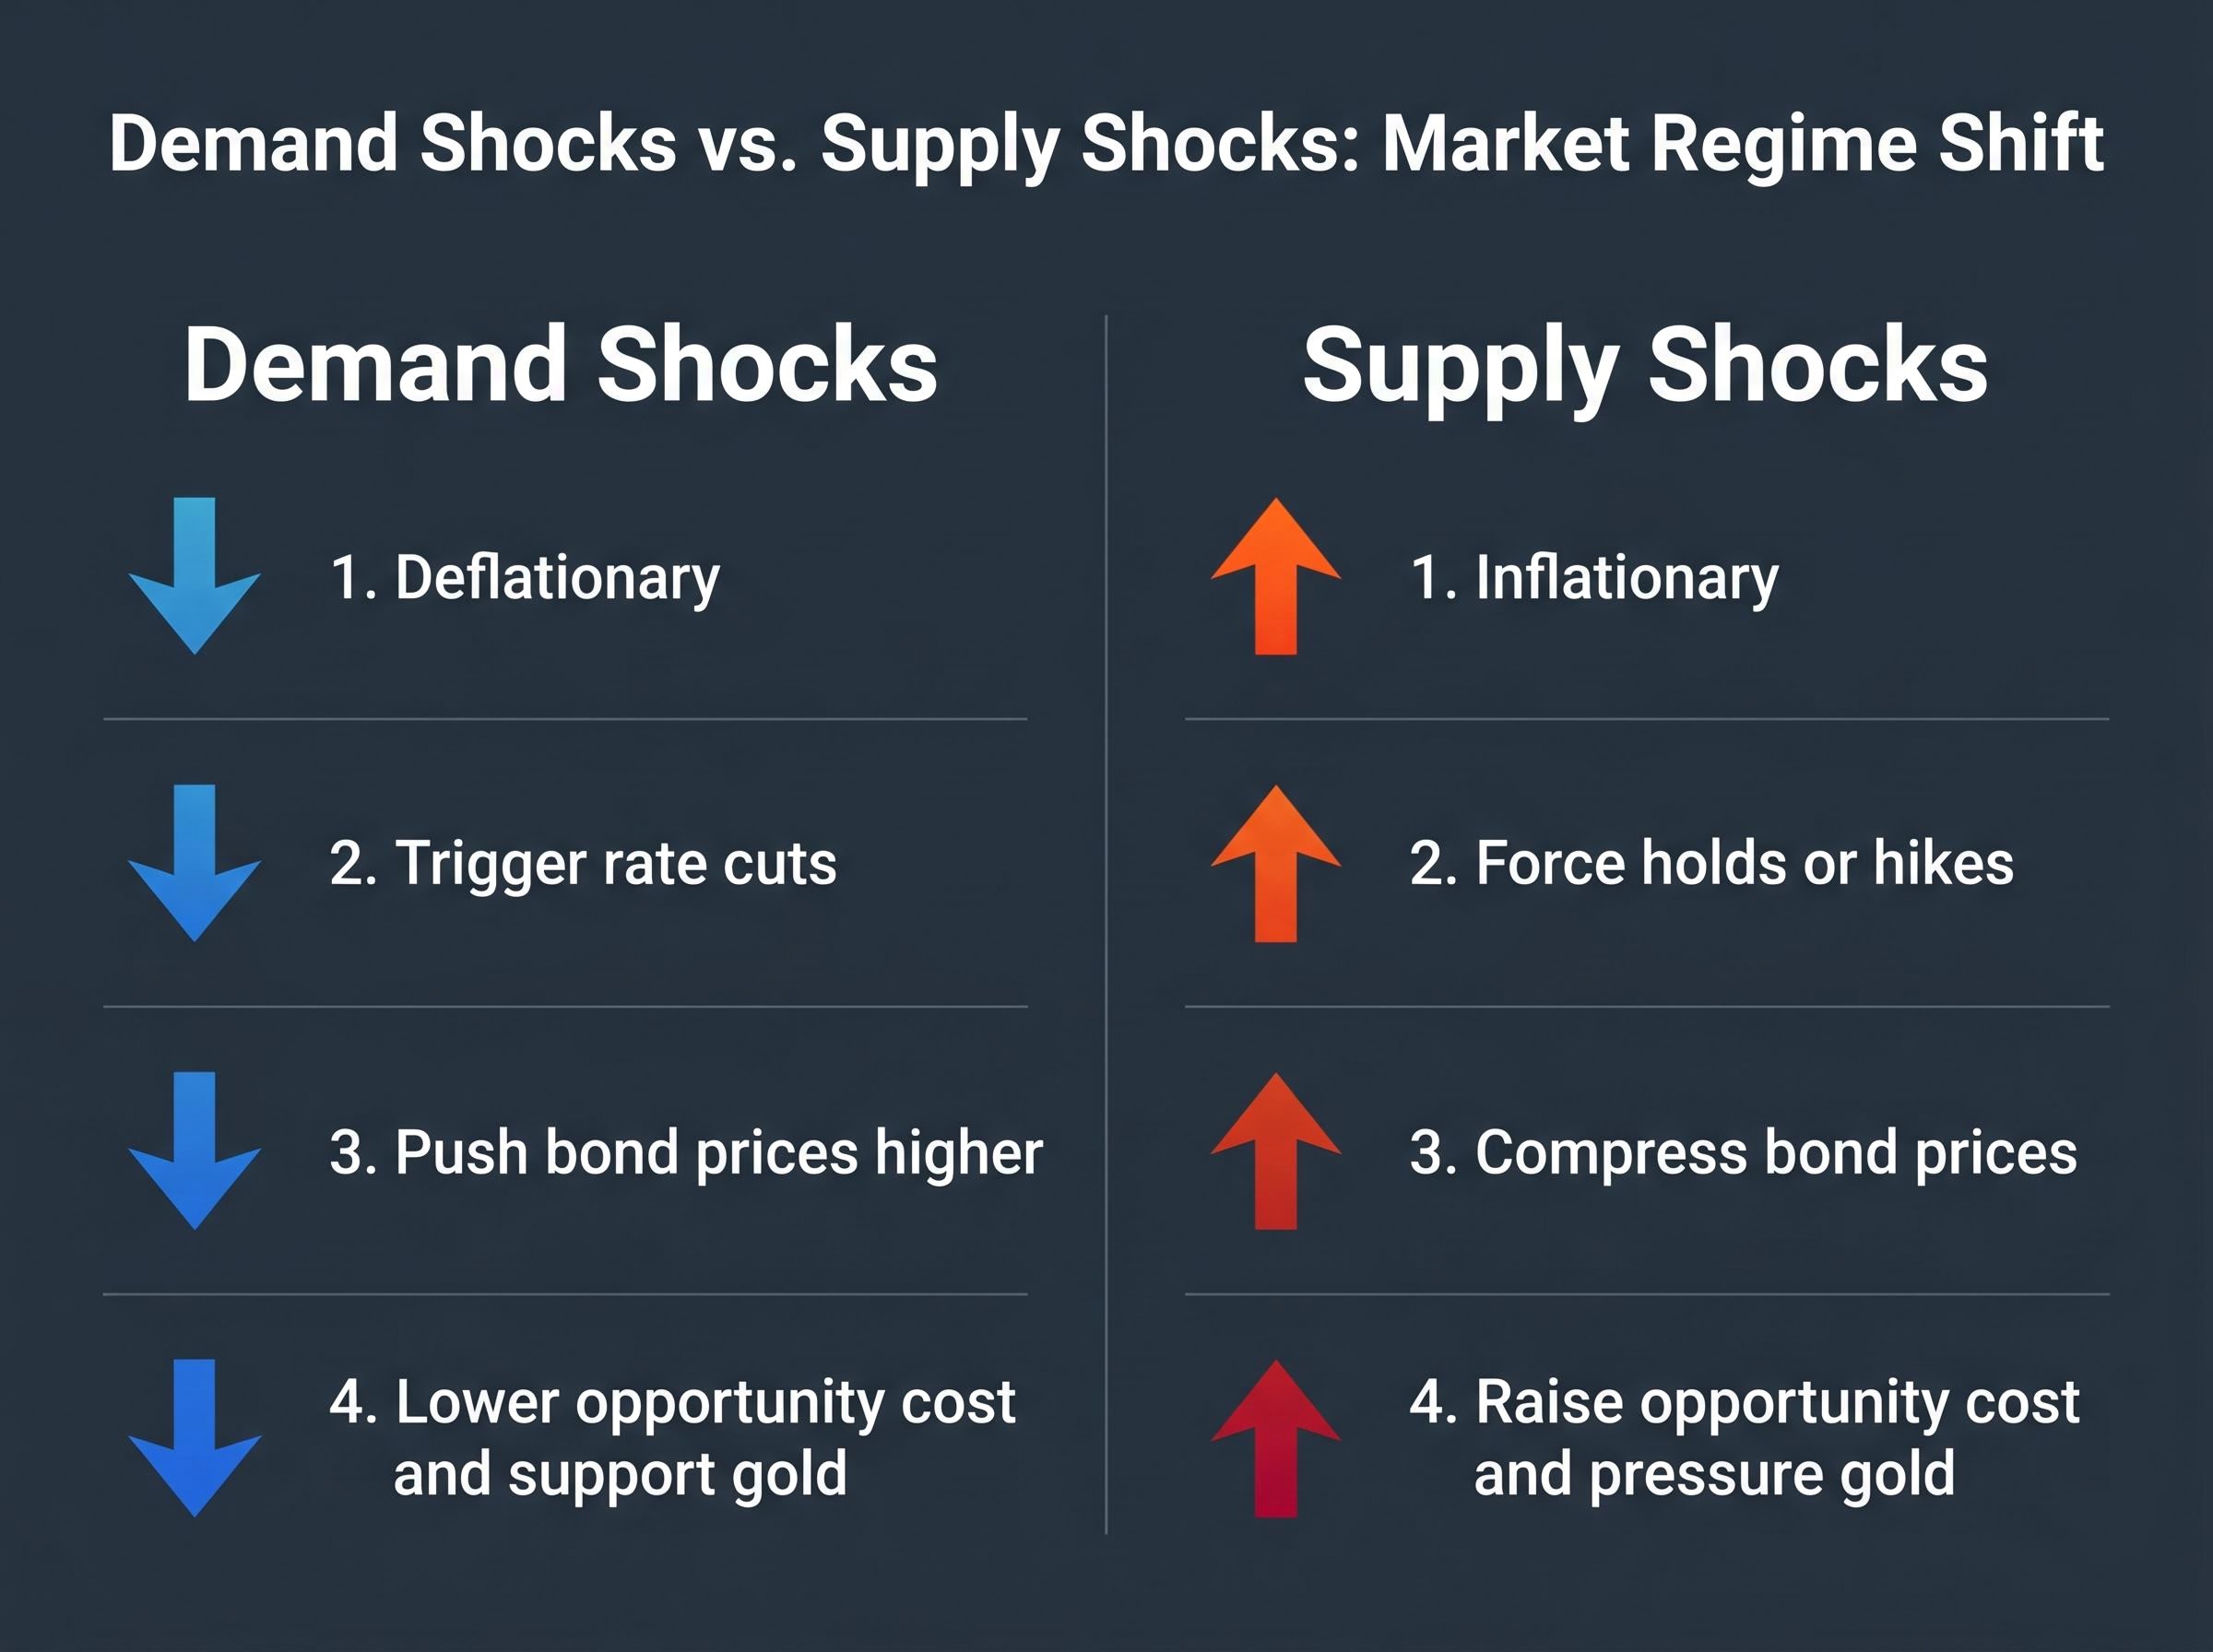
For roughly forty years, the defensive portfolio operated on a single assumption: downturns destroy demand, central banks respond by cutting rates, and bond prices rise as yields fall. Gold benefits from the same dynamic, as lower real rates reduce the opportunity cost of holding a non-yielding asset. The portfolio worked because the crisis type and the toolkit were structurally aligned.
A supply-side shock inverts that alignment. When oil-driven inflation forces central banks to hold or raise rates even as growth deteriorates, bonds face price pressure from both directions. Gold competes against rising yields. Currencies tied to energy importers weaken rather than strengthen.
The 2022 precedent made this visible. Pandemic supply chain disruption, compounded by the Ukraine energy shock, caused bonds and equities to fall together for the first time in a generation. The conventional diversification logic collapsed. The Iran War is running the same structural playbook, with a larger energy disruption at its centre.
The 1973 OPEC embargo parallel is instructive here: in that episode, as in the current one, the supply constraint was physical rather than financial, and ASX-listed energy refiners with crack-spread exposure outperformed both equities and traditional defensive assets because their revenue was structurally aligned with the shock rather than running against it.
Bundesbank research on supply-side uncertainty shocks, using gold and oil prices as identification instruments, found that supply-driven disruptions generate materially different financial market outcomes than demand-driven shocks, with inflation expectations moving in opposite directions and conventional safe haven assets responding in ways that undermine their defensive function.
The contrast between the two crisis types runs across four dimensions:
The Strait of Hormuz carries approximately 20% of global oil and liquefied natural gas supply. Its effective closure is not a temporary disruption but a structural shift in the inflation regime, one that produces what economists describe as stagflation.
“Simultaneously low economic growth, elevated inflation, and restrictive financing costs.”
That combination is the precise environment where the standard defensive toolkit stops working.
The mechanical chain is straightforward. Higher oil prices feed into inflation expectations. Markets price those expectations into bond yields at both the short and long ends of the curve. Bond prices, which move inversely to yields, fall.
At the short end, central banks are reconsidering rate cuts. The US Federal Reserve held its benchmark rate at 3.6% at the April 28-29 FOMC meeting and signalled that the next move would likely be a cut, tempering the most aggressive rate-hike scenarios. That signal provided some short-end relief, but it has not reversed the broader repricing.
At the long end, markets are pricing higher government borrowing in a prolonged conflict. The US 10-year Treasury yield rose approximately 6 basis points in the week of 21-28 April, settling in the 4.36-4.42% range by late April. The move is modest in isolation, but it compounds an already elevated yield environment.
For Australian investors, the domestic pressure is arguably sharper. The Reserve Bank of Australia raised the cash rate to 4.10% on 17 March 2026, with Commonwealth Bank and NAB forecasting further increases. Australian government bond prices are being compressed from both the global side (energy-driven yield repricing) and the domestic side (RBA tightening). Holders of domestic bond ETFs such as VAF or global hedged equivalents such as VBND face dual-front pressure.
The RBA monetary policy decision of March 2026 cited capacity pressures and higher fuel prices as the primary drivers behind the cash rate increase to 4.10%, confirming that energy-driven inflation was already shaping the domestic tightening cycle before the broader Strait of Hormuz disruption reached its full severity.
| Price pressure source | Stabilising factor |
|---|---|
| Short-end rate expectations held or rising | Fed signalling next move is a cut |
| Long-end borrowing fears in prolonged conflict | Institutional buying as yields reach attractive levels |
| USD strength compressing non-USD bond returns | Hedged positions partially offset currency drag |
| RBA domestic tightening cycle | Coupon income continues regardless of price |
Ten-year yields above 4% have historically attracted institutional accumulation, and current descriptions of institutional sentiment suggest a degree of downside support may be forming. This is a conditional observation: bonds may stabilise once rate expectations settle. It is not an endorsement of bonds as an active safe haven in the present environment.
Gold spiked to approximately $5,400 in early March 2026 as the Iran conflict escalated. The geopolitical demand impulse was real. Six weeks later, gold had retreated to the $4,577-$4,707 range in late April, declining approximately 2.7% in a single week and posting a 2.03% drop on 28 April alone.
The retreat is not random. Four compounding forces hit simultaneously:
The retreat from $5,400 looks less surprising when set against institutional gold price forecasts that have consistently modelled forced liquidation events as a downside scenario, with Goldman Sachs specifically flagging margin-call selling as a short-term risk even while maintaining a bullish medium-term outlook supported by central bank accumulation of 750-850 tonnes annually.
“Trading like stocks rather than as a traditional safe haven.”
That description from market analysts captures the current dynamic. The 13-15% retreat from the March peak is meaningful but not a structural collapse. Gold retains a role as a geopolitical tail-risk hedge in diversified portfolios, but its recent behaviour should recalibrate expectations about what that role delivers during a supply-side shock.
Japan holds one of the world’s largest overseas investment positions. During past crises, Japanese institutions and households repatriated capital, buying yen and strengthening it against risk currencies. The unwinding of yen-funded carry trades (where investors borrow in low-yielding yen to invest in higher-yielding assets) amplified the effect. For decades, crisis meant yen strength.
The Iran War is not a neutral geopolitical event for Japan. It is a direct economic shock.
The yen weakened approximately 1% against the USD in the week of late April 2026. Directional estimates of yen beta versus the MSCI World index suggest a reading of approximately +0.17, meaning the yen has offered little hedge against developed-market equity drawdowns during this conflict.
Australian investors who held yen-denominated assets or used the yen as a portfolio hedge have found the position moving against them. The energy-dependency mechanism clarifies when yen defensiveness might return: only when the Strait of Hormuz reopens or Japan secures alternative supply routes that reduce its concentrated Middle Eastern exposure.
The US dollar has done what the other defensive assets have not. US energy self-sufficiency insulates the dollar from the Strait of Hormuz shock, and the Fed’s hold at 3.6% with a signalled cut as the next move supports capital inflows into dollar-denominated assets. The pattern mirrors 2022, when the USD was also the primary functional haven during the Ukraine energy-driven inflation episode.
Strategists have positioned the US dollar as the primary remaining effective safe haven for equity investors during the current conflict.
The analytical logic follows directly from the preceding sections. Bonds face yield compression. Gold faces opportunity cost and crowding. The yen faces energy dependency. The USD faces none of these headwinds; its structural position is the inverse.
For Australian investors, however, the USD trade carries its own complication. The AUD/USD dynamic is influenced by the RBA’s divergent tightening path (raising to 4.10% while the Fed holds at 3.6%) and Australia’s own association with energy-exporting economies. Both the Australian dollar and the Canadian dollar have demonstrated relative resilience against broad USD strength for precisely this reason.
| Safe haven asset | Performance during Iran War | Key structural reason |
|---|---|---|
| Government bonds | Price compression; yields rising | Oil-driven inflation forces rates higher |
| Gold | 13-15% decline from March peak | High opportunity cost, crowded positioning, USD strength |
| Japanese yen | Weakened ~1% vs. USD in late April | 90%+ Middle East oil import dependency |
| US dollar | Strengthened as primary haven | US energy self-sufficiency; capital inflow |
The USD safe haven trade is real, but for Australian-dollar-based investors, the hedge is not simple or cost-free. Understanding the AUD/USD basis risk is a prerequisite before repositioning defensive allocations toward USD-denominated instruments.
Three traditional safe havens have simultaneously underperformed, leaving Australian investors with fewer diversification options than in a typical risk-off environment. The question is not whether to abandon defensive positioning entirely; it is which instruments still function and in what capacity.
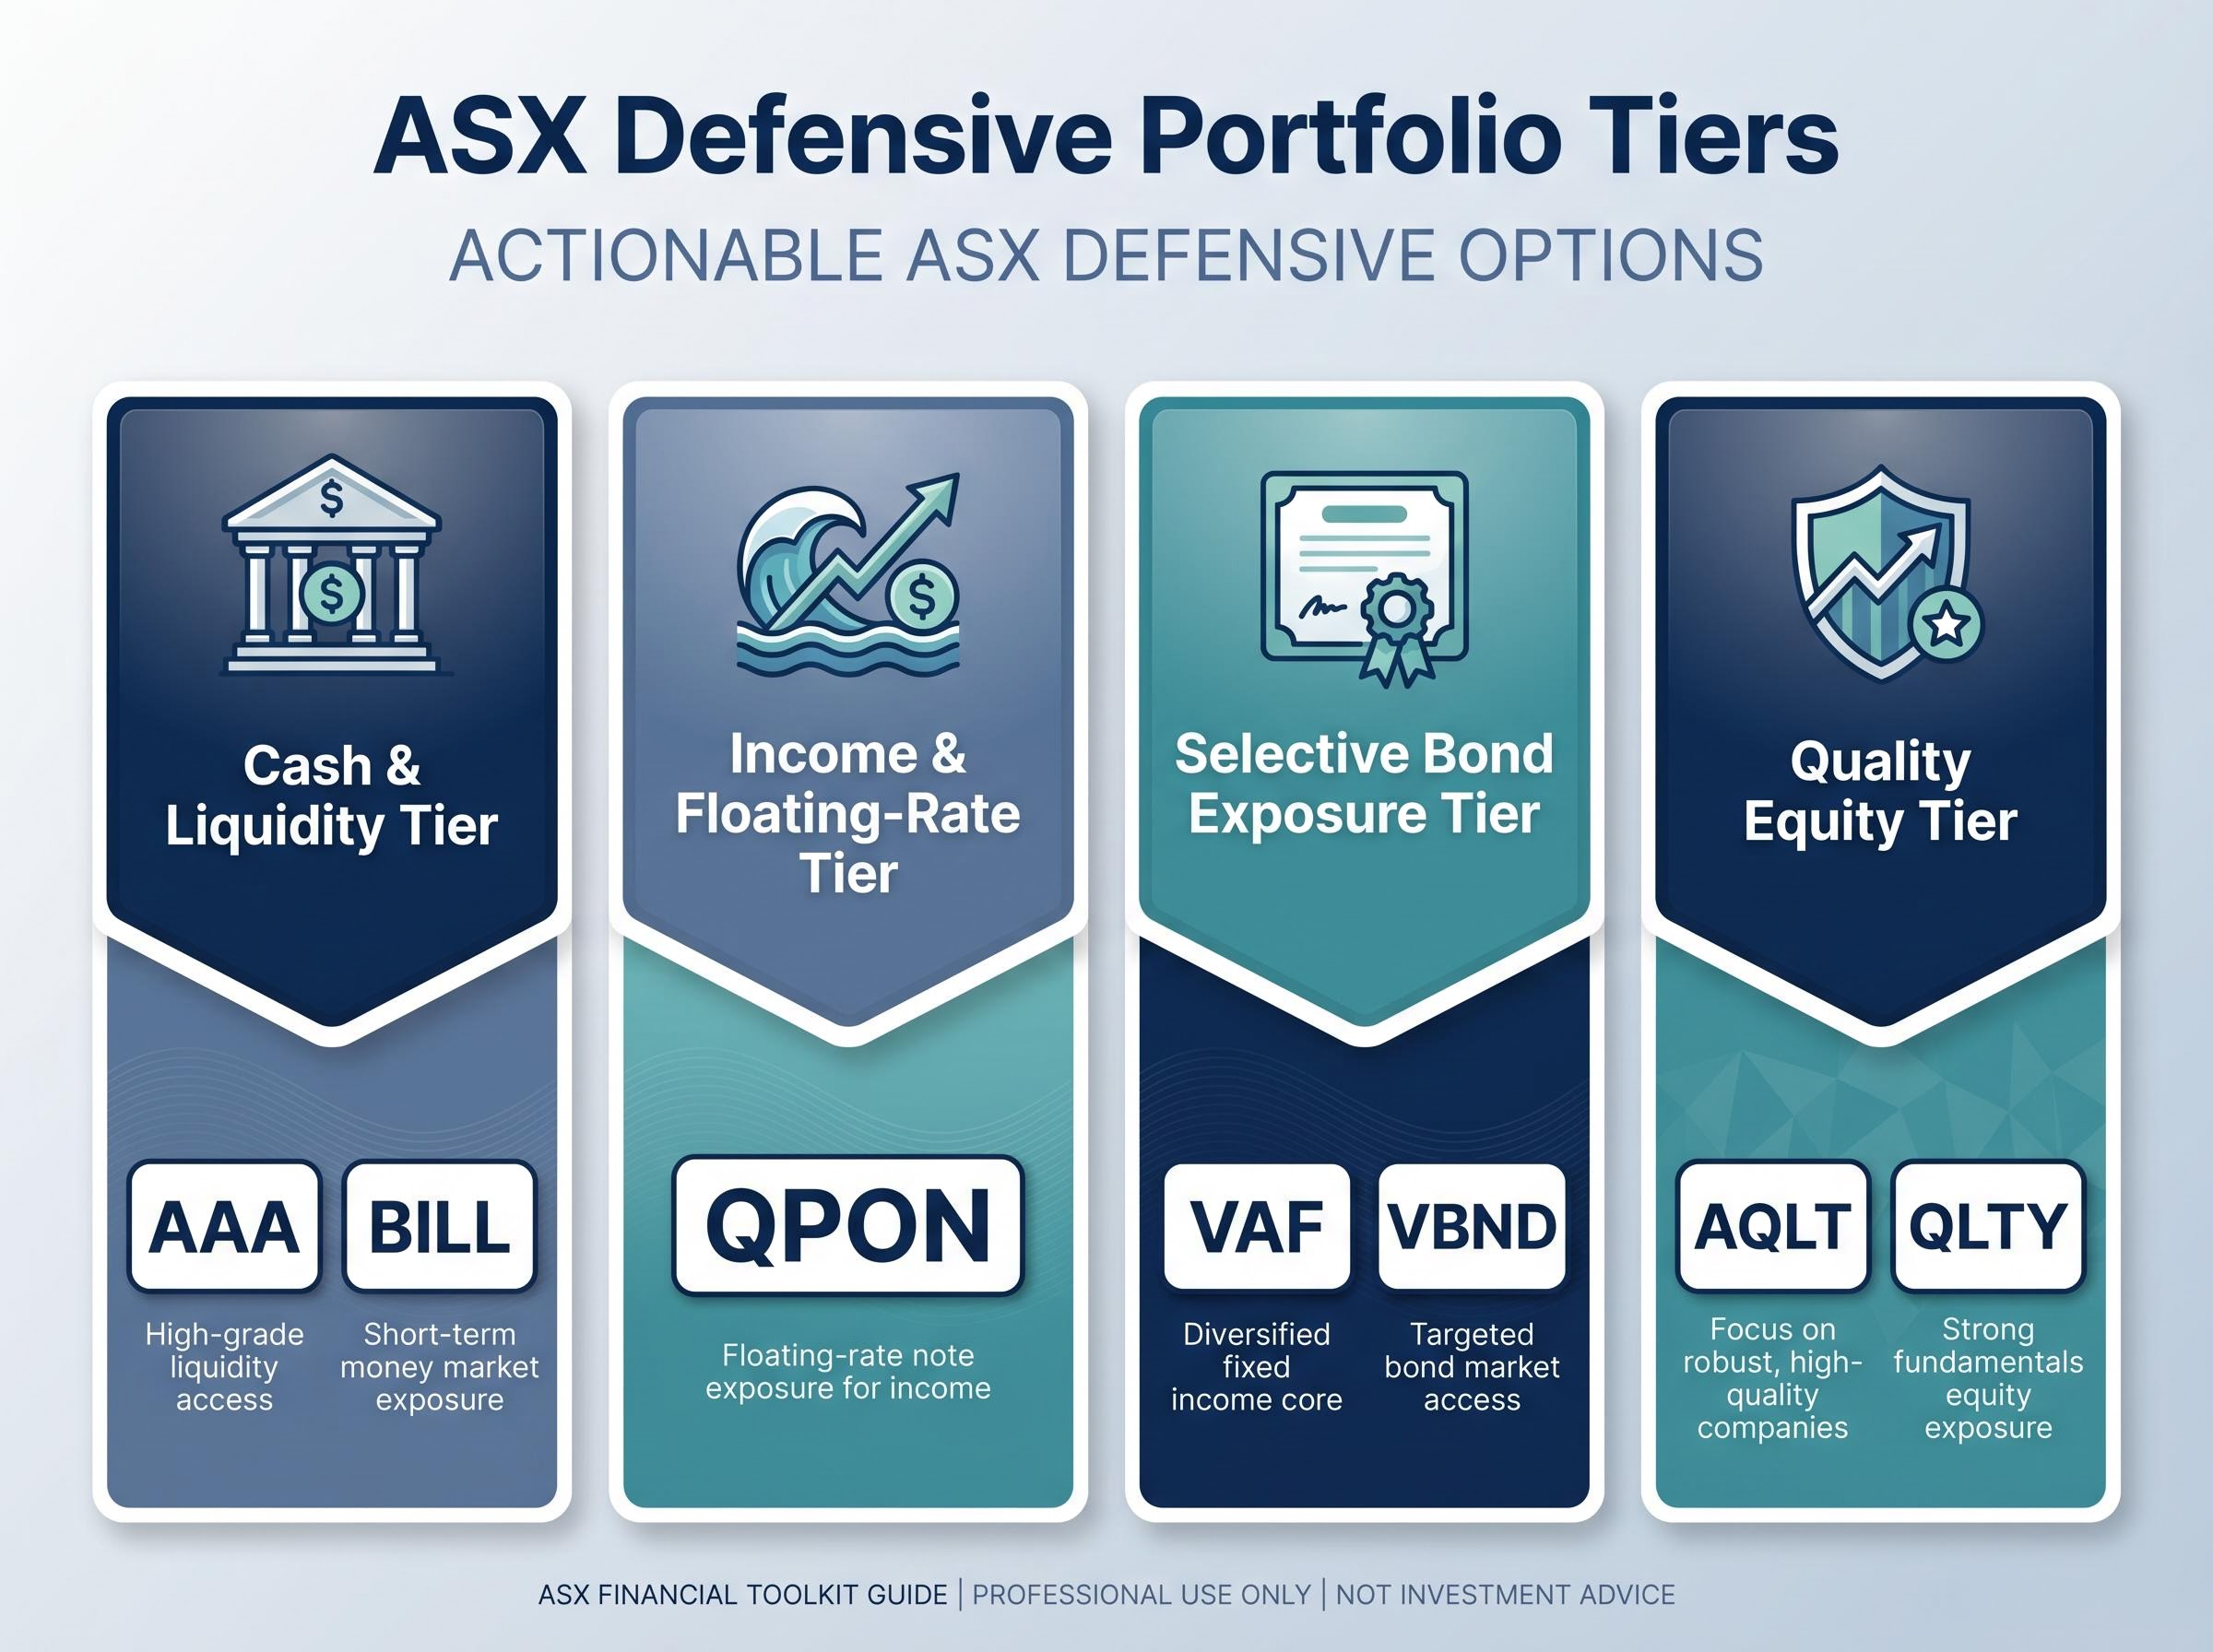
Strategists have identified USD-denominated assets or hedged global equity positions as core defensive allocations, supplemented by selective gold exposure for tail-risk hedging rather than inflation protection. For ASX-listed investors, the practical options group by defensive function:
Inflation portfolio construction in a stagflationary environment has pushed many Australian investors toward a revised 40/30/20/10 framework (equities, bonds, alternatives, cash) that increases the alternatives allocation specifically to accommodate physical gold and commodity exposure alongside, rather than instead of, conventional bond and equity positions.
The recovery scenario offers a degree of structural optimism. The current crisis is more narrowly focused on energy than 2022, which also involved simultaneous pandemic recovery and supply chain pressures. Rates are already at elevated levels, limiting how much further central banks can realistically tighten. Historical evidence suggests markets rebound quickly once a credible de-escalation path emerges.
This article is for informational purposes only and should not be considered financial advice. Investors should conduct their own research and consult with financial professionals before making investment decisions. Past performance does not guarantee future results. Financial projections are subject to market conditions and various risk factors.
The failure of bonds, gold, and the yen as defensive assets during the Iran War is not a permanent regime change. It is a predictable consequence of a specific and historically uncommon crisis type: a supply-side shock severe enough to generate stagflation. The toolkit was designed for demand-driven downturns. When the crisis arrived in a different form, the toolkit stopped working.
As of late April 2026, the hierarchy of defensive options stands as follows: USD exposure leads; selective gold for tail risk; cash and floating-rate instruments for stability; bonds as a conditional hold rather than an active haven.
The conditions that would restore traditional defensive effectiveness are knowable and monitorable:
Investors who understand the conditional nature of this safe haven failure are better positioned to act when conditions reverse, rather than abandoning assets that will likely reclaim their defensive characteristics once the supply shock resolves.
For Australian investors ready to translate the safe haven analysis into a specific portfolio action plan, our dedicated guide to supply-side inflation ETF positioning maps a three-pillar framework across income instruments (CRED, VBND), diversification vehicles (VGS, QUAL), and liquidity buffers (AAA, ISEC), and explains why sitting in cash while CPI runs at 4.6% still produces a negative real return even at competitive savings rates.
Safe haven assets are investments traditionally expected to hold or gain value during market stress, including government bonds, gold, and the Japanese yen. During the Iran War, these assets are underperforming because the crisis is a supply-side shock driven by oil disruption, which causes inflation rather than deflation, forcing central banks to hold or raise rates rather than cut them, which is the opposite condition these assets were designed to benefit from.
Gold retreated from its March 2026 peak of approximately $5,400 to the $4,577-$4,707 range by late April due to four compounding forces: high opportunity cost from elevated interest rates (Fed at 3.6%, RBA at 4.10%), a crowded trade unwinding after an 80% run-up in the two prior years, forced liquidation from margin calls during broad market volatility, and USD appreciation making gold more expensive for non-USD buyers.
The US dollar has been the primary functional safe haven during the Iran War, as US energy self-sufficiency insulates it from the Strait of Hormuz disruption, and the Fed's hold at 3.6% supports capital inflows into dollar-denominated assets. However, Australian-dollar-based investors face basis risk when repositioning into USD-denominated instruments due to the AUD/USD dynamic.
Strategists recommend a revised framework using cash and money market ETFs (such as AAA and BILL) for capital security, floating-rate bond ETFs (such as QPON) to benefit from rising rates, selective bond exposure through VAF or VBND, and quality equity ETFs (such as AQLT and QLTY) for equity-side defensiveness, while treating gold as a tail-risk hedge rather than an inflation protection tool.
Japan imports more than 90% of its oil from the Middle East, with a large proportion transiting the Strait of Hormuz, meaning the conflict is a direct economic shock to Japan rather than a neutral geopolitical event. Energy-driven inflation is preventing the Bank of Japan from meaningful monetary tightening, eliminating the interest rate differential mechanism that historically triggered yen-strengthening carry trade unwinds during crises.