
Australian ETF investors poured $5.6 billion into the market in March 2026, the third-highest monthly inflow on record, even as the S&P/ASX 200 fell 7.8% in the same month. That is not panic. That is discipline at scale.
The Iran War has created a genuinely unusual market environment. Safe haven assets have underperformed. Bonds and equities have fallen together. Oil supply disruption through the Strait of Hormuz is driving inflation fears, and the Reserve Bank of Australia (RBA) has responded by hiking the cash rate to 4.1%. For Australian investors, the question is not whether to weather this volatility but how to structure a portfolio that does so without sacrificing long-term growth or income.
This guide explains why traditional safe havens have disappointed, how bonds still offer value through coupon income even as prices fall, which ASX-listed ETFs are positioned for capital preservation and income generation, and why staying invested with discipline remains the most evidence-supported strategy for long-term Australian investors navigating volatile markets.
How supply shocks break the rules that investors rely on
The assets that were supposed to provide protection during the Iran War have not. Gold has fallen. Bonds have dropped alongside equities. The diversification benefit that worked during the Global Financial Crisis (GFC) and the COVID-19 crash has, for many portfolios, vanished. The frustration is understandable, but the reason is structural, not random.
The Strait of Hormuz closure removed approximately 20% of global oil and LNG supply from the market, making this the largest supply-side disruption in decades.
Supply-shock crises operate under different rules than demand-collapse crises. Understanding the distinction matters:
- Bond behaviour: In demand collapses (GFC, COVID), central banks cut rates and bonds rallied as equities fell, providing the expected hedge. In supply shocks, inflation forces central banks to raise rates, pushing bond prices down at the same time equities decline. LSEG data confirms that correlations between global equity and government bond returns tighten during supply-shock periods.
- Gold behaviour: Gold appreciated approximately 80% over the two years before the conflict, making it a crowded trade. When leveraged investors faced margin calls during the March sell-off, gold positions were unwound to meet obligations. Rising rates also made income-free assets less competitive, and US dollar strength raised costs for non-USD buyers.
- Currency behaviour: The US dollar has functioned as the one reliable safe haven, supported by American energy self-sufficiency and rate expectations. The Japanese yen’s traditional refuge status has been undermined by Japan’s heavy oil import dependency. Among non-USD currencies, the AUD and Canadian dollar have outperformed, driven by net energy-exporting status. The AUD reached approximately 70.8 US cents by late April 2026, up from around 66.78 US cents in early 2025.
NBER research on stock-bond return correlation identifies positive supply shocks as a distinct regime in which equities and bonds fall together rather than offsetting each other, providing academic grounding for why the diversification benefit that functioned during the GFC and COVID-19 has not applied in the current environment.
The 2022 parallel, when simultaneous supply chain disruption and energy shock produced the same bond-equity correlation breakdown, confirms this is a recognisable pattern. Doubling down on underperforming safe havens or abandoning a strategy out of confusion are both responses that misread the environment.
Australia’s inflation outlook in mid-2026 is shaped by two forces pulling in opposite directions: the near-term inflationary impulse from elevated Brent crude and rising domestic energy costs, and longer-run deflationary pressures from AI-driven productivity gains and supply chain normalisation.
When big ASX news breaks, our subscribers know first
What supply shocks do to bonds, and why fixed income still earns its place
Bond investors have taken losses this year. That is real. The instinct to question whether fixed income deserves a place in a portfolio right now is reasonable. But the full picture requires separating what is happening to bond prices from what bonds are actually delivering.
Why bond prices are falling
Bond prices move inversely to yields. When yields rise, existing bonds with lower coupon rates become less attractive, and their prices fall. That inverse relationship, where yield goes up and price goes down, is the core mechanic at work.
Both ends of the yield curve are under pressure from different forces. On the short end, the RBA’s March 2026 hike to 4.1%, with market expectations of a further move in May 2026, has pushed short-dated yields higher. On the long end, anticipated government borrowing to fund conflict-related spending has added upward pressure to yields. The result is a bond market where prices are falling across maturities.
US 10-year Treasury yields climbed to approximately 4.4% as of April 2026, reflecting the same inflation-driven repricing across developed markets. Trimmed mean inflation for Q1 2026 is forecast at approximately 3.5%.
Why bonds still pay
Total return from fixed income includes both price movement and coupon income. The coupon component continues delivering regardless of interim price volatility. At current yield levels, the income generated by holding bonds is materially higher than it was two years ago.
BNP Paribas Asset Management (published 15 April 2026) framed the outlook as short-term pain from inflation-driven yield increases, with longer-term bond benefit as growth slowdowns materialise from the conflict’s economic drag.
There is also a mispricing argument worth considering. The current crisis is narrower in scope than 2022. Rates are already at restrictive levels. Markets may be overestimating how many further hikes the RBA will deliver, meaning rate-sensitive assets could recover sharply once geopolitical tension eases and institutional interest at higher yields, already noted by BNP Paribas Asset Management, accelerates.
There is a credible case that the RBA rate hike cycle has less distance to run than current market pricing implies, with oil futures backwardation signalling that the inflationary impulse from the Strait of Hormuz disruption may be temporary, and Oxford Economics modelling pointing to potential GDP contractions in the June and September 2026 quarters that would shift the RBA’s dominant concern from inflation to growth.
What the Iran War is actually teaching us about investor behaviour
March 2026 produced one of the clearest real-time case studies in Australian investor psychology. The data does not support the assumption that volatility triggers mass selling. It supports the opposite.
Australian ETF investors added $5.6 billion to ASX ETFs in March 2026, the third-highest monthly inflow on record, even as equities posted their sharpest monthly decline of the year.
The composition of those flows reveals where discipline was directed. Investors rotated capital into broad Australian and international equities while reducing exposure to US equities, high-yield bonds, and gold.
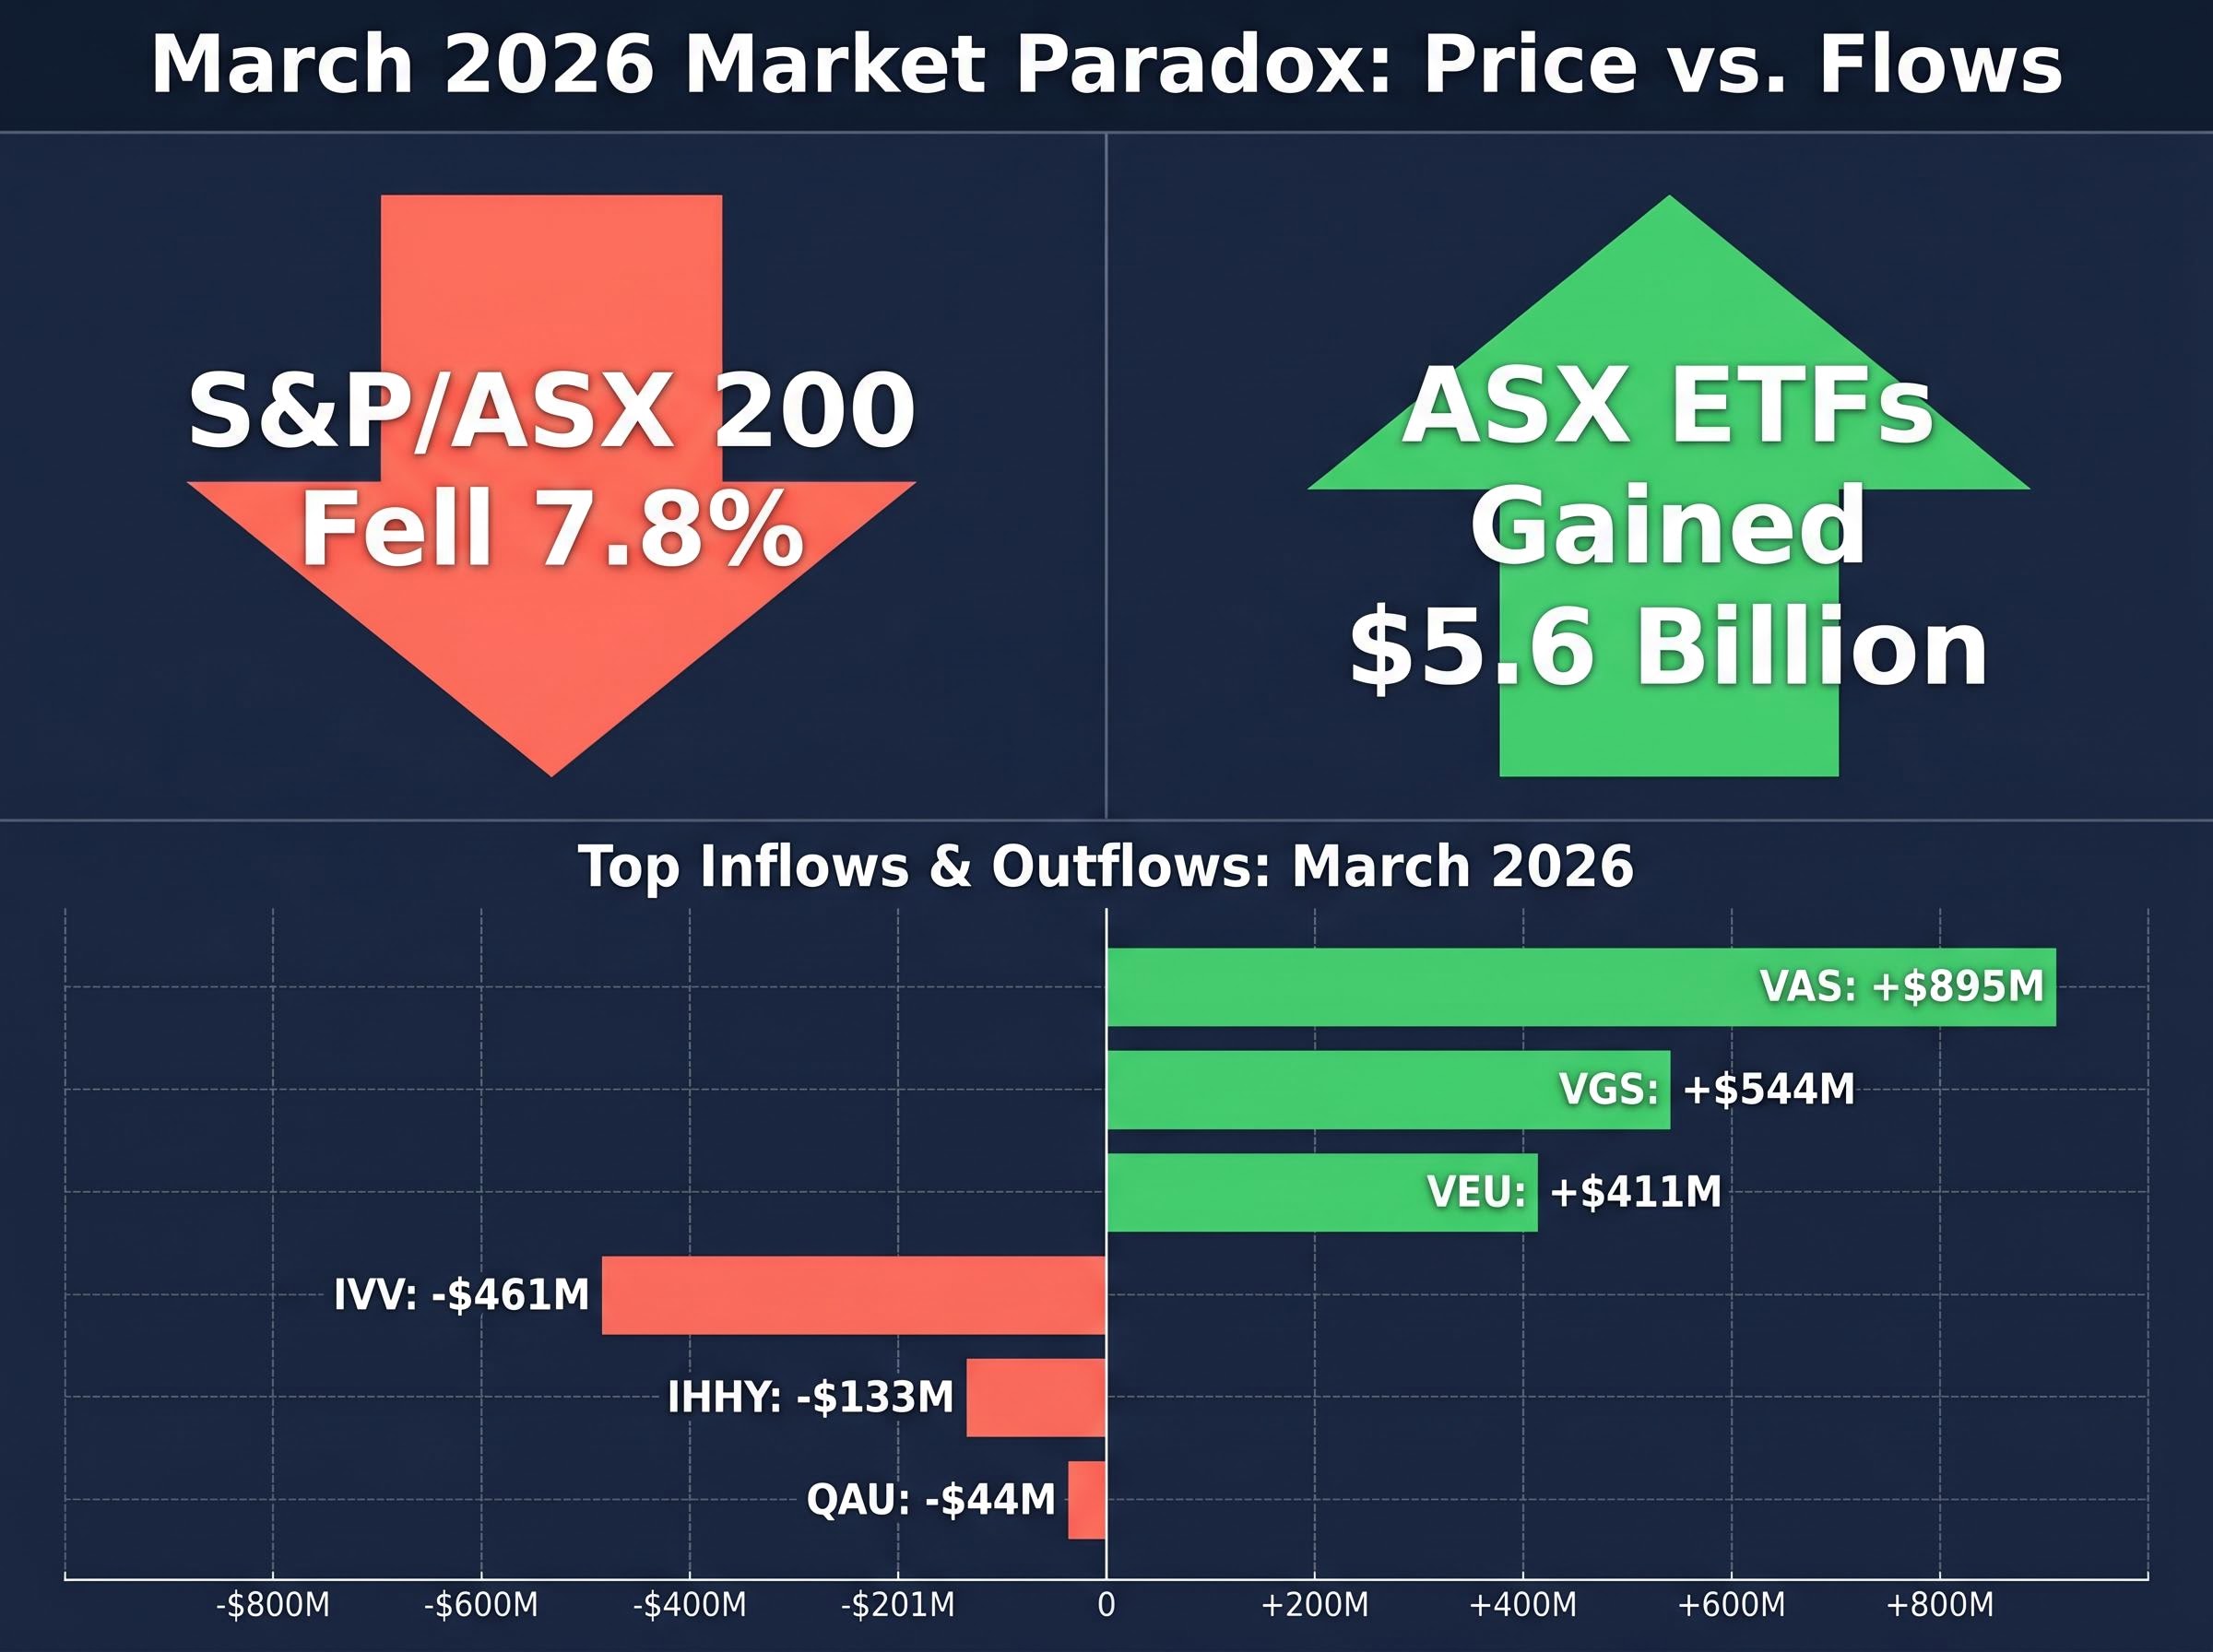
| Top Inflows (ETF) | Flow | Top Outflows (ETF) | Flow |
|---|---|---|---|
| VAS (Vanguard Australian Shares) | +$895M | IVV (iShares S&P 500) | -$461M |
| VGS (Vanguard International Shares) | +$544M | IHHY (Global High Yield Bonds) | -$133M |
| VEU (Vanguard All-World ex-US) | +$411M | QAU (BetaShares Gold Hedged) | -$44M |
The behavioural lesson sharpens when set against historical parallels. During the COVID-19 crash, the ASX 200 fell approximately 36% between February and March 2020. Investors who sold at the bottom locked in permanent losses. Those who stayed invested and continued regular contributions recovered within months. The GFC required a multi-year recovery, but the principle held: exit timing destroyed returns while sustained participation captured the rebound.
The S&P/ASX 200’s 7.8% March drawdown was largely recovered by approximately 20 April 2026, implying the geopolitical shock lasted roughly six weeks in equity terms. Superannuation members who switched investment options during the downturn, a common but typically counterproductive response for those not approaching retirement, may have missed the bulk of that recovery.
The March 2026 data shows that Australian investors, collectively, chose discipline over reaction. The individual investor can draw on the same evidence base.
Building your portfolio layer by layer: cash, income, and growth
A portfolio built for volatile conditions is not a single allocation decision. It is a sequence of deliberate layers, each serving a distinct function. The order matters because each layer determines how much pressure the next one absorbs.
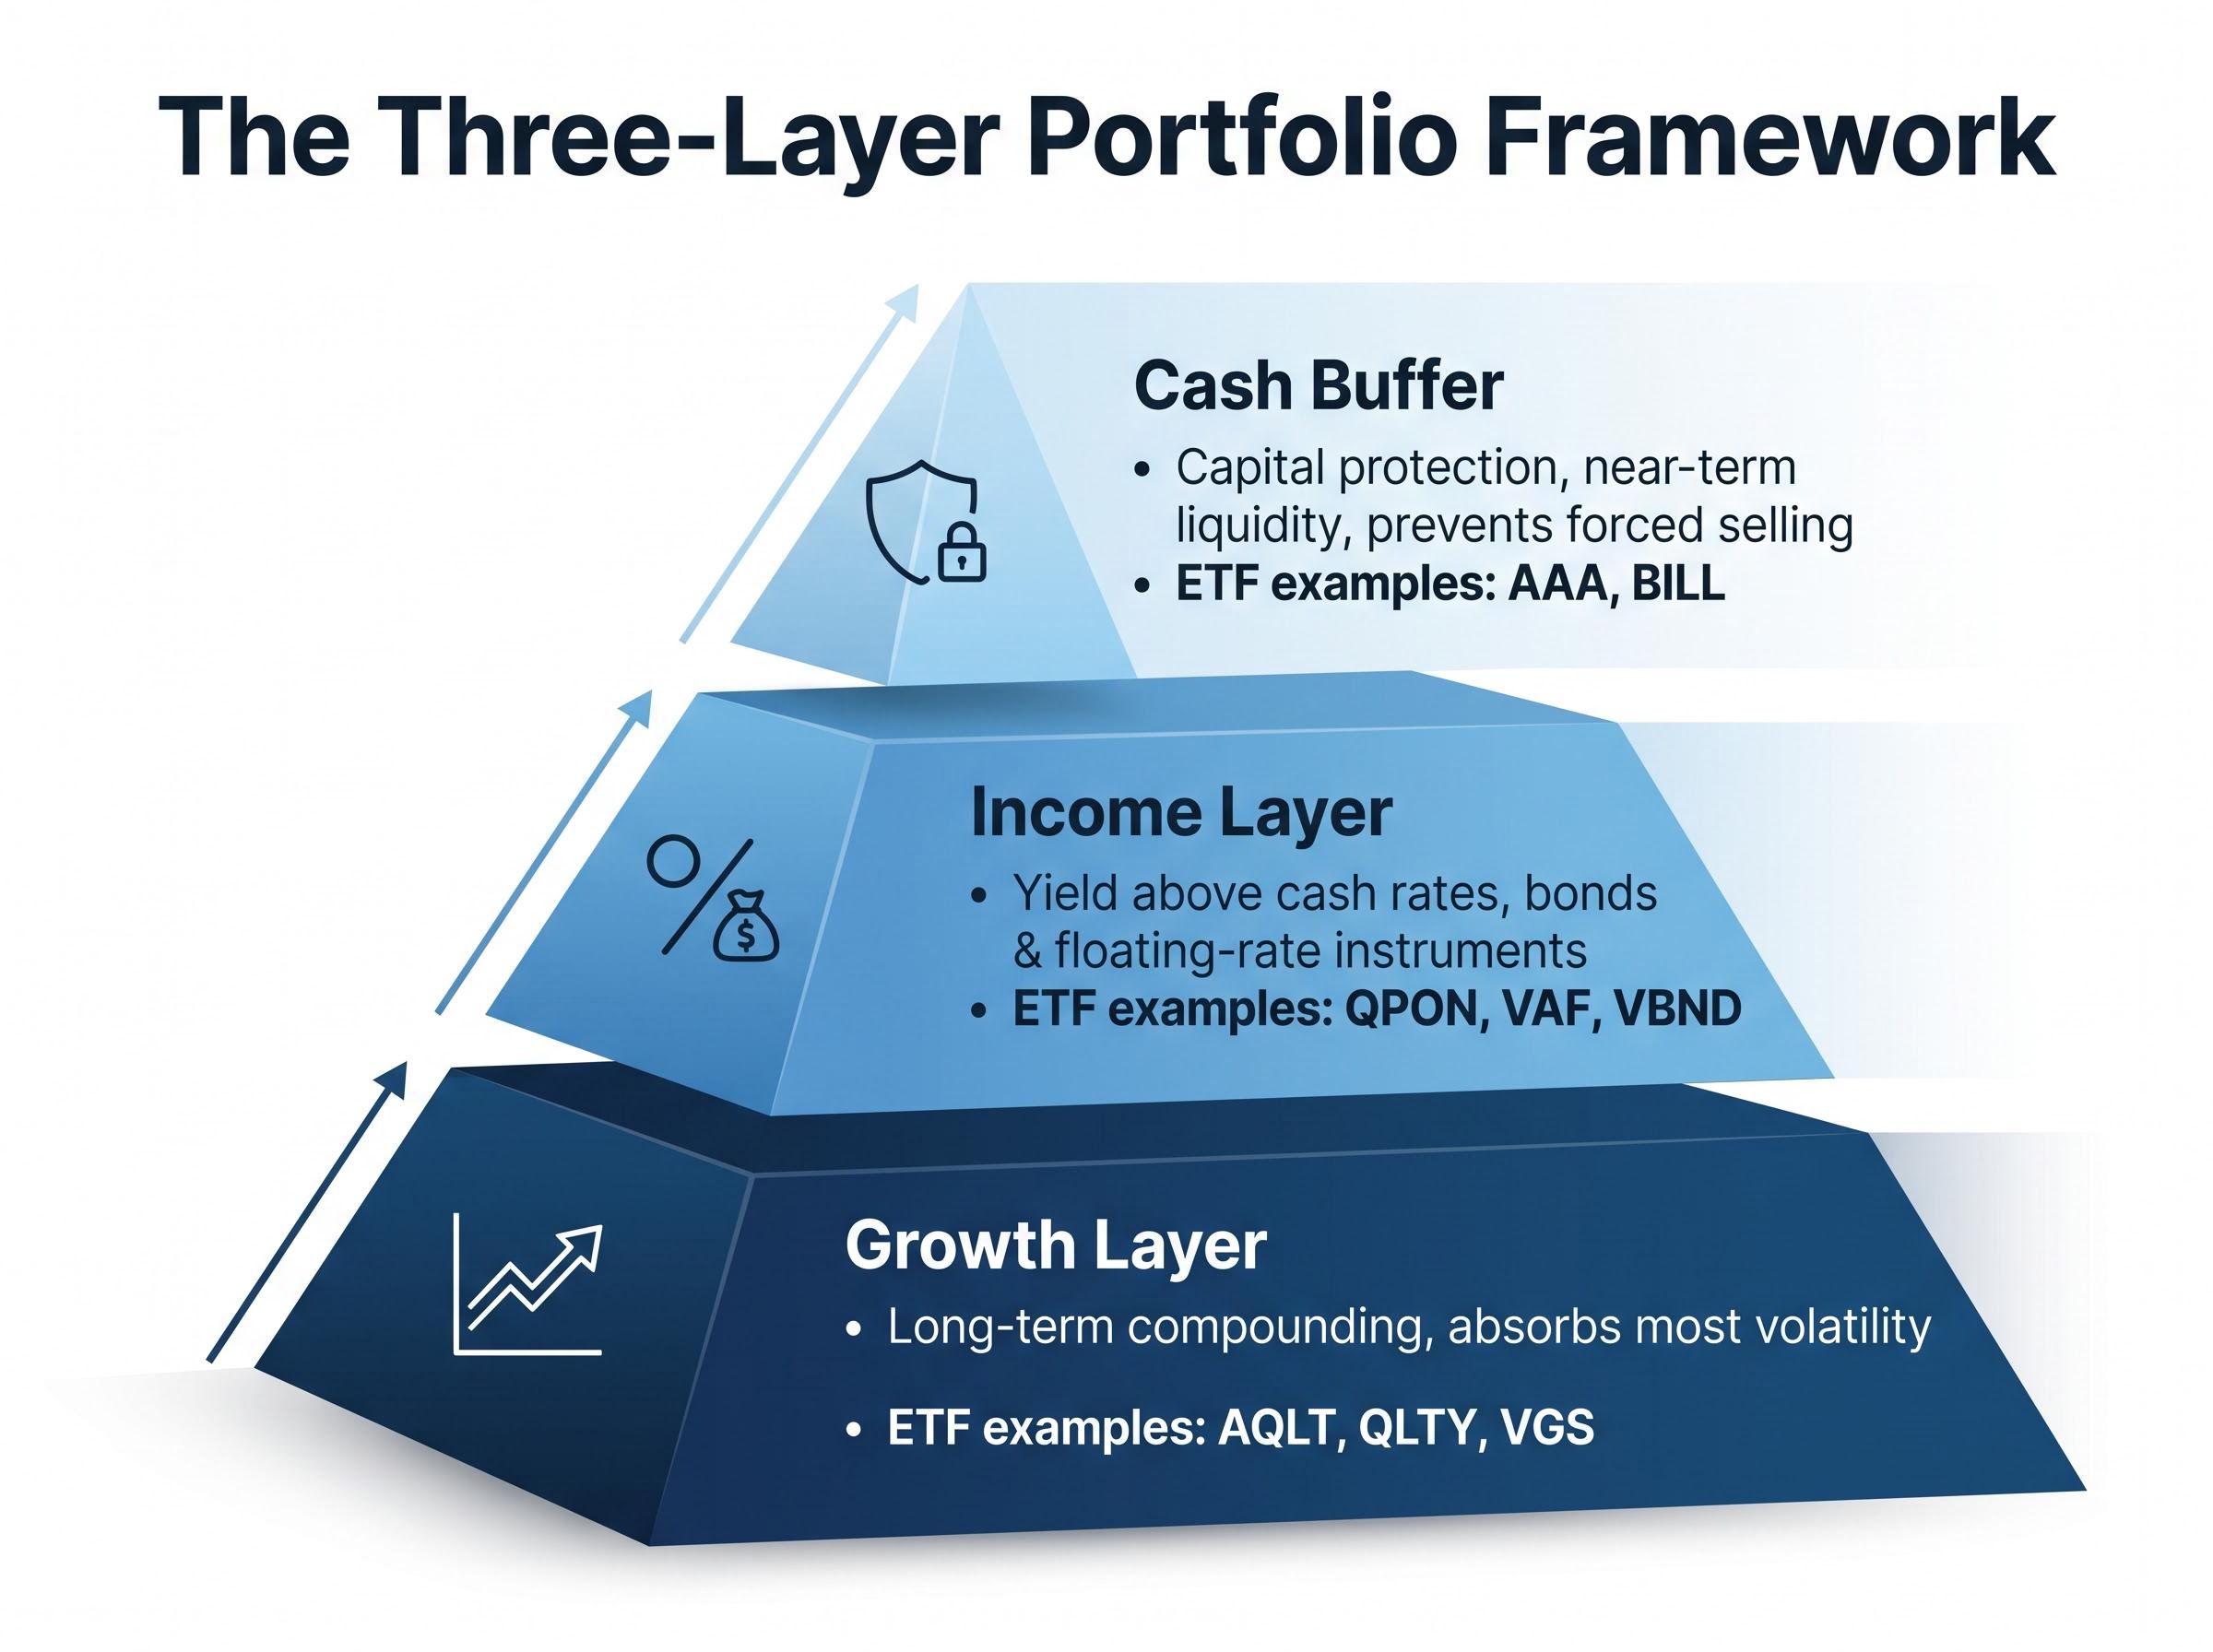
The three-layer framework operates as follows:
- Cash buffer: Provides capital protection and near-term liquidity. Prevents forced selling during drawdowns by ensuring short-term obligations can be met without touching growth assets.
- Income layer: Generates yield above cash rates through bonds and floating-rate instruments. Delivers regular distributions that compound over time, regardless of price volatility in equity markets.
- Growth layer: Captures long-term compounding through diversified equity exposure across Australian and international markets. This layer absorbs the most volatility but delivers the highest expected returns over multi-year horizons.
Excessive cash allocation sacrifices income opportunity. Insufficient cash creates forced-selling risk during drawdowns. The cash buffer is a functional decision, not a defensive one.
The following ASX-listed ETFs illustrate the options available across each layer. These are presented for informational context, not as universal recommendations.
| ETF Ticker | Asset Class | Role in Portfolio | Layer |
|---|---|---|---|
| AAA | Cash (bank deposits) | Capital preservation, regular income distributions | Cash |
| BILL | Money market instruments | Short-term liquidity with capital stability | Cash |
| QPON | Floating rate bonds (Aus banks) | Monthly income above cash rates | Income |
| VAF | Australian government and corporate bonds | Broad fixed income exposure | Income |
| VBND | Global aggregate bonds (AUD-hedged) | Diversified global bond income | Income |
| AQLT | Australian quality equities | 40 high-quality companies selected on ROE, low leverage, earnings stability | Growth |
| QLTY | Global quality equities | 150 global companies ranked on quality factors including ROE and cash flow | Growth |
| VGS | International developed market equities | Exposure to over 1,000 large-cap companies; recorded $544M in March 2026 net inflows | Growth |
How much sits in each layer depends on the individual investor’s time horizon, income needs, and genuine risk tolerance, not on last month’s market headline.
A revised inflation portfolio strategy that allocates across quality equities, global aggregate bonds, high-interest cash instruments, and a targeted alternatives sleeve offers a structural response to simultaneous asset class declines rather than the standard 60/40 split that assumed bonds and equities would move inversely.
Practical habits that turn volatility into a long-term advantage
Markets are volatile. That does not change. What changes is whether the investor has a repeatable process for responding to it. The following four disciplines, applied as a coordinated sequence rather than isolated tips, turn drawdown anxiety into a structural advantage:
- Stay invested. Historical data consistently shows that investors who remain in the market through volatility capture recovery gains. The ASX 200’s six-week recovery from its March 2026 low is the most recent confirmation. Exiting locks in losses and creates the secondary problem of deciding when to re-enter.
- Diversify across asset classes and geographies. This is not a generic principle; it is a specific risk response to the current environment. Spreading exposure across Australian equities, international equities, bonds, and cash buffers reduces single-event exposure. BetaShares has flagged prolonged oil disruption and elevated inflation as the tail risks to factor into diversification decisions.
- Dollar-cost average. Regular, fixed contributions automatically buy more units when prices fall and fewer when prices rise. In a falling market, DCA lowers the average entry price without requiring the investor to time any individual purchase.
- Reassess risk tolerance honestly. Drawdowns reveal whether a portfolio’s asset allocation genuinely matches the investor’s actual appetite for loss. A calm review during volatility is more valuable than a reactive allocation change made under pressure.
Dollar-cost averaging works most powerfully not as a return-optimisation tool but as a behavioural circuit breaker, removing the investor from the entry-price decision at the exact moment market anxiety peaks and automated platforms such as Interactive Brokers and Betashares Direct make this systematic approach accessible without requiring manual intervention at each contribution date.
Tactical tools: DCA and tax-loss harvesting
Dollar-cost averaging works mechanically in a falling market by purchasing additional units at each lower price point, reducing the portfolio’s average cost basis. For Australian investors, tax-loss harvesting offers a secondary benefit: realising losses on positions that have declined can offset capital gains elsewhere, reducing the overall tax obligation. Transaction costs and reinvestment timing should be factored in before executing this strategy.
Strategic reset: reviewing your risk tolerance during drawdowns
A drawdown is not a prompt to sell. It is a prompt to review. The distinction matters. A reactive reallocation, moving to cash after a 7.8% decline, is typically counterproductive. A considered reassessment, asking whether the portfolio’s equity weighting reflects genuine comfort with this level of volatility, is valuable.
Superannuation members should be particularly deliberate. Switching investment options during downturns is common but often results in selling low and missing the recovery. For those not approaching retirement, staying in a long-term growth option typically remains the evidence-supported approach. Morningstar Australia noted on 17 April 2026 that post-recovery equity risk-reward had improved, supporting the case for maintaining equity exposure.
ASIC’s MoneySmart provides Australian-specific guidance on managing market volatility for retail investors seeking additional resources.
ASIC MoneySmart guidance on share market volatility outlines the same principles that the March 2026 flow data reflects in practice: maintaining a long-term focus, avoiding emotionally driven decisions, and preserving diversification through periods of market stress.
The ASX 200 has recovered. The structural questions have not.
The S&P/ASX 200’s recovery by mid-April 2026 resolved the headline anxiety. It did not resolve the inflation, rate, and oil-supply risks that persist as structural headwinds. The RBA remains at 4.1%, trimmed mean inflation sits around 3.5%, and the conflict’s secondary economic effects have not fully materialised.
The three-layer portfolio framework, cash for protection, income for yield, growth for compounding, offers a structure that does not depend on predicting which of those headwinds eases first. Rate-sensitive assets, including bonds and quality equities, could recover sharply if conflict de-escalation continues and the RBA signals a pause. That outcome remains possible, not certain.
The $5.6 billion that Australian investors committed to ETFs in March 2026 showed what disciplined behaviour looks like at scale. Portfolio decisions anchored to individual financial goals, time horizon, and risk tolerance, rather than short-term market movements, remain the most evidence-supported approach.
Investors considering changes to their portfolio in the current environment should consult a licensed financial adviser for guidance tailored to their personal circumstances.
This article is for informational purposes only and should not be considered financial advice. Investors should conduct their own research and consult with financial professionals before making investment decisions. Past performance does not guarantee future results. Financial projections are subject to market conditions and various risk factors.